

Ekaterina Panteley/iStock via Getty Images
Context Of The Article
Aerospace & Defense major – Raytheon Technologies Corporation (NYSE:RTX) is a stock that appears to have a lot of fine fundamental qualities that could prove to be useful for someone who’s looking to build wealth over time; one of those qualities is the dividend angle which will be the primary focus of the article. After gauging RTX’s dividend prowess on a standalone basis, I will then attempt to juxtapose it against other stocks in the aerospace and defense (A&D) space, before concluding with some thoughts on the technicals and the valuations.
Is RTX Stock’s Dividend Reliable?
Raytheon’s dividend qualities have not germinated of late; rather, this is something the company has stayed true to, for over three decades now (to be precise, it has been paying quarterly dividends for 32 straight years now). This is a commendable achievement when you consider that its peers in the cyclical A&D space have typically only been distributing dividends over the last 13 years or so. RTX also has a fairly decent track record in growing its dividends (22 years), and this too is miles ahead of the 2-year track record that one typically associates with the A&D sector. Given its commitment to its shareholders over this long period, I suspect it would only take an egregious turn of events for the company, to do away with its dividends.
In light of its long dividend history, you would think the company would have a clear-cut dividend policy that it had been following over the years; well, whilst they don’t have an exclusive dividend policy, there is an ongoing plan to share $20bn worth of distributions (which also includes buybacks) with shareholders between 2020 and 2025.
As things stand, $9bn of those distributions have already gone out to shareholders. This year, RTX recently bumped up its quarterly dividends by ~8% to 0.55 per share; on an annualized basis, this would then translate to an outflow of $3.1-3.3bn a year. Also, consider that they have an ongoing buyback program with $5.2bn worth of shares yet to be bought back. Nonetheless, with the RTX share price at relatively elevated levels, I doubt they will deploy the bulk of those funds at this juncture. Assuming they only deploy half those funds this year ($2.6bn), you’re looking at a total distribution outflow of $5.7bn-6bn ($3.2bn of divis+$2.6bn of buybacks) this year.
Can RTX service this outflow comfortably? When I say ‘comfortably’, I mean without the aid of external debt. Well, I’m not sure one can call it comfortable, but I believe they could manage this. Do note that in the recently concluded Q1, they were initially expected to witness a negative FCF outflow of -$500m, but they ended up witnessing a small positive inflow of $37m. Over the rest of the year, management feels that FCF generation will pick up and they could end the year with $6bn of FCF which should just about cover the potential distribution outlay for the year.
Now, if for some reason cash flow generation was to fall short of that figure, you’d be looking for some support from potential divestments which could come through later this year (acquisition spend, if any, will likely be oriented towards bolt-on deals, rather than any big-ticket transformation deals so I wouldn’t expect total M&A spend to be a massive cash guzzler). I’m not suggesting that we would see the same quantum of inflows via divestments but just for some context over the last two years, they’ve been able to generate around $2.2bn of cash per year via divestments; RTX management has previously suggested they would be open to divesting some of the businesses within the Collins Aerospace Systems, so perhaps one could expect some developments on this front in H2-22, which could be quite handy in covering the dividends and buybacks.
How Good Are Raytheon’s Dividend Credentials?
Rating Raytheon’s broad dividend profile on a standalone basis may come across as quite subjective; I suppose the more enlightening exercise would be to also juxtapose some of its key dividend metrics versus other dividend-paying peers in the A&D space. Thus, in this section of the article, I’ve measured 15 other A&D stocks (besides RTX) using four broad criteria, namely:
- Yields (Higher scores are allotted to stocks with higher absolute yields, and a higher positive variance relative to the historical yield average)
- Payouts (Higher scores are allotted to stocks with larger payouts and larger cash payouts)
- Growth (Higher scores are allotted to stocks with a superior track record of dividend growth over the short, medium, and long-term)
- Consistency (Higher scores are allotted to those stocks with a longer track record of paying and growing their dividends)
A stock that tops the table under any particular metric receives a score of 16 (as there are 16 stocks in this study) and the stock which finishes at the bottom receives a score of 1. In effect, these stocks are measured across nine separate metrics and the figures across each metric are totaled to arrive at an aggregated score which determines the final rank.
So, what are the conclusions?
Seeking Alpha, YCharts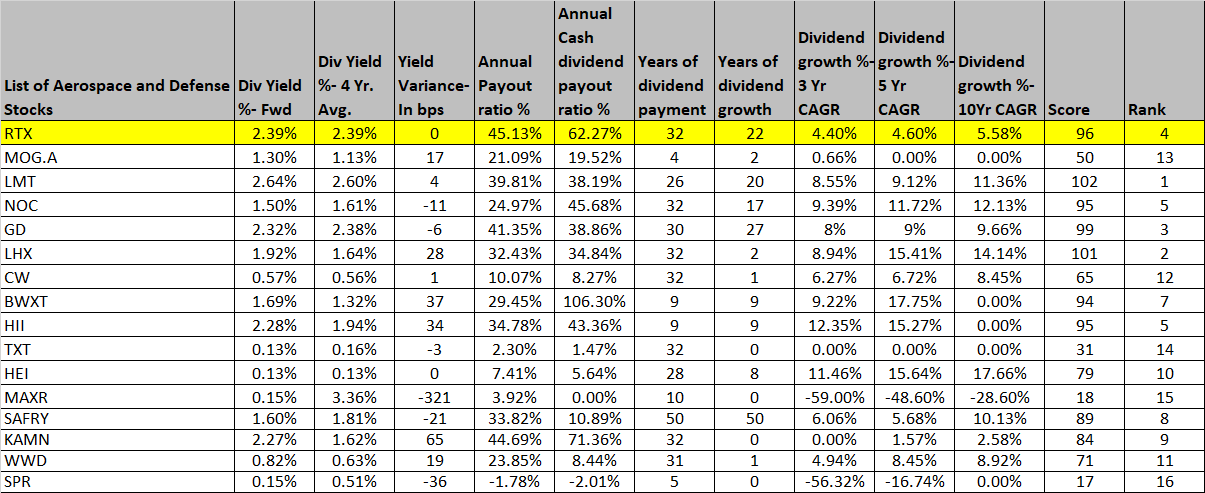
Well, looked at in isolation, Raytheon’s current yield of 2.39% is quite handy, as it is comfortably ahead of the peer set average of 1.37% and is only beaten by what Lockheed Martin (LMT) offers. However, with regards to RTX’s own history, things are just fair, as it currently trades bang in line with its historical average.
Raytheon scores very highly on the payout front, topping the charts with a 45% payout ratio; I’ve augmented this with the cash dividend payout ratio which is probably a more appropriate metric to gauge payout capabilities, given that it measures the quantum of FCF that is paid out as dividends and thus negates earnings manipulation risks. Even here, RTX scores fairly highly with a ratio of 62%, which makes it amongst the top 3 stocks in this segment.
As mentioned in the previous section of this article, we already know RTX has a fairly long and consistent history of paying and growing its dividends, but on a relative basis, seven other peers have been able to match up or beat RTX for its longevity in paying dividends. However, when it comes to growing its dividends over a long period, once again RTX fares very highly, falling short of only two stocks – General Dynamics (GD) and Safran (OTCPK:SAFRY).
If there’s one criticism of RTX’s dividend profile, it’s that, it hasn’t been overly generous with growing its dividends, either on a short, medium, or long-term basis; typically, this has only grown by around mid-single digit levels across various periods, whereas other companies have been a lot more generous, with some of them even delivering double-digit growth in their dividends.
If not for the mediocre scores on the growth front, I believe RTX could have topped this table; but yet still, a 4th spot ranking amongst 15 odd stocks is not bad at all.
Closing Thoughts – Is RTX Stock A Buy, Sell, Or Hold?
TradingView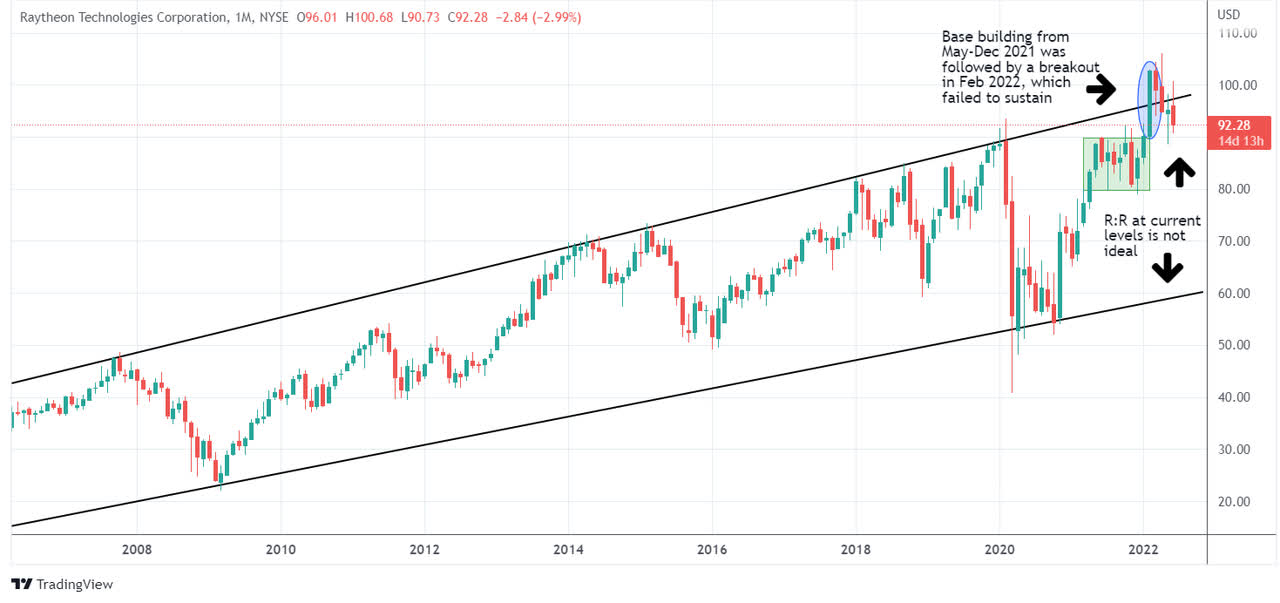
If we consider Raytheon stock’s price imprints on the long-term chart, we can see that it has trended up in the shape of an ascending channel, paying particular respect to the boundaries of the upper channel. In the second half of last year, the stock spent a lot of time building a base just below its upper boundary, and then the start of the Russian-Ukraine fiasco in Feb 2022, served as an apt trigger for a breakout; unfortunately, the bulls were not able to push the stock higher and what we have now is a false breakout with the entire breakout in Feb being canceled in May (the stock has now fallen back into its old channel)
In light of these developments, I’m not sure it would make great sense to take a long position at this juncture, particularly as the stock is still miles away from the lower boundary of the channel (implying sub-optimal risk-reward).
If we then shift the focus towards RTX stock’s strength relative to the broader aerospace and defense sector- as represented by the iShares U.S. Aerospace & Defense ETF (ITA) – we can see that since the start of 2021, this ratio has been on a relentless uptrend and looks rather overextended at this juncture. Once again, not an ideal risk-reward for those fishing for interesting opportunities in the aerospace & defense universe.
Finally, I’d point to the stock’s forward valuations which are no longer cheap; during the Q1 earnings call, RTX management suggested that they would look to deliver FY-adjusted EPS within the range of $4.60-4.8. It’s worth noting that consensus estimates are currently already closer to the upper end of that range at $4.77, so unless there’s a dramatic improvement in H2 (perhaps commercial aerospace volumes prove to be better than expected, and/or RTX is able to better address ongoing gaps for its titanium sourcing, and/or if the RMD division is able to bring through greater operational productivity in H2) I don’t believe one will see any further expansion beyond the $4.8 EPS limit. All in all, at EPS levels of $4.77, you’re looking at a rather elevated forward P/E of 19.3x which would put in roughly in line with the 5-year average of 19.7x.
YCharts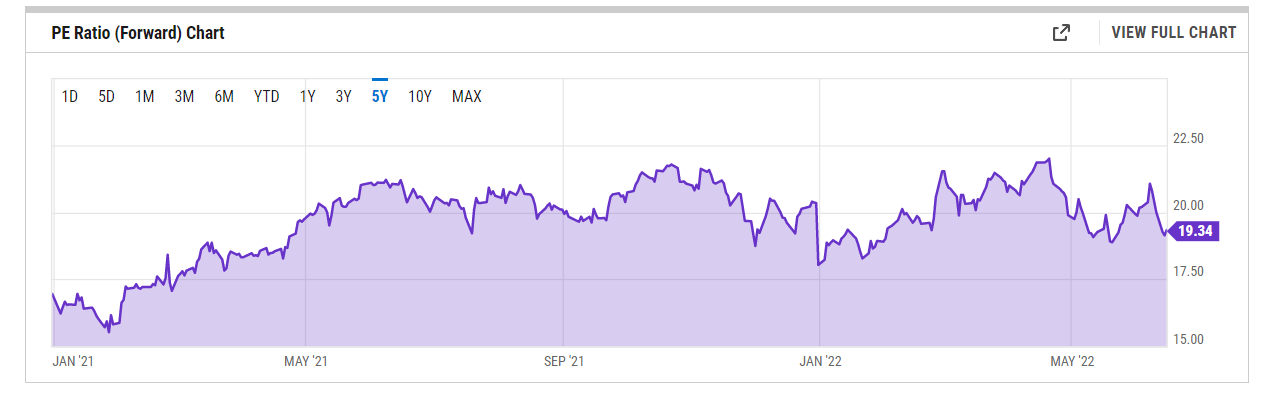
Considering all that I’ve highlighted in this section, a HOLD rating feels appropriate at the current price point.
Be the first to comment