


Gonzalo Marroquin/Getty Images Entertainment
Key Metrics
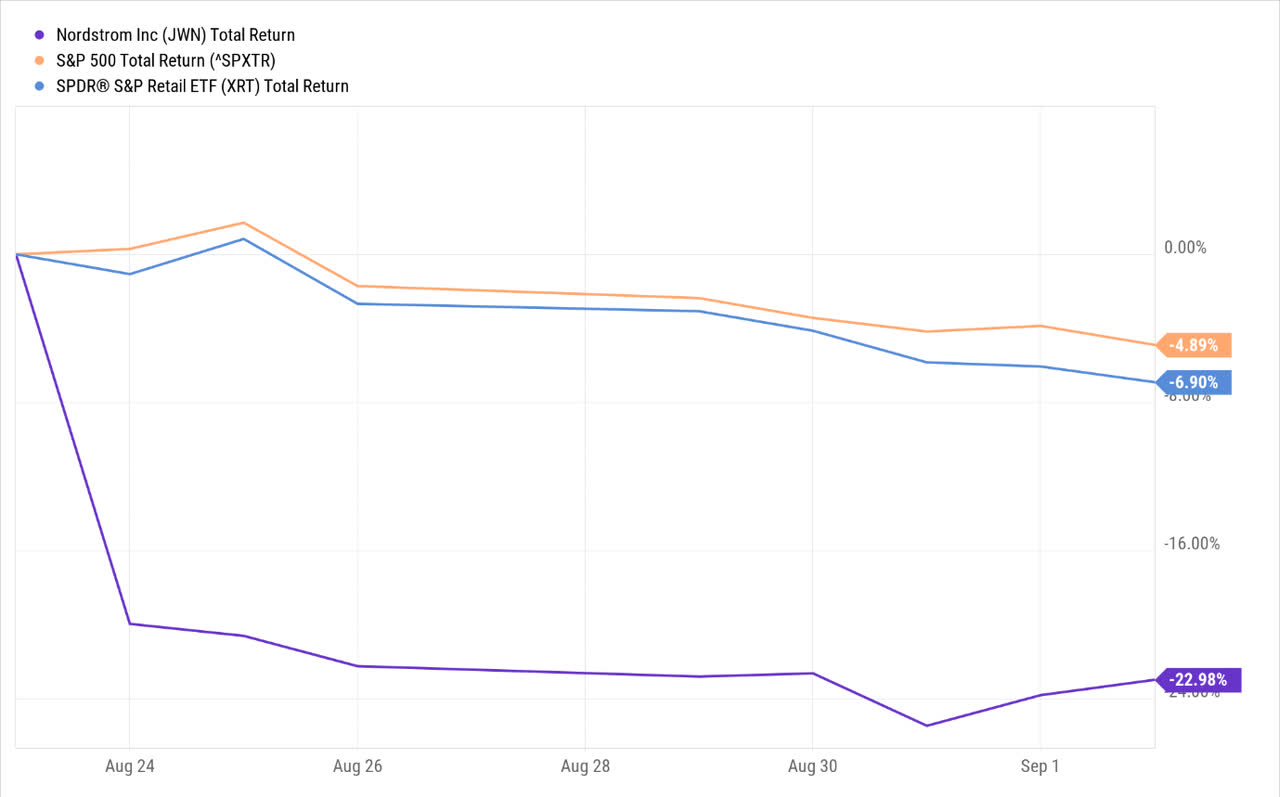
The stock of fashion retailer – Nordstrom Inc (NYSE:JWN) – has gone through a rough ride over the past few weeks; since the announcement of its Q2 results on the 23rd of August, the JWN stock has lost 23% of its value and has also ended up falling well short of the broader markets (by 4.6x) but its peers from the retail sector as well (by 3.3x).
YCharts
Weakening consumer demand trends which began in late June and July (particularly in the low-income segment and their off-price setup – Nordstrom Rack) and a potential re-adjustment of inventory in the second half of the year has prompted the company to slash its FY guidance.
For further clarity, note that the annual revenue growth which was expected to come in at 6-8% will likely drop to 5-7%. Besides, potentially significant clearance activities with regard to the low-ticket items of Nordstrom Rack could wipe out $200m of gross profits in the second half. This will weigh on the adjusted EBIT margin range which has been curtailed by 130bps from the previously expected levels of 5.6%-6%. Unsurprisingly, the weak flow through will also impact the bottom line, where expectations of the FY adjusted EPS have been scaled down by ~27%, to a range of $2.30-$2.60.
Is Nordstrom’s Dividend Safe?
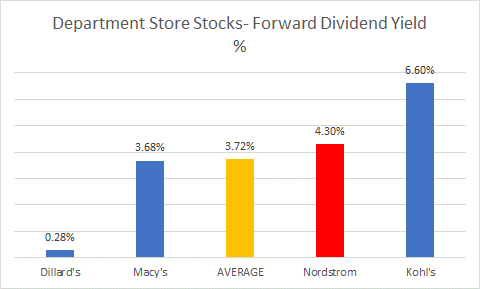
Whilst investors should be primarily concerned with the underlying health of Nordstrom’s core operations, one should also consider the inevitable corollary of how this impacts the company’s distribution plans; more so, as Nordstrom’s current forward dividend yield is better than the industry average, and is also one of the better offerings around in the department store space.
Seeking Alpha
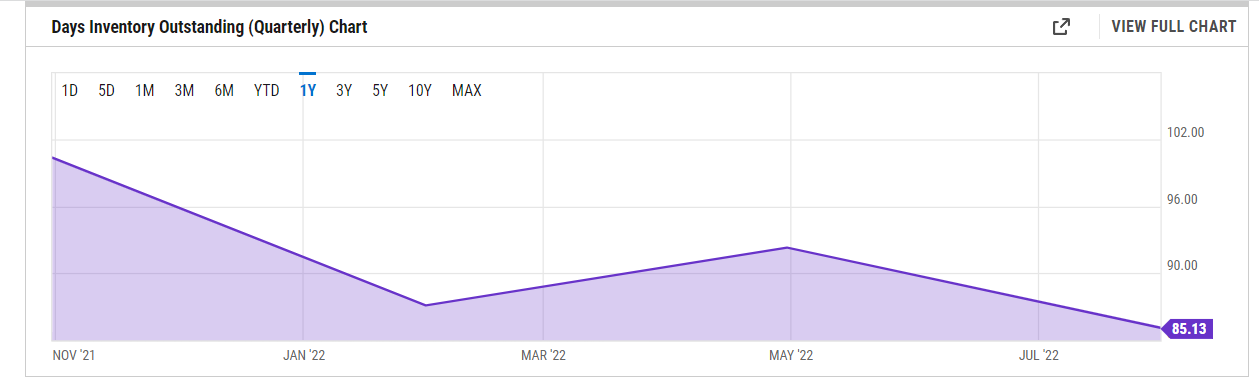
Firstly, weaker gross profit dynamics will reflect badly on the operating cash flow. Then, quite unlike most of the other peers in the retail sector, Nordstrom does not necessarily have an overdose of merchandise inventory. Whilst other retailers could benefit from some cash inflows in the coming quarters (as inventory balances decline from heightened levels), with Nordstrom, I don’t believe this will be a massive game changer. In fact, the days in inventory outstanding at 85 days is already at its lowest point in four quarters.
YCharts
And even though Nordstrom management plans to curtail inventory in some categories within Nordstrom Rack, they do also plan to build the supply of premium brands. So, the takeaway here is that inventory readjustments for Nordstrom are unlikely to serve as a major source of cash inflow which could be another source of concern for the distribution coverage.
Then, you also have to consider the company’s leverage position (defined by the management as Adjusted debt to EBITDAR). JWN wants to finish the current fiscal year at 2.9x leverage with an eventual goal of getting it closer to 2.5x. This means a sizeable chunk of excess cash could be directed towards reducing the level of financial indebtedness.
Nordstrom also has something of a patchy record when it comes to the consistency of its dividends. Note that its quarterly dividends were curtailed during the pandemic, and after a gap of seven quarters, it was only brought back in Q1 this year.
I’d also like to highlight that the company recently commenced a $500m buyback program (without any expiry date), and spent only around $35m of cash in Q2 to buy back stock. Given that they’ve just commenced this ($465m of pending buyback spend), I wouldn’t expect this to be curtailed, more so as the price has fallen by another ~22% from the average buyback price of $23.17 in Q2. If anything, one should perhaps expect an increase in buybacks, putting further pressure on the free cash position and what’s left for dividends.
Given what I’ve written so far in this section, investors could be forgiven for thinking that the dividend is at risk but I’d like to allay those fears.
Firstly, consider that even though Nordstrom got back to paying dividends this year, it has only been doling out $0.19 per share; this is almost 50% lower than what they were giving out pre-pandemic. To put it in annual cash terms you’re currently looking at a cash spend of only $120m on dividends, whereas in the preceding eight years before the pandemic, the average annual dividend spend ranged from $220m-$280m!
JWN won’t be under any pressure to increase this, as the yield of 4.3% is better than the 5-year average of 3.85%.
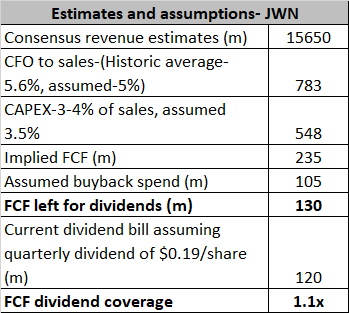
I also highlight below how Nordstrom’s prospective free cash flows could cover the dividends.
YCharts, JWN Q2 Presentation, Author’s calculations
According to YCharts consensus estimates, next year’s revenue will likely be closer to the $15650m mark. Over the last five years, Nordstrom has been able to convert 5.6% of its sales into operating cash flow. If we assume a slightly lower conversion figure of 5% going forward, this would equate to around $780m of operating cash flow.
Nordstrom also plans to spend anything between 3-4% of its sales on CAPEX initiatives encompassing its technology and supply chain. This would imply potential CAPEX spend of less than $550m resulting in free cash flow of $235m.
Given that Nordstrom spent $35m on buybacks in H1, one could expect a similar cadence in H2, potentially even a lot more, considering the drop in the share price. Assuming they double that buyback spend in H2, you’re looking at $105m for the whole year ($35m in H1 plus $70m in H2). This leaves you with around $130m to pay out as dividends, which pretty much covers the $0.19 a share dividend bill ($120m annually).
Closing Thoughts – Is JWN Stock A Buy, Sell, or Hold?
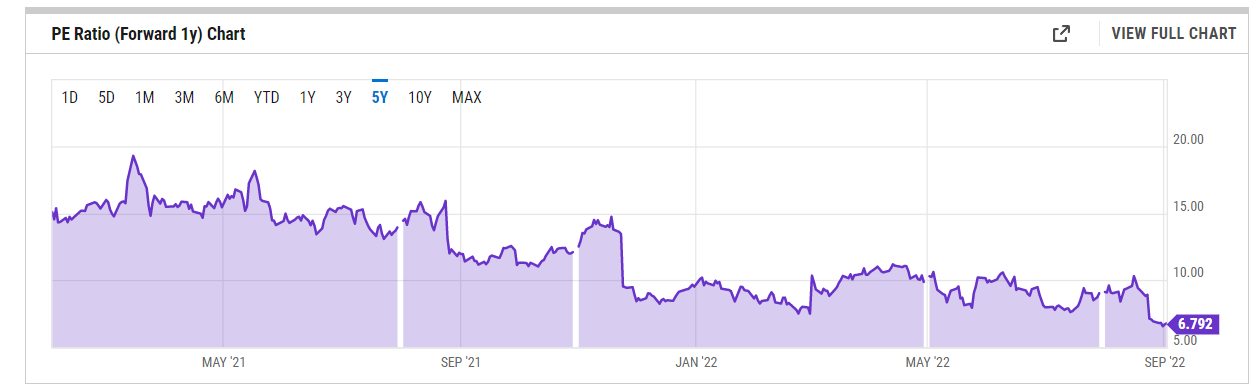
The drastic collapse in the share price has no doubt made Nordstrom’s stock an attractive proposition from a valuation perspective; on a forward P/E basis, you can pick it up at a multiple of only 6.8x, which represents a 43% discount to its 5-year average multiple.
YCharts
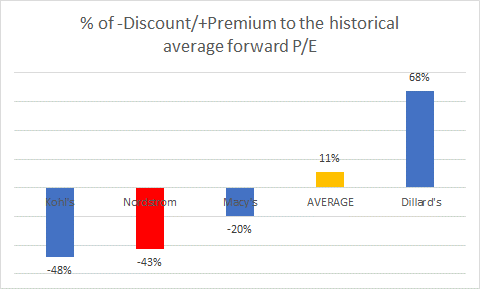
Besides, amongst all the department store stocks, only Kohl’s (KSS) is available at a larger P/E discount than JWN (something like Dillard’s (DDS) trades at a huge premium to its historical average).
YCharts
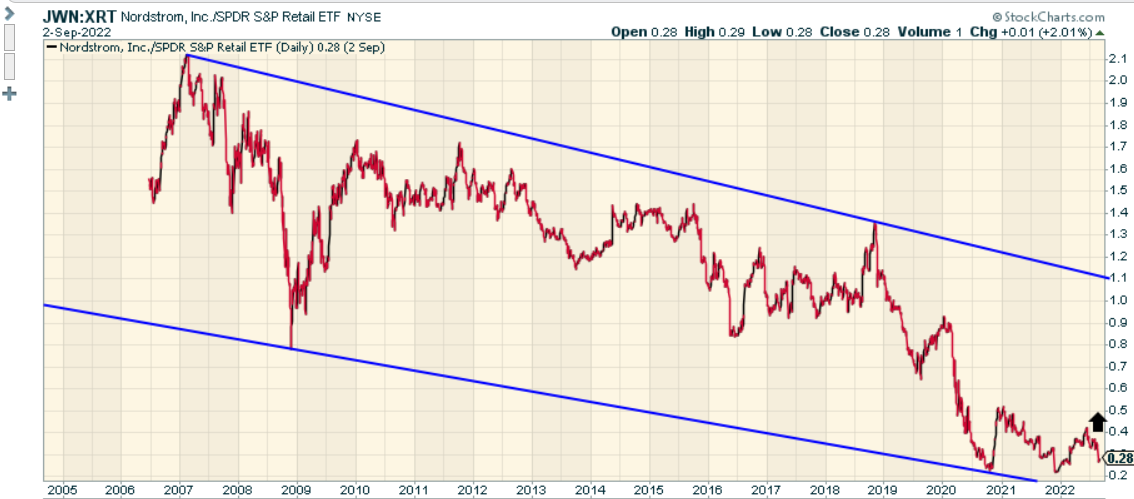
Nordstrom’s cheap valuations are also supplemented by its low relative strength ratio (versus other retail stocks as represented by the XRT ETF), making it a ripe candidate for rotational opportunities in this space.
StockCharts
Whilst Nordstrom may have to brave through some difficult conditions in H2, its dividend does not appear to be at risk, and its valuations are dirt cheap. The stock is a BUY.
Be the first to comment