

Jean-Luc Ichard
Introduction
In many ventures, Microsoft Corporation (NASDAQ:MSFT) represents a diverse software company, including development tools, gaming, and enterprise-level software. It’s still one of the largest software companies in the world, with solid fundamentals and technical indicators to show continued growth in this $1 trillion-plus market cap company.
Fundamentals are strong past and future
Ratios
The current ratio and quick ratio have weakened during the pandemic. The cash ratio has declined, so should this be an overall concern? Looking further at this table, you can see that these ratios fall from a slowing global economy.
From an accounting perspective, days of inventory and payables are going in the wrong direction. Thankfully, net profit has been growing over the last five years, which should override these past concerns.
|
2018 |
2019 |
2020 |
2021 |
2022 |
|
|
Period |
FY |
FY |
FY |
FY |
FY |
|
Current ratio |
2.901 |
2.529 |
2.516 |
2.080 |
1.785 |
|
Quick ratio |
2.740 |
2.353 |
2.331 |
1.899 |
1.567 |
|
Cash ratio |
0.204 |
0.164 |
0.188 |
0.160 |
0.147 |
|
Days of sales outstanding |
87.582 |
85.633 |
81.698 |
82.610 |
81.481 |
|
Days of inventory outstanding |
25.334 |
17.548 |
15.011 |
18.421 |
21.801 |
|
Operating cycle |
112.916 |
103.181 |
96.709 |
101.030 |
103.282 |
|
Days of payables outstanding |
82.007 |
79.805 |
99.255 |
105.960 |
110.694 |
|
Net profit margin |
0.150 |
0.312 |
0.310 |
0.365 |
0.367 |
Source: Financial Modelling Prep
Growth
Over the last five years, Microsoft has gone through a swing back to profitability since 2020 in terms of revenue, but shows weakness this year as global economic conditions worsen.
Both free cash flow growth and operating cash flow growth are the weakest for this year.
|
2018 |
2019 |
2020 |
2021 |
2022 |
|
|
Period |
FY |
FY |
FY |
FY |
FY |
|
Revenue growth |
0.227 |
0.140 |
0.136 |
0.175 |
0.180 |
|
Gross profit growth |
0.293 |
0.152 |
0.169 |
0.195 |
0.171 |
|
Ebit growth |
0.570 |
0.225 |
0.233 |
0.320 |
0.193 |
|
Operating income growth |
0.570 |
0.225 |
0.233 |
0.320 |
0.193 |
|
Net income growth |
-0.218 |
1.368 |
0.128 |
0.384 |
0.187 |
|
Operating cash flow growth |
0.111 |
0.189 |
0.163 |
0.265 |
0.160 |
|
Free cash flow growth |
0.028 |
0.186 |
0.182 |
0.241 |
0.161 |
Source: Financial Modelling Prep
Data
In terms of stock price growth, Microsoft has shown some strength over the last 20 working days with a more robust simple moving average despite negative values for 50 or 200 days.
|
Values |
|
|
SMA20 |
4.34% |
|
SMA50 |
-2.41% |
|
SMA200 |
-10.01% |
Source: FinViz
Enterprise
There are some impressive metrics at the enterprise level since 2018, growth and stock price, as well as increased market capitalization by 300%. It is also remarkable to see the enterprise value add $500 million to its importance in the last three years.
|
2018 |
2019 |
2020 |
2021 |
2022 |
|
|
Symbol |
MSFT |
MSFT |
MSFT |
MSFT |
MSFT |
|
Stock price |
105.370 |
140.350 |
203.900 |
284.910 |
280.740 |
|
Number of shares |
7.700 B |
7.673 B |
7.610 B |
7.547 B |
7.496 B |
|
Market capitalization |
811.349 B |
1.077 T |
1.552 T |
2.150 T |
2.104 T |
|
Add total debt |
81.808 B |
78.366 B |
70.998 B |
67.775 B |
61.270 B |
|
Enterprise value |
881.211 B |
1.144 T |
1.609 T |
2.204 T |
2.152 T |
Source: Financial Modelling Prep
Estimate
Despite vital past metrics from Microsoft, their estimated guidance looks even more robust. Revenue should continue to grow beyond 2025, and dividend growth could continue to skyrocket at a conservative level. Also, EBITDA will strengthen over the next six years, showing Microsoft has confidence in its stock price, fundamentals, and dividends. Total assets will support it, but Microsoft’s core strength comes from its growing research and development.
|
YEARLY ESTIMATES |
2022 |
2023 |
2024 |
2025 |
2026 |
2027 |
|
Revenue |
– |
218,168 |
247,669 |
284,769 |
325,867 |
352,709 |
|
Dividend |
2.45 |
2.61 |
2.84 |
3.19 |
3.50 |
3.99 |
|
Dividend Yield (in %) |
1.01 % |
1.08 % |
1.17 % |
1.32 % |
1.45 % |
1.65 % |
|
EPS |
– |
10.02 |
11.79 |
14.00 |
16.17 |
17.24 |
|
P/E Ratio |
29.84 |
24.13 |
20.50 |
17.27 |
14.96 |
14.03 |
|
EBIT |
– |
91,866 |
105,745 |
124,460 |
137,608 |
148,647 |
|
EBITDA |
99,391 |
107,882 |
125,157 |
146,212 |
164,301 |
178,550 |
|
Net Profit |
– |
74,565 |
87,099 |
102,203 |
117,495 |
124,043 |
|
Net Profit Adjusted |
– |
74,868 |
87,855 |
102,350 |
117,495 |
124,043 |
|
Pre-Tax Profit |
– |
91,703 |
107,019 |
124,793 |
138,889 |
151,371 |
|
Net Profit (Adjusted) |
84,378 |
89,639 |
106,010 |
123,257 |
– |
– |
|
EPS (Non-GAAP) ex. SOE |
– |
10.02 |
11.79 |
14.00 |
16.17 |
17.24 |
|
EPS (GAAP) |
– |
9.91 |
11.59 |
13.97 |
15.74 |
16.46 |
|
Gross Income |
– |
149,799 |
169,802 |
195,161 |
212,991 |
235,842 |
|
Free Cash Flow |
66,230 |
70,472 |
83,980 |
100,604 |
108,176 |
117,795 |
|
Research & Development Exp. |
– |
26,766 |
29,527 |
33,825 |
36,833 |
40,580 |
|
Shareholder’s Equity |
169,352 |
202,671 |
253,388 |
325,572 |
370,619 |
495,547 |
|
Total Assets |
369,343 |
408,014 |
467,514 |
534,723 |
668,244 |
783,386 |
Source: BusinessInsider
Risk minimal due to strong future momentum
Sustainability
One concern for Microsoft is how its sustainability has a rating of underperformance. Yet, despite the ESG movement, large asset managers like BlackRock or Vanguard continue to invest in this impressive software behemoth.
|
Value |
|
|
Social score |
8.39 |
|
Peer count |
105 |
|
Governance score |
5.33 |
|
Total esg |
15.24 |
|
Highest controversy |
3 |
|
ESG performance |
UNDER_PERF |
|
Percentile |
10.73 |
|
Peer group |
Software & Services |
|
Environment score |
1.53 |
Source: Yahoo Finance
Price Target
Another concern is how confident stock market analysts set excessive stock price targets but readjust after the stock price drifts over the last four months. These market analysts expect explosive moves out of Microsoft but are only disappointed to see a moderate level of variance in the stock price. As a result, I would imagine Microsoft’s stock price should increase slowly to be a potential outperformer compared to the general American major stock indices.
price target microsoft (custom platform)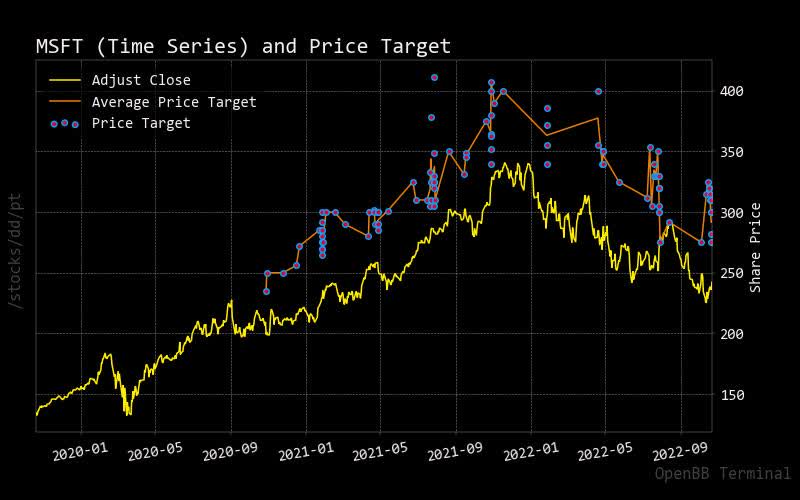
Recommendation
Microsoft has firm and overwhelming recommendations to strong buy as a market reversal appears to take the stock up and away.
|
Interval |
RECOMMENDATION |
BUY |
SELL |
NEUTRAL |
|
One month |
STRONG_BUY |
17 |
0 |
9 |
|
One week |
STRONG_BUY |
17 |
1 |
8 |
|
One day |
BUY |
14 |
2 |
10 |
Source: Trading View
Short trading volume vs. total volume
Microsoft’s shorting volume is slightly less than 50% of the total trading volume. There are encouraging signs as retail and institutional investors long buy this stock than short. However, as it drops, it only confirms the theory of a reversing trend for Microsoft’s stock price.
short volume vs total microsoft (custom platform)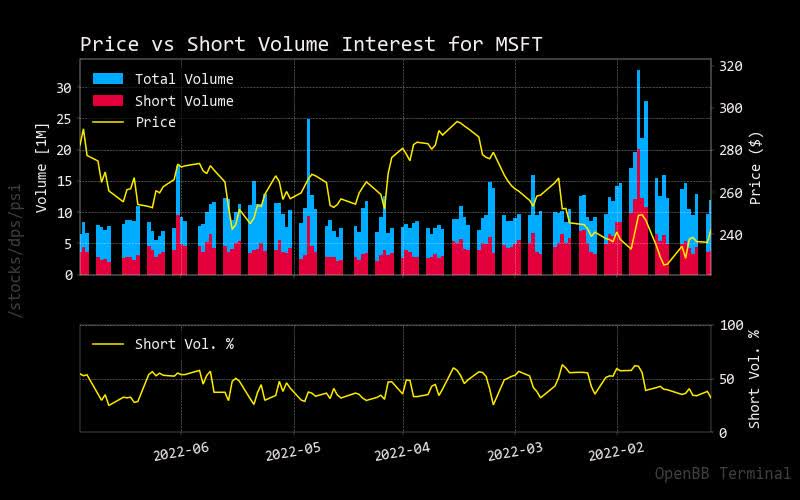
Insider Activity
Over the last few weeks, there has been a recent buyback of Microsoft stock which further confirms there could be an expected uptrend. This includes recent purchases by CEO Satya Nadella.
|
Date |
Shares Traded |
Shares Held |
Price |
Type |
Option |
Insider |
Trade |
|
2022-09-18 |
33,465.00 |
479,324.00 |
nan |
Buy |
No |
Young Christopher David |
33465.0 |
|
2022-09-18 |
29,641.00 |
641,946.46 |
nan |
Buy |
No |
Hogan Kathleen T |
29641.0 |
|
2022-09-18 |
14,342.00 |
111,200.00 |
nan |
Buy |
No |
Capossela Christopher C |
14342.0 |
|
2022-09-18 |
11,302.00 |
121,138.73 |
nan |
Buy |
No |
SMITH BRADFORD L |
11302.0 |
|
2022-09-18 |
11,302.00 |
121,138.73 |
nan |
Buy |
No |
Althoff Judson |
11302.0 |
|
2022-09-18 |
12,621.00 |
219,066.60 |
nan |
Buy |
No |
Hood Amy |
12621.0 |
|
2022-09-18 |
27,996.00 |
174,191.14 |
nan |
Buy |
No |
Nadella Satya |
27996.0 |
|
2022-10-16 |
177.47 |
67,294.68 |
228.56 |
Sell |
No |
Jolla Alice L. |
-177.47 |
Source: BusinessInsider
Technical Analysis confirm Perfect Entry Potential
Fibonacci Trendline
If one were to wait on the classic market entry scenario when the stock price crosses above the Fibonacci trendline, they could lose out on significant profit potential. However, as the fundamentals seemed to confirm, Microsoft’s stock price currently could be under a strong uptrend. So why miss out?
fibonacci microsoft (custom platform)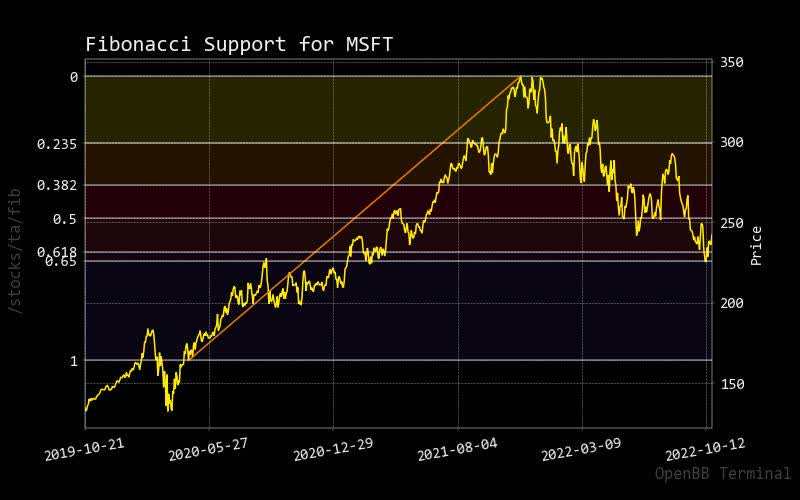
Bollinger Bonds
Microsoft’s stock price is currently halfway between the upper and lower bands, representing a classic market entry based on solid fundamentals.
bollinger band microsoft (custom platform)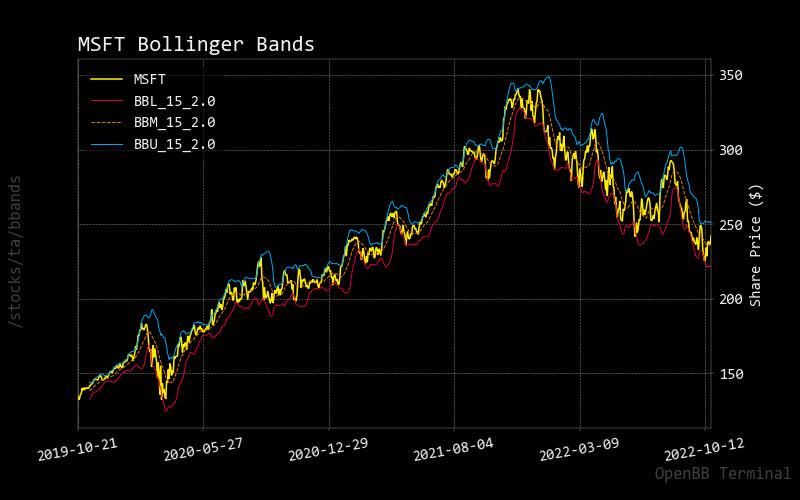
MACD
Microsoft stock price is undervalued as it is below the MACD 0 blue line. Therefore, this represents a near-perfect opportunity to buy into this stock if you were to rely on the strong fundamentals described in this report.
macd microsoft (custom platform)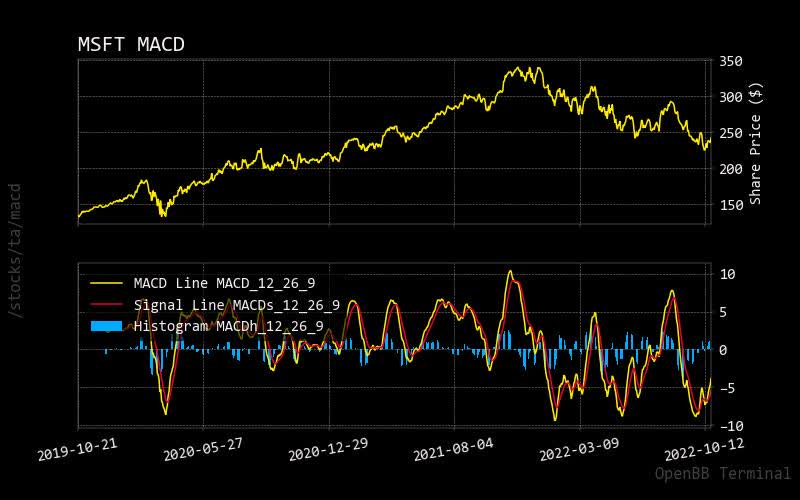
RSI
Even better, the relative strength indicator is halfway between undersold and oversold market conditions for the Microsoft stock price currently. So again, it represents a decent opportunity to dive into a robust big technology company.
rsi microsoft (custom platform)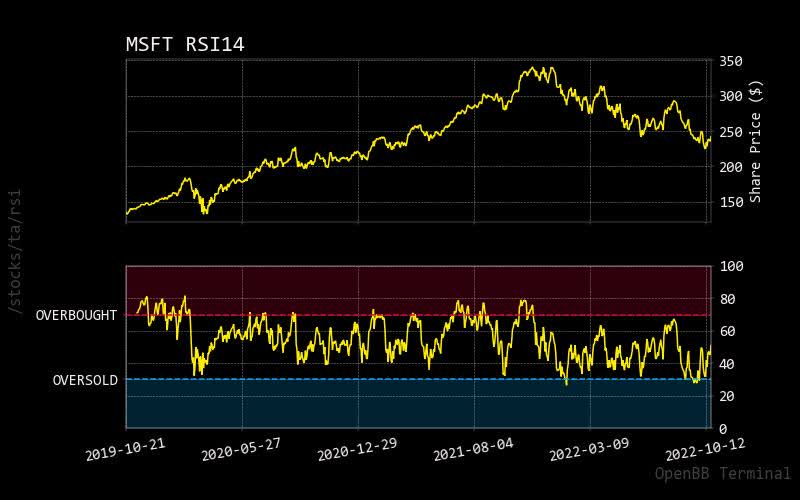
Prediction via AI
Monte Carlo
Most Monte Carlo prediction paths show a higher probability of an uptrend on the current Microsoft stock price. Also, the normalized distribution chart shows much higher predictability of an uptrend starting with the current Microsoft stock price.
monte carlo microsoft (custom platform )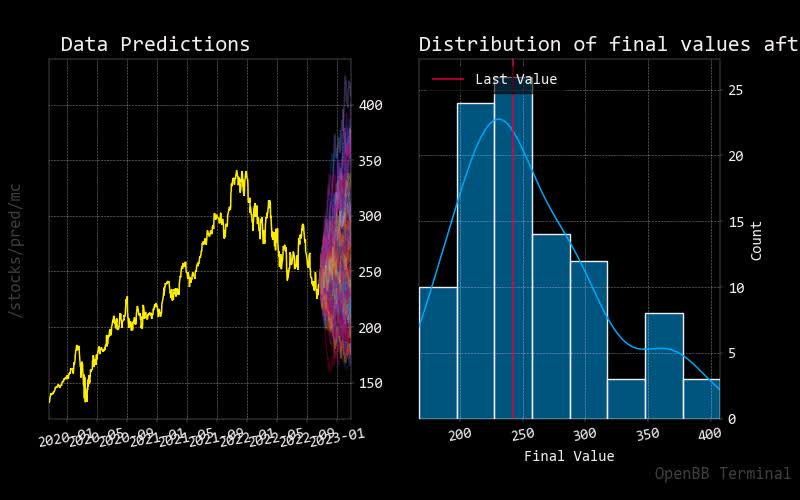
Regression
30-day projected move with the red regression line shows slow growth but may strengthen as the American stock market may intensify in the near term.
regression microsoft (custom platform)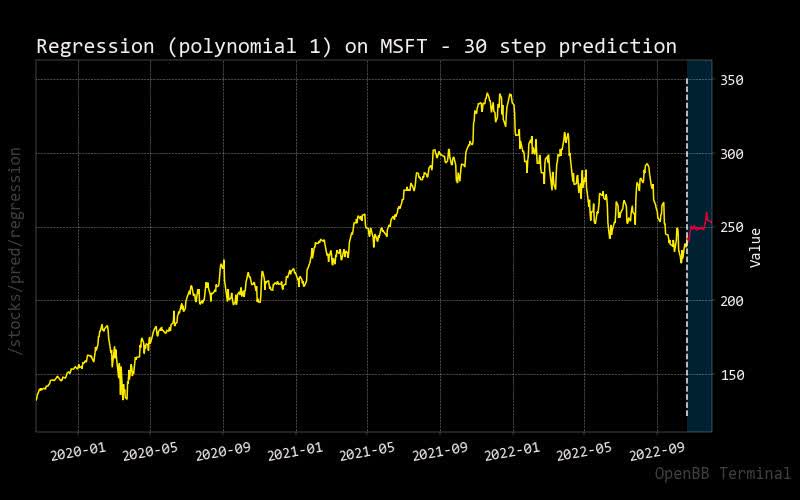
Conclusion
Does Microsoft’s stock price currently represent a near-perfect time to take positions? Based on fundamental analysis, near-perfect technical analysis conditions, and minimal risk, one can consider this a strong buy recommendation. If one can override noted Microsoft stock price concerns, any investor should be able to sleep at night knowing there is a set of indicators that show a strong uptrend forming in this stock.
Be the first to comment