

Scott Olson/Getty Images News
Exxon Mobil Corporation (NYSE:XOM) is a very popular stock on Seeking Alpha, with more than 400,000 followers. Over the last three decades, XOM has been vilified for not doing enough to fight emissions of CO2 not only from its products but from its facilities that make the products. Members of the ESG (Environmental, Social and Governance) community have continually criticized Exxon for not doing enough in this regard.
The end result has been a positive return for Exxon investors, but nowhere near the results of the S&P 500 (SPY).
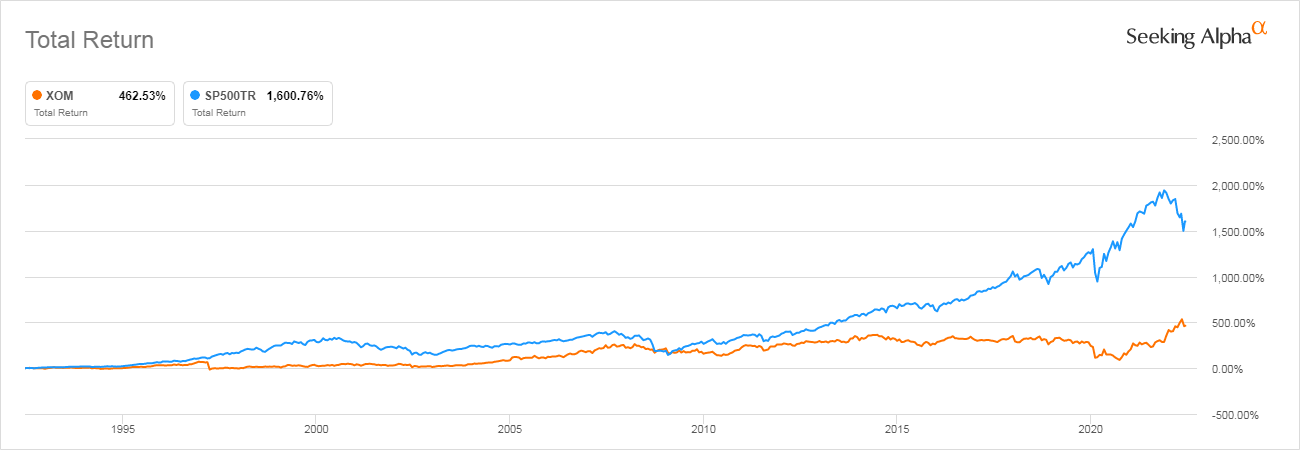
Seeking Alpha
Since 1992, SPY has outperformed XOM by 3 times, 1500% to 500%.
Here we are in 2022 and now XOM is under attack from the Biden administration for not producing enough of the products that were previously critiqued, namely gasoline and diesel fuels. However, over the last year results have switched with Exxon easily outperforming SPY as restrictions forced on oil companies have come home to roost with fewer products available to meet increased worldwide demand.
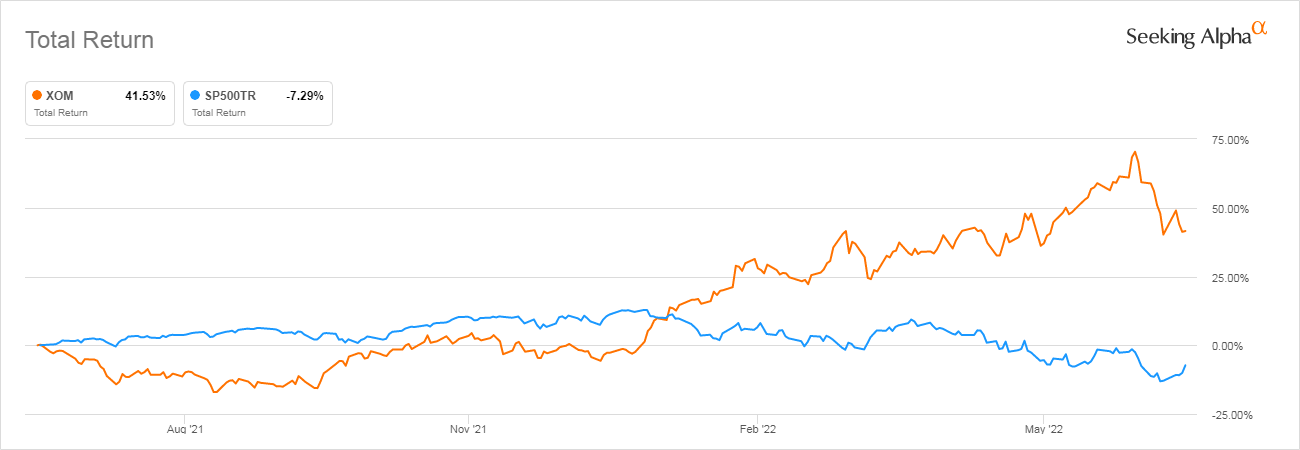
Seeking Alpha
In the last year, XOM has outperformed SPY 41% to minus 7% forcing everyone to rethink policies that demand end-products while limiting production.
In this article, I will look at how Exxon might perform going forward in a world where oil demand will likely exceed oil production.
XOM Stock Key Metrics
I would argue the definitive point of the recent past was COVID-19 and its economic effect on the world beginning with the first quarter of 2020.
Therefore, in this Financial metric comparison, I am going to compare Exxon’s fiscal year 2019 ending 12/31/2019 with Exxon’s current TTM (Trailing Twelve Month) results ending with Q1 2022.
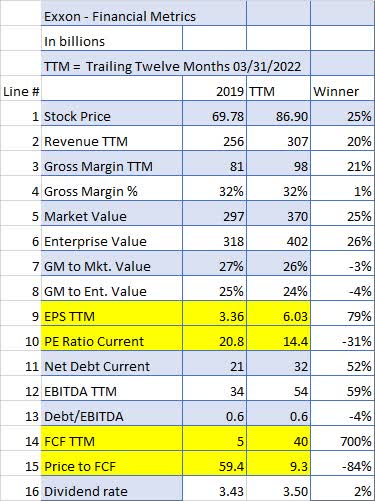
Seeking Alpha and author
This is only significant because the increased revenue has generated slightly more dollars for GM in spite of ever-increasing costs in production including steel for infrastructure, gasoline and diesel for transportation of products in addition to increased labor and fracking costs. And while Net Debt (line 11) has jumped 52%, EBITDA had improved by 59% thereby keeping the Debt/EBITDA Ratio (line 13) level.
But it is the yellow lines above that show big improvement, with EPS (Line 9) showing a huge 79% increase while the PE Ratio (Line 10) dropped by almost 1/3.
FCF (Line 14) was even more impressive, going up by a massive 700% resulting in the Price to FCF (line 15) number dropping by more than 80%.
Both of those ratios have improved by more than the price increase of 25% (Line 1) suggesting more upside is possible even without future oil price increases.
What Is Exxon Mobil Stock’s Target Price?
In 2019 oil prices were down from 2018 and averaged about $60 per barrel.
The price of Brent crude oil, the international benchmark, averaged $64 per barrel (B) in 2019, $7/b lower than its 2018 average. The price of West Texas Intermediate (WTI) crude oil, the U.S. benchmark, averaged $57/b in 2019, $7/b lower than in 2018. Source: EIA
Compare that with the current oil price (06/24/22) of about $107 up about 75% since 2019 compared to Exxon’s price increase of 25% since 2019. That would imply there is considerable upside for Exxon’s price if oil prices remain anywhere near $107.
But if we compare oil prices to XOM prices starting during the lows of the COVID-19 in March 2020 we can see the relationship is pretty tight.
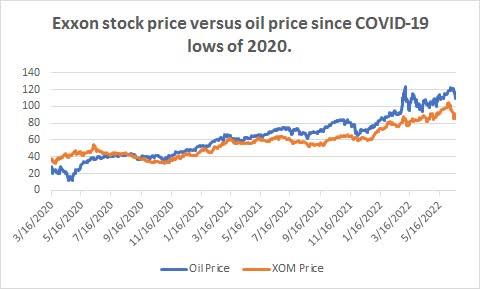
NASDAQ, macrotrends, author
In fact, if you calculate a correlation on those 2 data sets over that time period (more than 500 paired data points) the correlation is .95 a very, very high correlation where 1 is a perfect correlation.
Now we also know correlation is not causation, but that is still a very interesting number.
We can also see the XOM’s price as a percentage of the oil price.
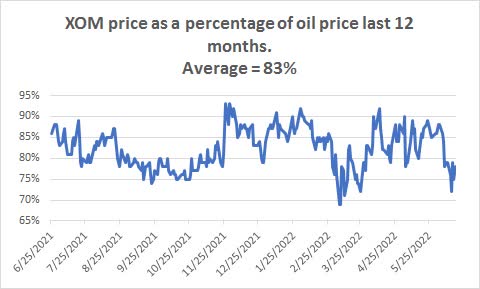
NASDAQ, macrotrends, author
If you look at the percentage for only days when the price of oil was over $100 the average is 81% not much different from the overall percentage.
So it is no surprise that the target price of Exxon depends strongly on your estimation of the price of oil going forward.
Using a conservative 80% XOM/oil price ratio, here are the expected prices of oil:
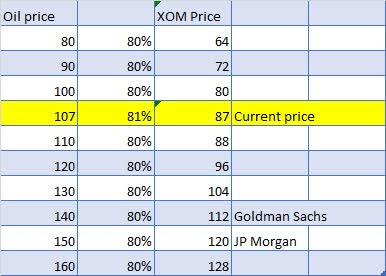
NASDAQ, macrotrends, author
Note the current XOM price is right at 81% of the current oil price.
Is XOM Stock A Buy, Sell, Or Hold?
I personally do not see how oil volumes can grow fast enough to meet the world’s needs within the next year without a fairly serious worldwide recession, slowing down demand considerably.
One other issue driving prices is refinery capacity.
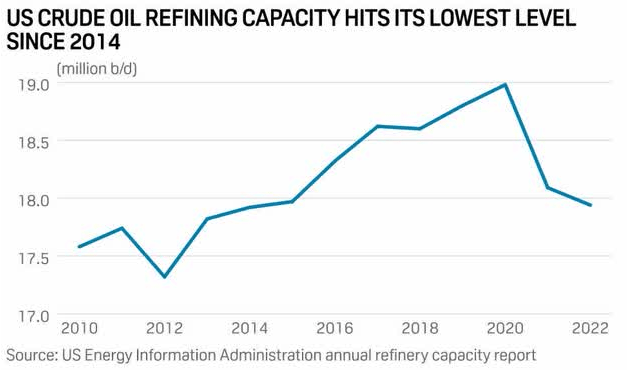
EIA
Is it possible to build a new refinery in the US? I doubt it, so refinery margins will probably continue to be one of the largest profit generators for oil companies, especially big ones like Exxon.
Here is the current look at crack spreads, which is the amount of gross profit refineries make after paying for the oil and turning it into salable products such as gasoline and diesel.
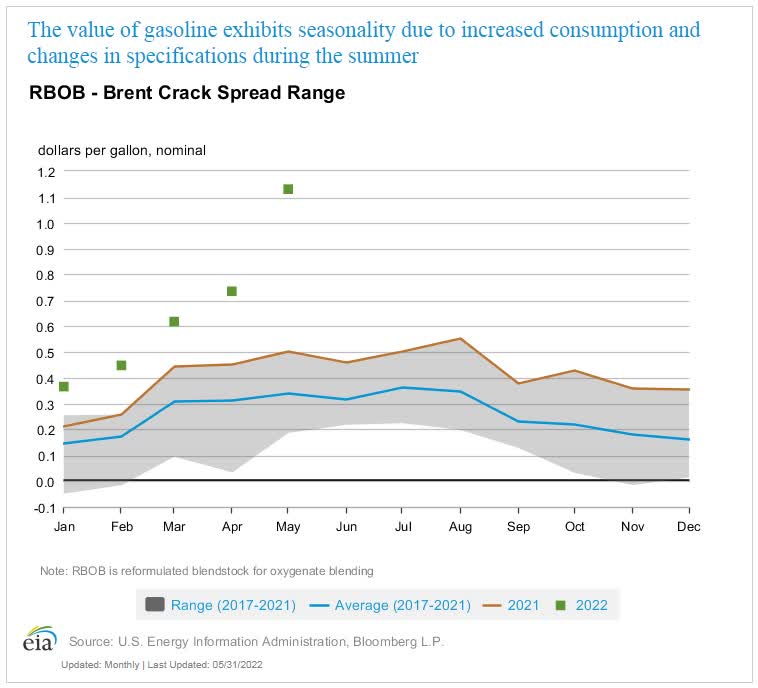
EIA
Note that 2022 crack spreads are far above the average and going higher every month. This means more profit for Exxon.
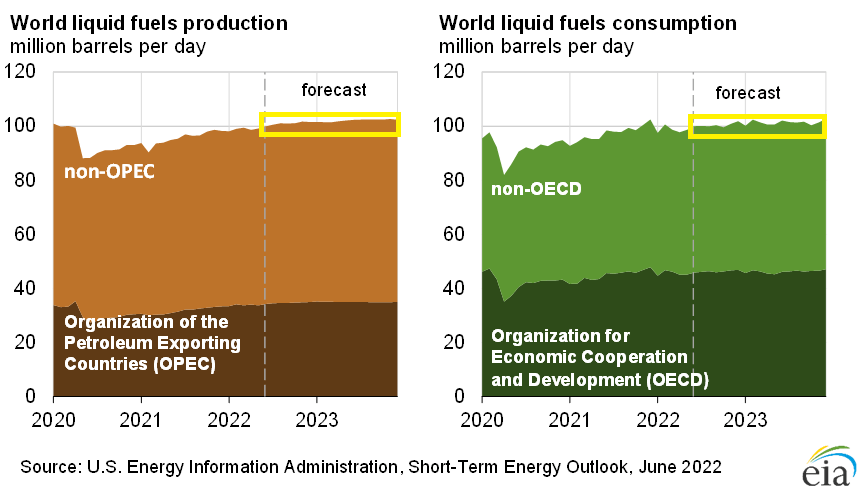
Then, one other concern for oil prices is the narrow margin for error put out by the EIA on Demand vs. Supply through 2024. It shows no margin for error on either the demand or supply side of the equation, something I would call a Goldilocks scenario.
EIA
Based upon all of the above and keeping the recession caveat in mind, Exxon remains a strong buy.
Be the first to comment