


gesrey/iStock via Getty Images
Company Snapshot
The Canadian Imperial Bank of Commerce (NYSE:CM) (CM:CA), is a North-American-based financial bank, that offers a plethora of diversified banking products and services. These offerings are rendered via four separate units: –
- Canadian Personal and Business Banking (For retail clients based in Canada)
- Canadian Commercial Banking and Wealth Management (For middle-market companies, governments, and high-net-worth clients in Canada)
- U.S. Commercial Banking and Wealth Management (For middle-market companies, governments, and high-net-worth clients in the U.S.)
- Capital Markets (Investment Banking, research, corporate banking solutions, advisory, etc.)
Incidentally, CM is also considered to be Canada’s fifth-largest bank.
Recent Event- Canadian Imperial Bank’s Recent Stock Split
Last month, CM effected a 2-1 stock split, where the bank’s shareholders as of May 6th (EOD) had received one additional share on the payment date (May 13th). For the uninitiated, the value of the company remains the same and a shareholder’s proportionate ownership in the stock does not change either; it’s just that the number of shares outstanding currently stands at well over 900m (903.13 as things stand), as against the previous level of roughly ~4.5m shares.
For those who track developments in the Canadian banking space, CM’s stock split should not have come as a great surprise as the other top four Canadian banks have a history of engaging in 2-1 stock splits, particularly when the price of their respective shares crosses a certain psychological threshold; according to Seeking Alpha data, the Royal Bank of Canada (RY) and Toronto-Dominion Bank (TD) have resorted to splits twice, the Bank of Montreal (BMO) thrice, and the Bank of Nova Scotia (BNS) once.
Between Jan 31, 2019 and Jan 31, 2022, the NYSE-listed CM shares had increased from a price of $84.79 to $125.52. Once it crossed $100 and stayed above those levels, it was inevitable that you’d see conversations around a potential stock split come up. This is of course largely psychological; the thinking being that the casual or novice retail investor would find the share less attractive at triple-digit levels (post the stock split the share is now trading around $50 levels). Nonetheless, I’m not necessarily sure why CM desperately needed to get a larger cohort of retail investors into its ownership structure, as the shareholding data already suggests a fairly dominant public ownership percentage of around 51.94% (institutional ownership levels are at 48.01%, with a tiny component of the shareholding linked to insiders). All in all, the underlying rationale behind CM’s stock split is to make the share more accessible for retail investors, who- prima facie- are perceived to stick around for the long haul.
Canadian Imperial Bank’s Outlook
As witnessed in many regions across the world, inflation has taken center stage in Canada as well, with the recent number coming in at 6.8% (the highest in three decades), well above the Bank of Canada (BoC)’s comfort level of 2%. To counter this, the central bank has been on a rate-hiking spree, lifting its policy rate by 50bps in two separate instances and taking it to 1.5%; the next policy meeting is due to be held in mid-July and it is widely expected that we will see yet another 50bps hike in the policy rate. All in all, Reuters consensus expects the policy rate to transition to 3% by the end of this year! In the U.S. of course, investors will be well aware of how aggressive the Fed has been in recent months
The increasing rate hike trajectory will have both good and bad connotations for Canadian Imperial Bank; lets’ first start with the good bit; during the Q2 results announced late in May, CM management had stated that a 100bps improvement in rates in the first year could boost their NII (Net interest income) by $428m, and another 100bps improvement in the second year, could have an even more pronounced NII impact of $842m. This could be a very useful foundation for the company’s pre-provision profit progression as hitherto, for the past five quarters, NIM progression has been quite lackluster (on the Q2 call, CM management highlighted competitive pressures in the mortgage market even as funding costs have been going up) hovering close to the 1.6% levels with no great progress. In a more normalized credit environment, you will also see the contribution of a higher mix of high-yielding unsecured loan products which were previously quite subdued.
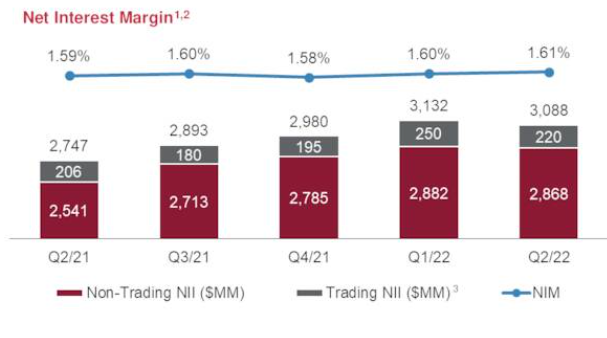
CM- Q2 Earnings Presentation
At the other end of the equation, I do worry about what higher rates could do for the Canadian housing market, and the associated impact this could have on the likes of CM. I say this because Canadians, on average, are already one of the most indebted folks around, as exemplified by the household debt to disposable income ratio which stands at a whopping 180%! Surely the future debt servicing abilities of the Canadian populace will likely dim.
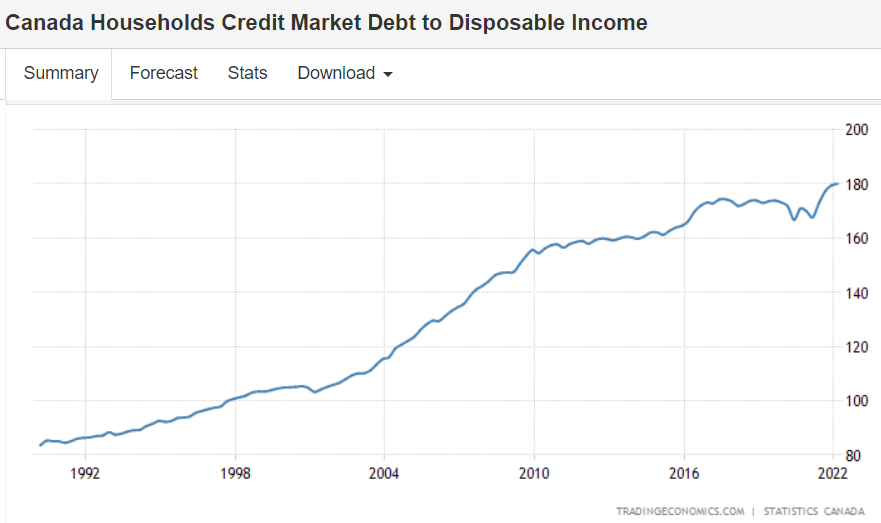
Trading Economics
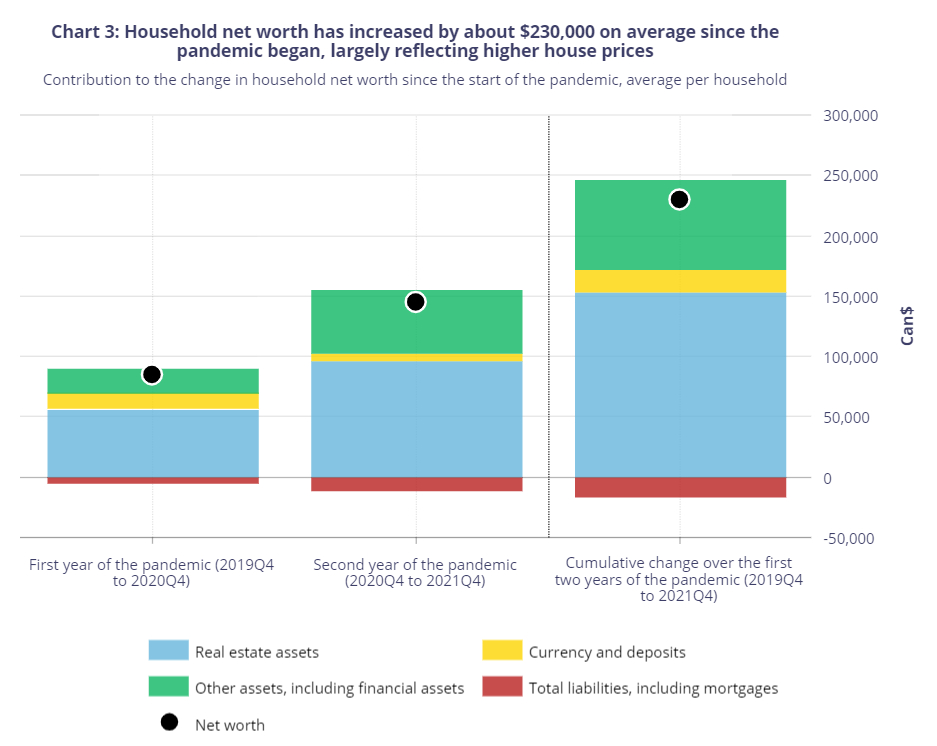
Some would say this does not necessarily have to be an issue, given the significant uplift in the net worth of Canadians in recent years; according to the BoC, from Q4-19 to Q4-21, net worth per household has grown by $230K per average. However, do consider that much of the progression of the net worth is down to the hot housing market in Canada (two-thirds of the growth in net worth can be attributed to the growth in real-estate assets) which could well reverse course with the onset of tighter monetary conditions.
Des Jardins
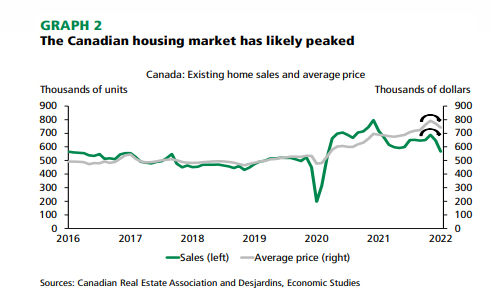
In fact, there’s reason to believe that we may already have witnessed a peak; in March and April, home prices in Canada dropped sequentially by 2.6% and 3.8% respectively, even as existing home sales have fallen by larger margins of 5.9% and 12.6% respectively. Des Jardins believes that housing prices could now decline by 15% from the Feb 2022 peak
BoC Financial System Review 2022
In light of these conditions, CM’s sizeable exposure to this segment ought to make one quite wary; as you can see from the image below, around 56% of the loan book comes from mortgages.
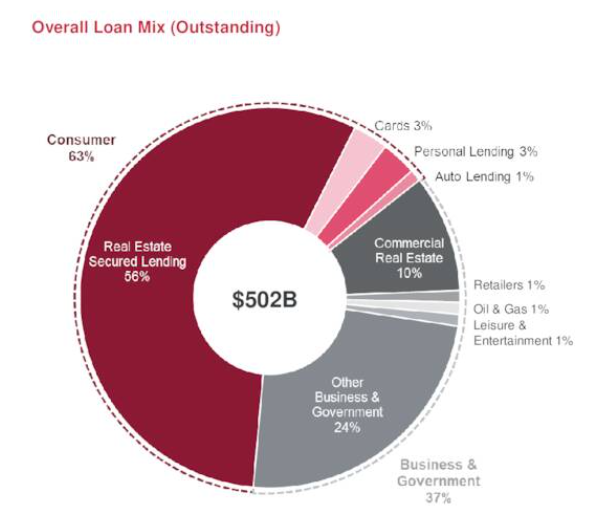
CM- Q2 Earnings Presentation
What I’ll say in favor of CM is that the bank has been doing its bit to ensure sensible risk management practices; for instance, note that since Q2-19, the loan-to-value ratio of uninsured mortgages has declined over time and currently stands at 46%.
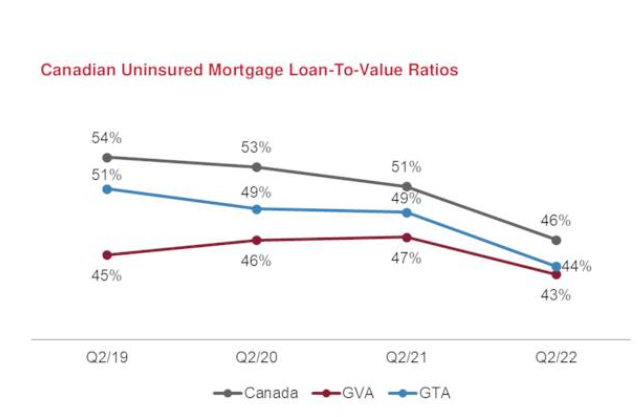
CM- Q2 Earnings Presentation
In the recently concluded Q2, CM was also one of the exceptions in boosting its provisions quite significantly (however a large chunk of this was due to the acquisition of Costco’s credit card portfolio) even as some of its other peers saw earnings improve from provision releases. Regardless, looking ahead, given a pick-up in unsecured lending as well as risks from the housing market, investors should brace themselves for some deterioration in asset quality and a potential spike in credit costs (in the recently concluded Q2, only a partial impact of the Costco acquisition of $94m was felt on the PCL, the full impact of this will be felt in Q3).
On the operating costs front as well, management stated that they were unlikely to see much operating leverage in H2 as they continue to make investments in the U.S. business and cope with inflationary pressures (management stated that cost pressures were higher than what they had initially expected); typically, CM aims for pre-provision profit growth of 5-10% (in Q2 it was 7%), but I doubt the bank will hit the higher end of that range any time soon.
Closing Thoughts- Is CM Stock A Buy, Sell, or Hold?
Value-conscious investors would be enthused to note that CM currently trades at a forward P/BV of 1.28x which represents a 9.2% discount to the stock’s long-term historical average multiple (1.41x). Amongst the top five Canadian banks, only RY is available at a cheaper discount to its historical forward P/BV average of 1.9x(-10.5%)
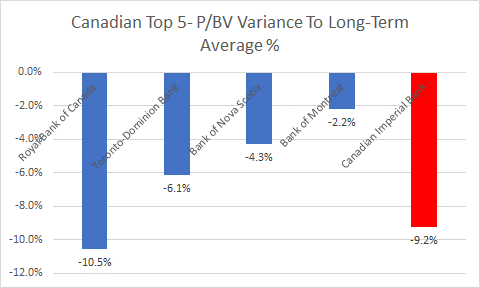
Seeking Alpha
In addition to the cheap valuations, investors also have the benefit of locking in a fairly tasty yield of 5.28% (incidentally the best amongst the top five Canadian banks), which is above the long-term yield average of 4.94%.
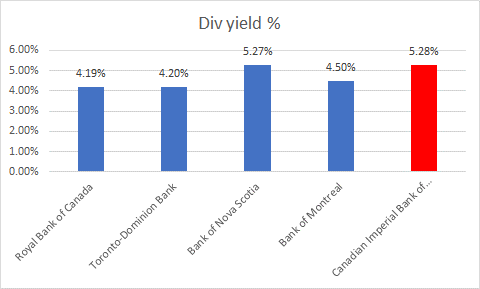
Seeking Alpha
Despite the encouraging valuations and income themes, I would urge investors not to get carried away as there are some other considerations to note.
Different investors use different metrics to gauge the merits of a certain banking stock; a lot of folks tend to gravitate to the ROE (Return on Equity) parameter, but I find that this does not give you a sense of the risk involved in the balance sheet as your ROEs can often be bloated by a low equity base (growing your assets using a low equity base implies high risk). I think the more appropriate metric whilst gauging banks is the ROA (Return on Assets) metric as it gives you a sense of the quality of assets after all costs are accounted for; comparing CM’s ROA numbers to the other top Canadian Banking stocks, I can’t help but feel a little let down. At 0.73%, it is lower than all the other peers, and given the potential pressure with heightened credit costs and weak operating leverage in H2, it’s hard to see this number improving significantly.
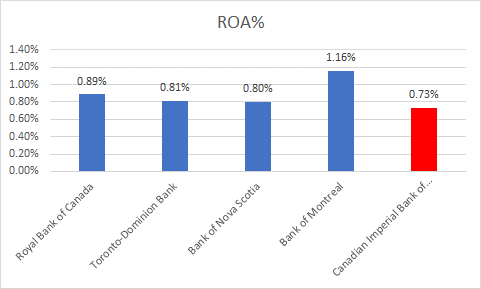
Seeking Alpha
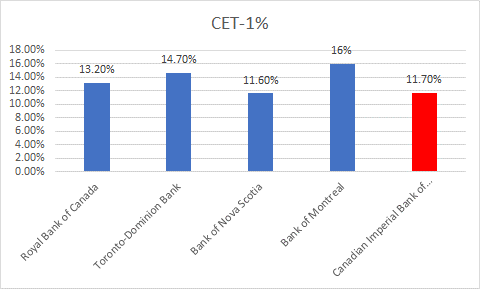
I’d also urge investors to consider the CET-1 ratio of Canadian Imperial Bank, which has dropped to its lowest level (11.7%) since FY19. It may still be above the regulatory minimum, but note that the likes of RY, TD, and BMO have far superior CET-1 ratios which put them in a much better position to use the excess capital to grow their loan books or resort to other productive measures of capital allocation. CM, I suspect, would remain somewhat conservative in growing its book, even as it tries and rebuilds its capital position after the Costco deal.
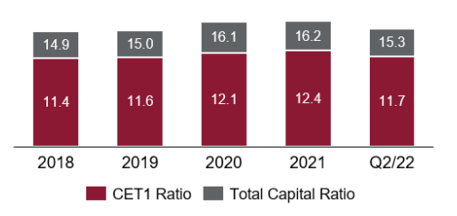
CM- Q2 Earnings Presentation
Q2 Earnings Transcripts
Finally, I’d conclude with the technicals; first, we have a chart highlighting the relative strength position of CM’s stock versus other global financial stocks, as represented by the iShares Global Financials ETF (IXG). We can see that this ratio still remains somewhat overextended towards the upside and is a long way off its lower trendlines. This would reflect sub-optimal risk-reward if you’re thinking of going long.
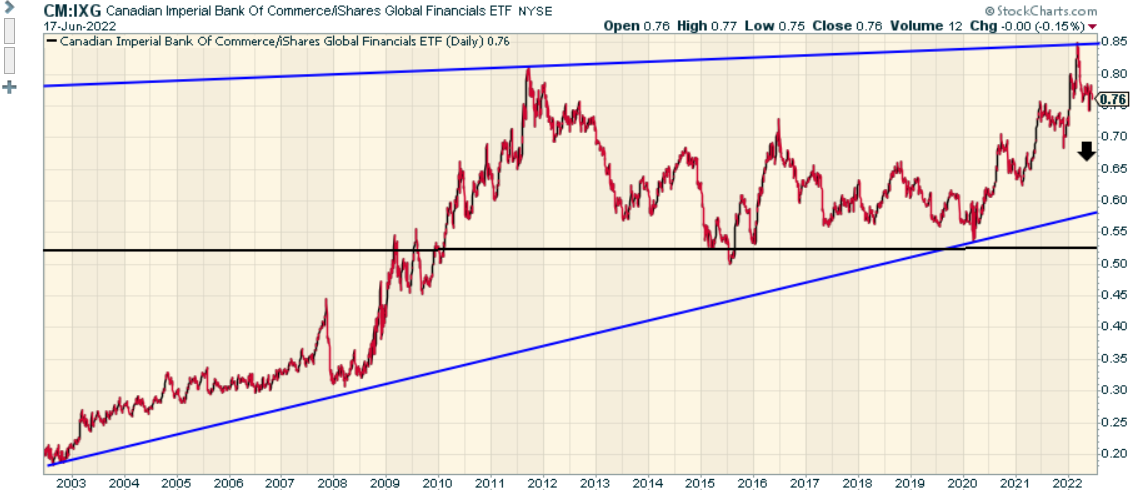
Stockcharts
Similar dynamics can also be witnessed on the standalone long-term chart of CM; although it no longer looks overbought and has collapsed back into its long-term ascending channel, the fact that it still trades so far away from the lower boundary makes me a little wary.
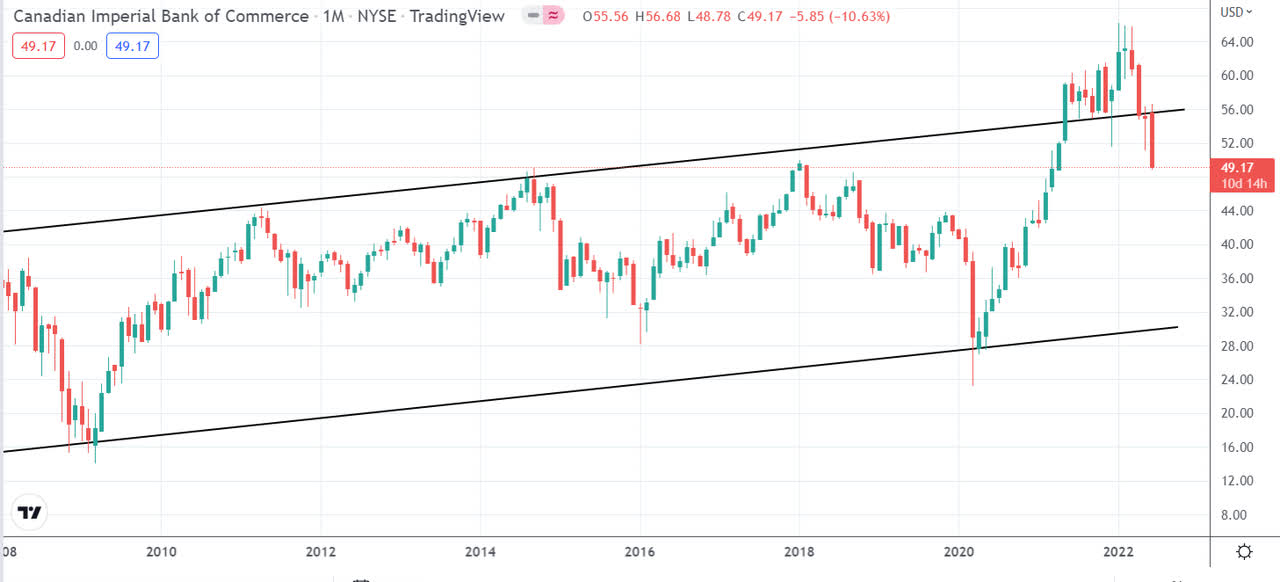
Trading View
To conclude, I like the potential for NIM expansion and the dividends and valuations on offer, but there are also plenty of risks at this stage of the cycle, and the technical picture doesn’t look too appealing either; CM is a HOLD.
Be the first to comment