

JHVEPhoto
The Invesco High Yield Equity Dividend Achievers ETF (NASDAQ:PEY) provides exposure to high-yielding large-cap companies that have consistently grown their dividends.
Although the PEY exchange-traded fund (“ETF”) has done well in the short-term, the fund’s longer-term historical returns are mediocre compared to peers. It also has a notably higher level of volatility. Finally, a big detractor on the PEY ETF is its high cost, as the PEY ETF charges an expense ratio of 0.52%.
Fund Overview
The Invesco High Yield Equity Dividend Achievers ETF provides exposure to large-cap companies that have consistently grown their dividends. The fund has $1.5 billion in assets.
Strategy
The PEY ETF tracks the Nasdaq US Dividend Achievers 50 Index (the “Index”). The index is designed to track a portfolio of the 50 issuers with the highest modified dividend yield. To qualify for the index, an issuer must have increased its dividend annually for the past 10 calendar years, as well as have a minimum market cap of $1 billion.
Conceptually, the index methodology behind the PEY ETF is very similar to the Vanguard Dividend Appreciation ETF (VIG), which tracks the S&P U.S. Dividend Growers Index. The VIG’s index also selects stocks based on 10 years of consistently growing dividends. I wrote about the VIG ETF a few months ago. In fact, the VIG ETF used to track the Nasdaq US Dividend Achievers Select Index (same index family as the PEY) up until September 2021.
Portfolio Holdings
Figure 1 shows the PEY ETF’s sector allocation. The PEY ETF has a total of 50 positions, not including cash. It is heavily weighted towards defensive sectors such as utilities (24%), financials (21%), consumer staples (18%) and healthcare (7%).
Figure 1 – PEY sector allocation (invesco.com)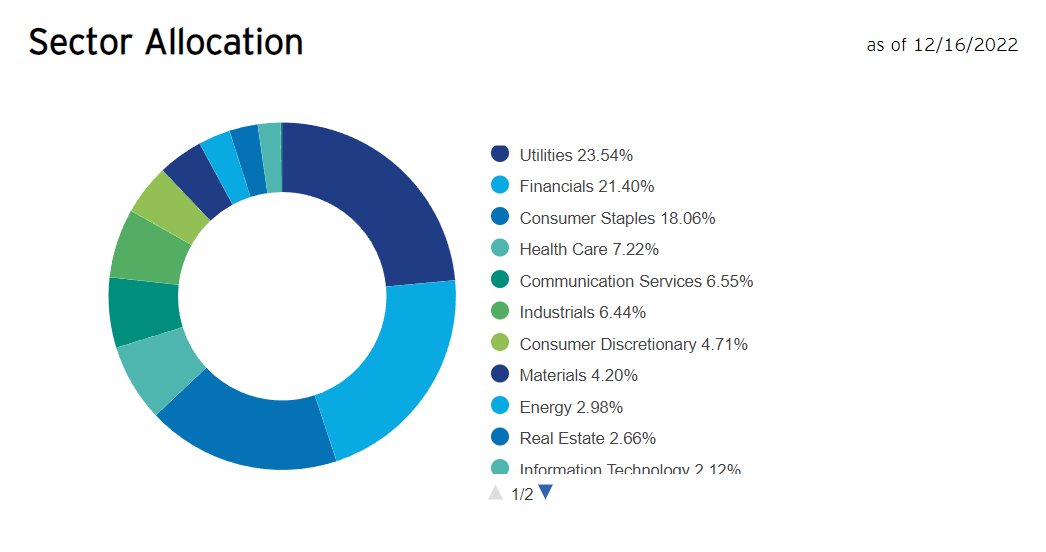
The PEY ETF’s portfolio has an average trailing P/E of 10.9x, far below that of the S&P’s 18.9x. The PEY’s top 10 positions are shown in Figure 2, and account for 28.9% of the fund.
Figure 2 – PEY’s top 10 positions (invesco.com)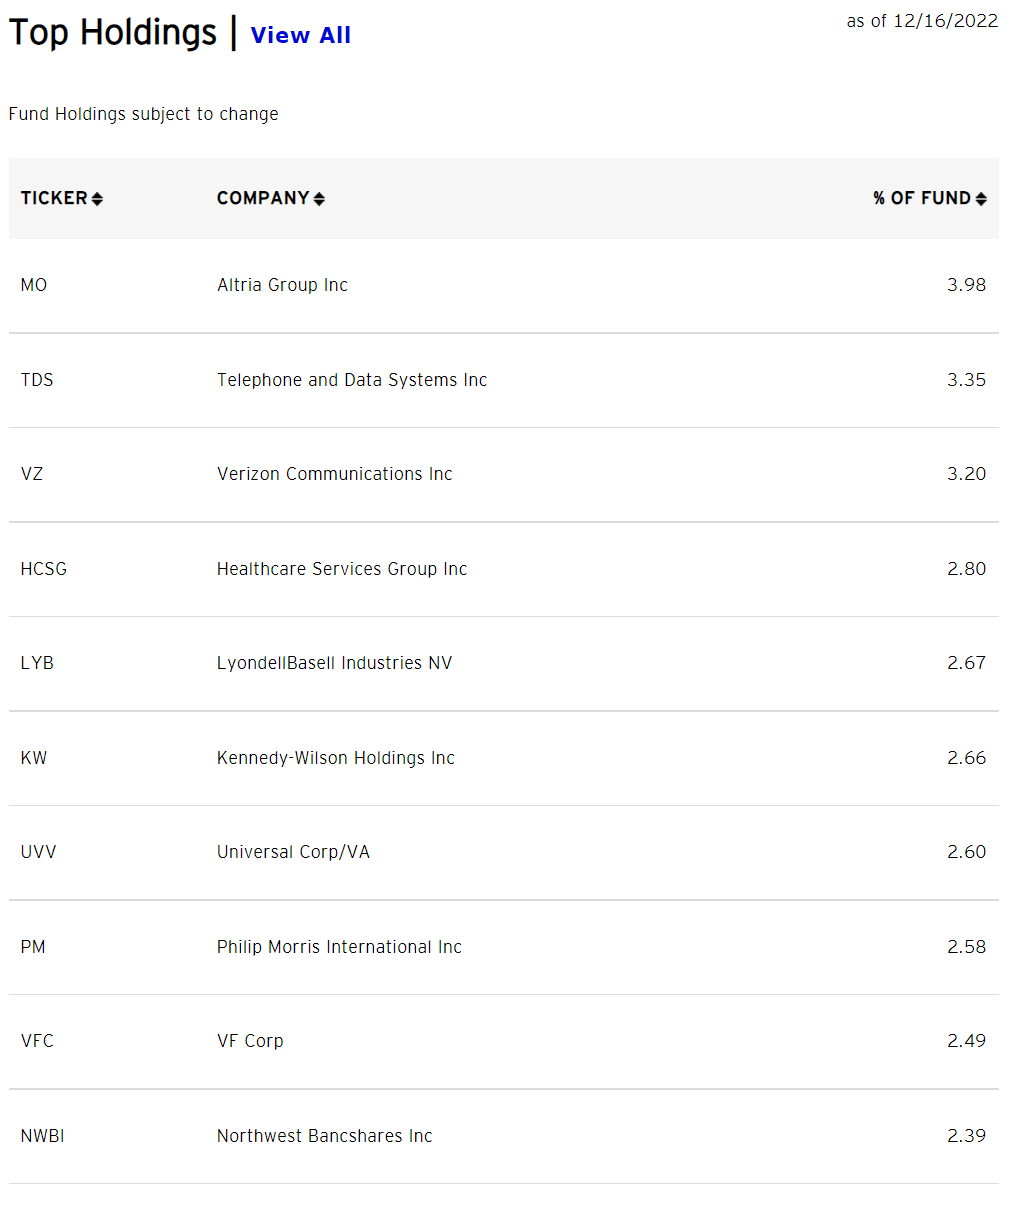
Returns
Figure 3 shows the historical returns of the PEY ETF. The fund has had decent historical returns, including a 3Yr average annual return of 10.6% and an impressive 6.2% return YTD to November 30, 2022.
Figure 3 – PEY historical returns (invesco.com)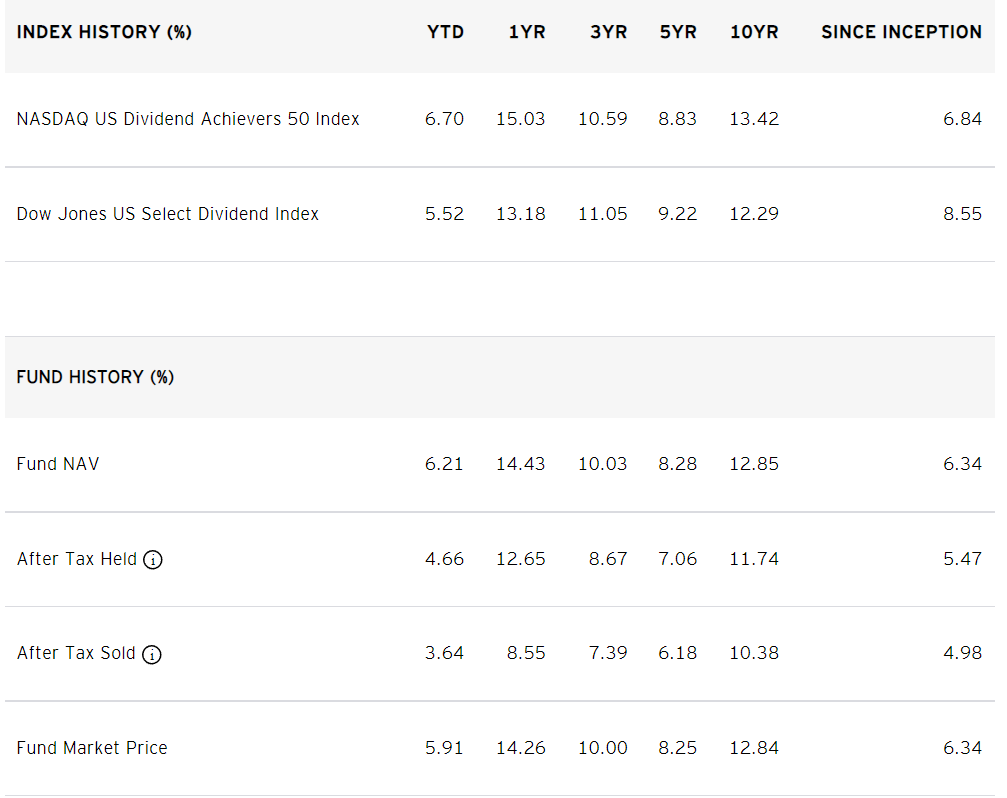
Distribution & Yield
The PEY ETF pays an attractive trailing 12 month $0.83 / share in distribution, which works out to a 4.1% distribution yield. PEY’s distribution has been growing at a 5Yr CAGR of 7.8% (Figure 4).
Figure 4 – PEY has an A+ dividend grade from Seeking Alpha (Seeking Alpha)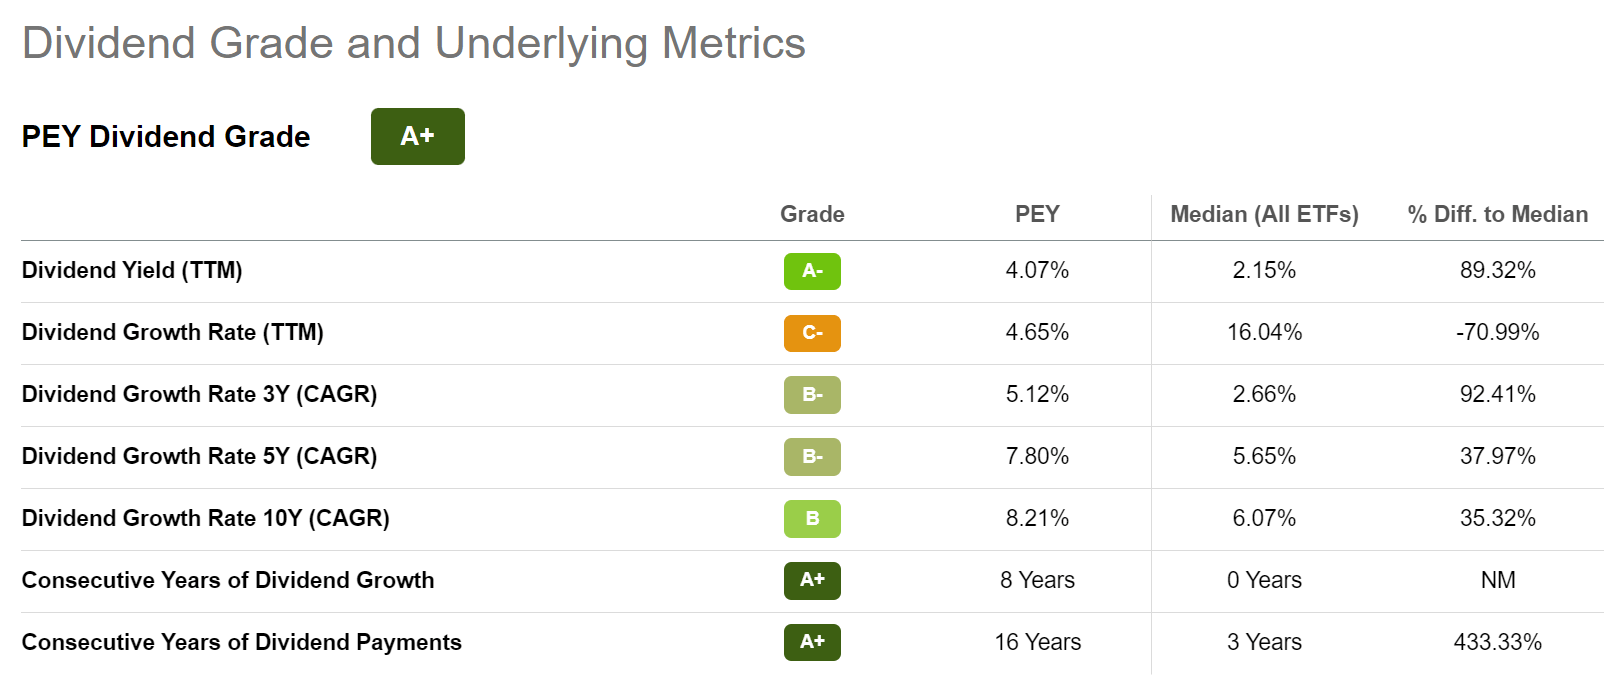
Fees
PEY charges a relatively expensive 0.52% expense ratio vs. best in class peers such as the VIG ETF or the Schwab U.S. Dividend Equity ETF (SCHD), which only charge 0.06%.
PEY Vs. Peers
Comparing PEY to its peer dividend funds using Portfolio Visualizer for the period November 2015 to November 2022, there are a number of notable observations (Figure 5).
Figure 5 – PEY vs. peer funds (Author created with return and risk from Portfolio Visualizer and distribution and fund details from Seeking Alpha)
First, the PEY ETF has one of the best short-term return profiles, with YTD and 1Yr returns of 6.1% and 14.2% respectively to November 30, 2022. This is surprising as PEY only has a 3.7% sector weight in energy. Energy has been the only sector with positive returns in the past year and has been the main driver of short term outperformance for peer funds like the WisdomTree U.S. High Dividend Fund (DHS), which has a 19.0% allocation to energy as of December 15, 2022.
Instead, PEY’s outperformance appear to have been driven by financial and healthcare companies such as Unum Group (UNM), which returned over 70% in the past year, and Cardinal Health Inc. (CAH), which returned over 60%.
Although PEY has outstanding short-term returns, it’s longer term returns are more pedestrian, with a 5Yr Annualized return of 8.3% to November 30, 2022 vs. best-in-class peers. Furthermore, PEY has higher than peer volatility, with a 17.0% Stdev of returns, which gives it a middle of the pack Sharpe Ratio.
PEY does have the third highest current distribution yield at 4.1%, and the dividend has grown at a 7.8% 5y CAGR.
Overall, my composite scoring system gives PEY a middle of the pack ranking (Figure 6).
Figure 6 – PEY vs. peers composite score (Author created)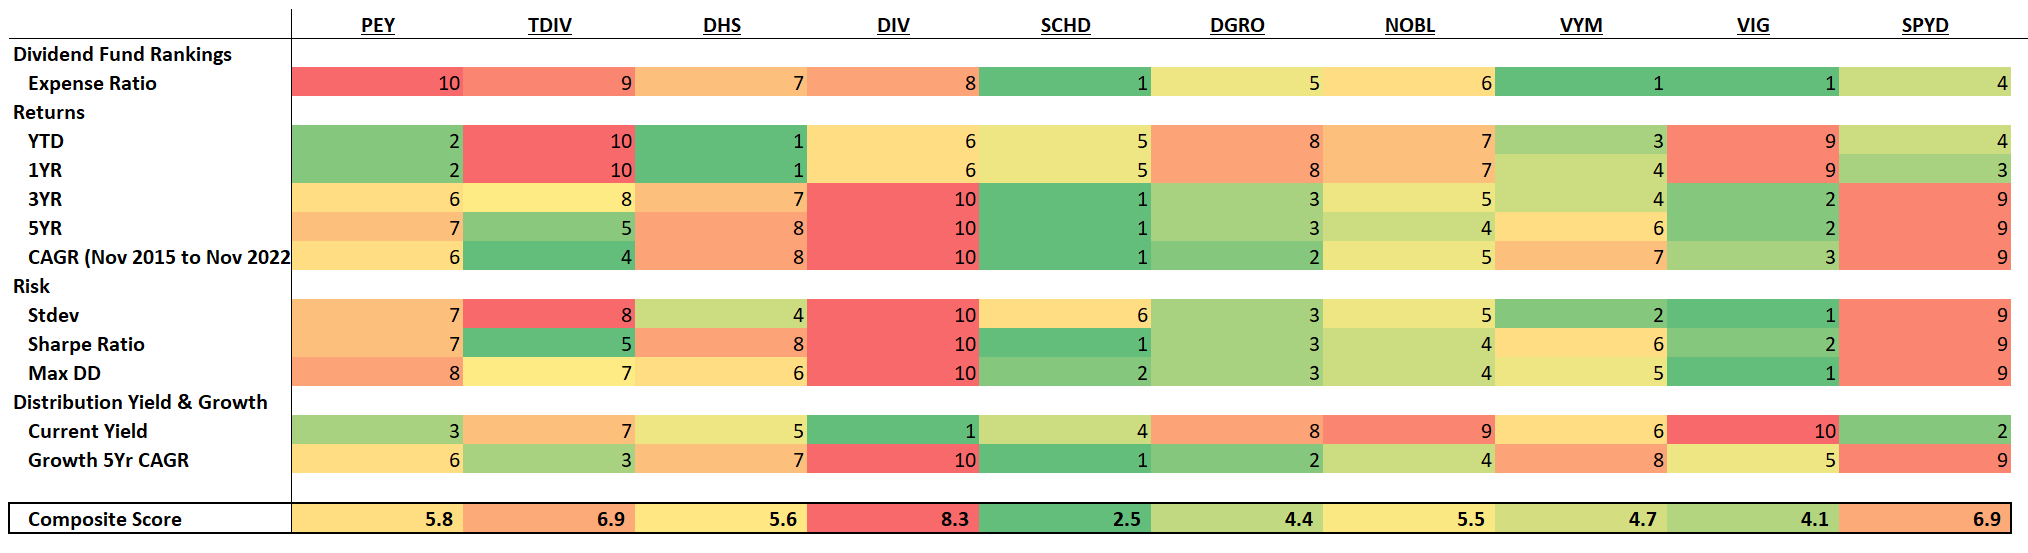
PEY vs. VIG
Another notable observation is that despite having very similar core index construction methodologies between the PEY and VIG (10 years of growing dividends), the two funds’ return and risk rankings are starkly different. While PEY has delivered strong short-term returns, VIG’s 1Yr results are weak. However, VIG has some of the best long-term historical performance figures vs. mediocre returns for PEY. Surprisingly, there are no overlaps in the top 10 holdings between PEY and VIG.
VIG also has the lowest volatility and maximum drawdown, and among the best Sharpe Ratio. Finally, PEY has one of the best current yields, while VIG’s current yield is one of the lowest.
Conclusion
The PEY ETF is Invesco’s entrant in the competitive high yielding dividend ETF category. Although the PEY fund has done well in the short-term on the back of several notable winners in the past year, the fund’s long term returns are mediocre compared to peers. The PEY ETF also has a notably higher volatility than most of its peer funds. Finally, a big detractor of the PEY ETF is its high cost, as the PEY ETF charges an expense ratio of 0.52%.
Be the first to comment