

BTCUSD: Double Bottom Pattern Above $53,000
Bitcoin suffered heavy losses at the end of last week when it touched a low of $53,700 and remained in the bearish trend.
At the start of this week, bitcoin had a major bullish correction after it recovered from its last-week losses and gained more than 6%, touching the $57,000 handle.
This week, bitcoin is moving in continuation of a mild bullish trend and giving mixed signals. At present, BTCUSD is trading above the $56,000 handle in the European trading session.
We can clearly see a double bottom pattern above the $53,000 handle, which is a bullish reversal pattern signifying the end of the downtrend and a shift towards an uptrend.
Yesterday, we saw BTCUSD touching an intraday high of $57,635 after which the prices started to decline and, today, touched an intraday low of $56,795.
The immediate short-term outlook for bitcoin has turned NEUTRAL and we will have to wait till the clear market signals are visible.
Williams percent range is overbought which signifies that more selling is expected today in the US trading session, pushing the prices of BTCUSD below the $56,000 handle.
Bitcoin is now moving above its 100 hourly simple and exponential moving averages.
The average true range is indicating less market volatility which means that markets are due to enter into a consolidation phase soon.
- Bitcoin trend reversal is seen above $53,000
- Stoch is indicating OVERBOUGHT levels
- The price is now trading just below its pivot level of $57,213
- All the moving averages are giving a NEUTRAL signal at current market level of $56,820
Bitcoin’s Mild Bullish Trend Towards $58,000
BTCUSD is now trading above its important support level of $56,500 and needs to remain above this level for the bullish trend to continue today.
Some of the major technical indicators are giving a STRONG SELL signal, which means that the prices can also get a downward correction before reaching the level of $60,000.
The price of BTCUSD is trading below its classic resistance level of $57,363 and Fibonacci resistance level of $57,478 in the European trading session.
In the last 24hrs BTCUSD has gone DOWN by -1.19% with a price change of -682$ and has a 24hr trading volume of USD 31.536 billion. We can see an increase of 7.64% in the trading volume as compared to yesterday.
The Week Ahead
We can see that bitcoin has recovered from its losses and is on its way towards the $58,000 handle this week.
The medium to long term outlook remains BULLISH for bitcoin with the target of $65,000. At present, the markets are giving a SELL signal so it would be better to wait before entering the long positions in bitcoin.
The relative strength index of 46 is indicating a NEUTRAL market and fresh buying is expected in the market at any time.
It is also possible for bitcoin to remain in a sub-consolidation phase below the $57,000 handle this week and start its bullish move next week.
Technical Indicators:
Stoch (9,6): at 97.13 indicating an OVERBOUGHT level
Average directional change (14-day): at 30.35 indicating a SELL
Rate of price change: at -0.288 indicating a SELL
Ultimate oscillator: at 39.55 indicating a SELL
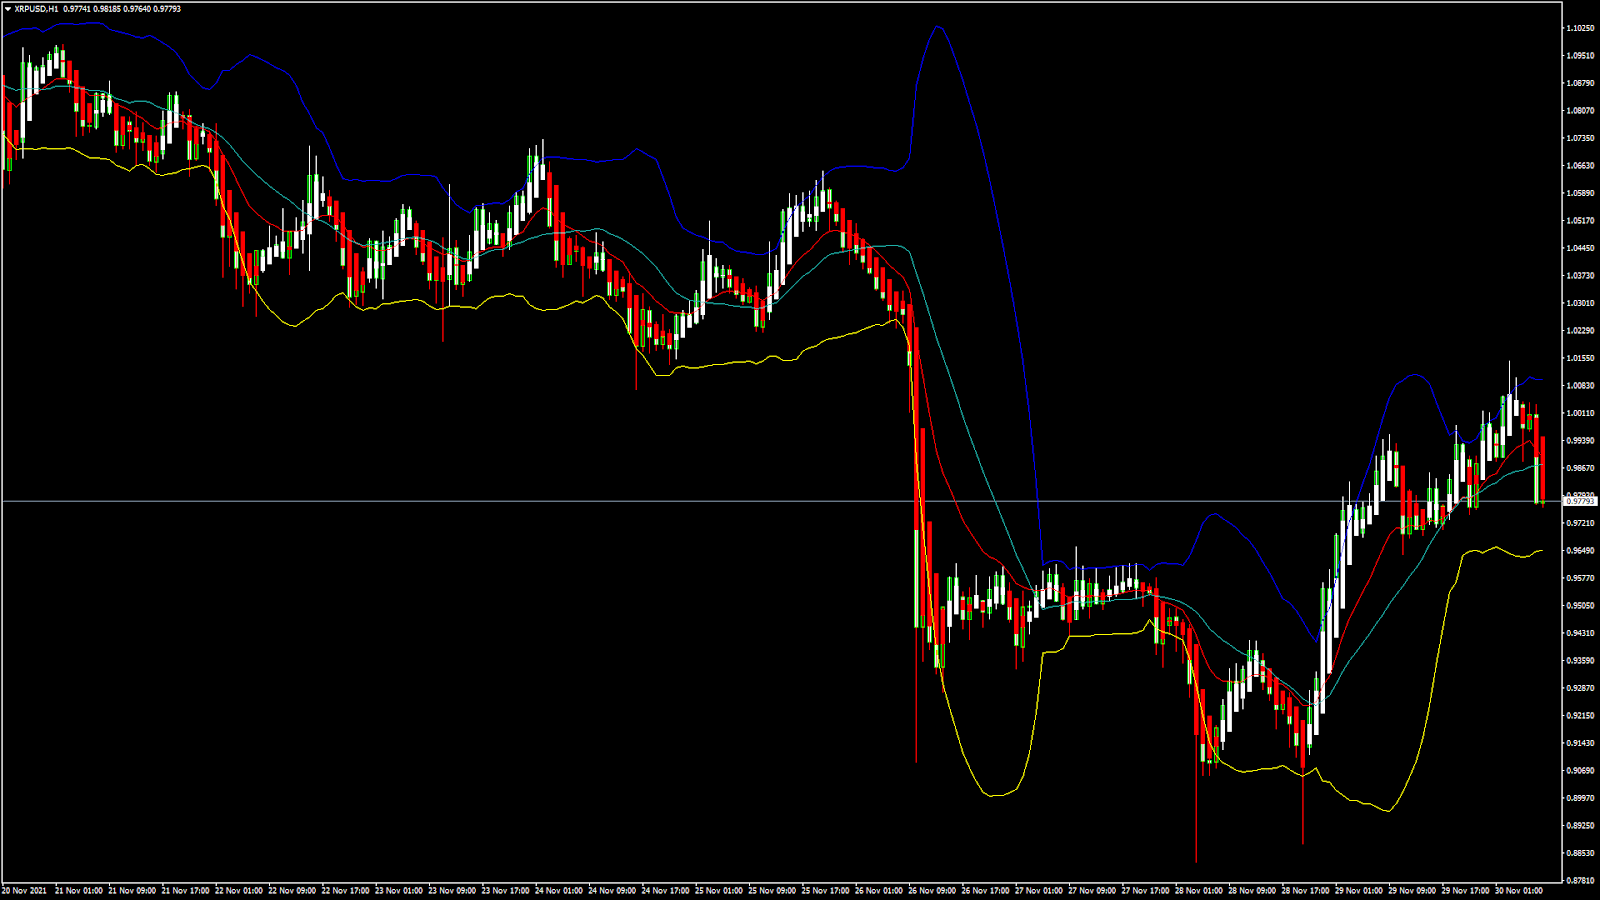
XRPUSD: Double Bottom Pattern Above 0.9000
Ripple had a major bearish correction last week where it entered into a strong bearish trend. We have seen the prices touching a low of 0.9402 and 0.9202 after which markets had a bullish reversal.
We can clearly see a double-bottom pattern above 0.9000 which is a bullish reversal pattern and signifies the end of a downtrend and a shift towards an uptrend.
Last week, we saw Ripple dropping by more than 8% due to the broad-based profit taking seen across all the cryptocurrencies.
In the Asian trading session today, Ripple has touched an intraday high of 1.0144 and an intraday low of 0.9769.
The relative strength index is indicating a NEUTRAL market which means that markets are due to enter a consolidation phase and move in a sideways channel today.
The short-term outlook for Ripple is NEUTRAL, the medium-term outlook appears mildly bullish, and the long-term outlook is bullish.
Ripple is now trading just below its pivot level of 0.9859 and remains above its classic support level of 0.9687 and Camarilla support level of 0.9753 in the European trading session.
- All technical indicators are giving a SELL signal
- Williams percent range is indicating OVERSOLD markets
- All the moving averages are giving a SELL signal
- Average true range indicates HIGH market volatility
Ripple: Mild Bullish Trend Towards 1.0000
Ripple has recovered from its strong bearish trend seen last week, but the price still remains below the important psychological support level of 1.0000.
We can see that market volatility is HIGH today which means more buyers can enter into the markets at any time.
The technical indicators and moving averages are giving SELL signals which means that the price of Ripple is due to enter into more downwards correction in today’s US trading session.
This week, we can see XRPUSD trading in a narrow range and if the price breaks the 1.0000 handle, we may see 1.0300 to 1.0500 in the coming days.
The price of XRPUSD has gone DOWN by -0.95% with a price change of -$0.01339 in the past 24hrs and has a trading volume of 2.928 billion USD.
We can see a 15.65% increase in the trading volumes of Ripple in the last 24 hours.
This Week Ahead
The price of XRPUSD is trading below its pivot level of 0.9859 in the Asian trading session. Ripple would need to clear its classic resistance level of 0.9950 and Fibonacci resistance level of 0.9960 which will open its path towards the 1.0000 handle.
It would be best to wait at the current market level and only enter into a long position after a decline. Those traders who are looking to enter a short position can also enter at current market levels for a short period of time.
If Ripple is able to break above 1.0000, we could see the levels of 1.0300 and 1.0500 again this week.
Technical Indicators:
Commodity channel index (14-day): at -133.77 indicating SELL
Average directional change (14-day): indicating a NEUTRAL market
Relative strength index (14-day): indicating a NEUTRAL market
Bull/Bear power (13-day): at -0.0233 indicating a SELL
Be the first to comment