

While the ongoing pandemic and energy price disruption have affected most companies, Intercontinental Exchange (ICE), by contrast, has greatly benefited from this environment, as evidenced by its Q1 2020 financial report. As ICE should continue to thrive during this scenario, the company also relies on key initiatives to boost future growth. Given its privileged business outlook, I regard ICE as a core holding in the financial sector looking to outperform the broader market in any time frame going forward.
Q1 2020 Earnings Highlights And Outlook
Net revenue came in at $1.56 billion in the quarter, surpassing consensus by 1% and up 23% over a year ago. It is interesting that the year 2020 started with January as the best revenue month in the company’s history, just before key disruptive events in the quarter, COVID-19 outbreak and Russia-Saudi disputes, leading to an energy price collapse.
The trading and clearing segment revenue totaled $883 million, up 44% in the quarter, driven by record volumes, as average daily volumes grew double-digit over a year ago in different asset classes, such as energy (+42%), agriculture and metals (+31%), and interest rates (+28%). The volatility at the end of quarter related to March OPEC meeting and central bank’s move to cut interest rates across the U.S. and Europe added to the already high volumes experienced in January and February. The quarter also had an increased demand for credit protection, driving the revenue of fixed income and credit business up 41% over a year ago.
The data and listing segment revenue came in at $676 million in the quarter, as data services grew 4% over a year ago, driven by pricing and reference data business as well as the strong performance of ICE Global Network offerings. In addition, the revenue of listing business remained stable, with a relatively high number of 15 IPOs during the quarter, taking into consideration the high volatility in this period.
Adjusted operating expenses were $597 million in the quarter, an increase of 13% over a year ago but at a much slower pace than revenue growth. This helped adjusted operating income to increase 30% year-over-year to $962 million, while adjusted EPS came in up 39% over a year ago at $1.28, surpassing estimates by 4.9%.
As we move throughout Q2, the management team sees high trading volumes across asset classes. Energy markets, for example, sported a growth of 50% in average daily volume in April over a year ago, while open interest was up 23%, driven by commercial players building longer-dated positions, looking to hedge their exposure to price risk, given the continued high volatility in energy prices.
While energy and agriculture markets will probably continue to experience elevated activity in the coming months, financial futures are expected to have reduced demand after aggressive actions from central banks.
In addition, the data services segment is expected to deliver sequential growth in Q2, driven by stable pricing and analytics business but accelerate throughout the year reaching FY 2020 revenue guidance.
While short-term prospects are overall constructive, ICE continues to focus on growth initiatives. One of them is the ETF Hub platform, launched in Q2 2019, which was designed to standardize and improve the efficiency of the ETF redeem process. Its initial deployment stage has been positive, with nearly $200 billion in notional trade already on the platform and a fixed income volume of $63 billion in March alone. In addition, a few days ago, the company launched ICE-Select, a portal intended to provide connectivity to ICE fixed-income solutions.
ICE has also invested in the capability to manage and trade a variety of digital assets on a single platform. The recently announced acquisition of Bridge2 Solutions will support Bakkt, a subsidiary of ICE, to offer loyalty programs to top retail brands.
With these initiatives underway and high customer retention, ICE seems well positioned to sustain its growth trajectory, as evidenced by a large number of analysts covering the company who have recently increased EPS forecasts, as displayed below.
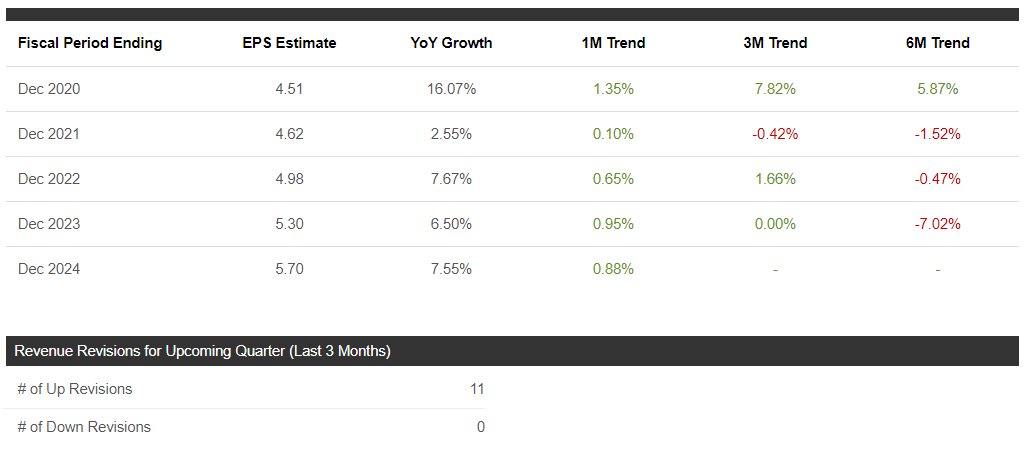
Source: Seeking Alpha
Financial Analysis and Valuation
I am going to compare ICE’s financial and valuation metrics with other three financial exchange and data names (CBOE, CME, and Nasdaq (NASDAQ:NDAQ)) as well as with the broader financial market, using the XLF – The Financial Select Sector SPDR as a reference.
Starting with the profitability analysis, ICE’s operating income margin is in the second position among XLF constituents, just below CME. In addition, ICE’s operating income and revenue growth rates over the past 5-year period are well above the average of XLF and are the second-best among financial exchange peers, just below CBOE. Of note, we can see that CME also shows higher growth rates than the broader financial sector, while Nasdaq is the only exception among financial exchanges to lag the financial bench market.
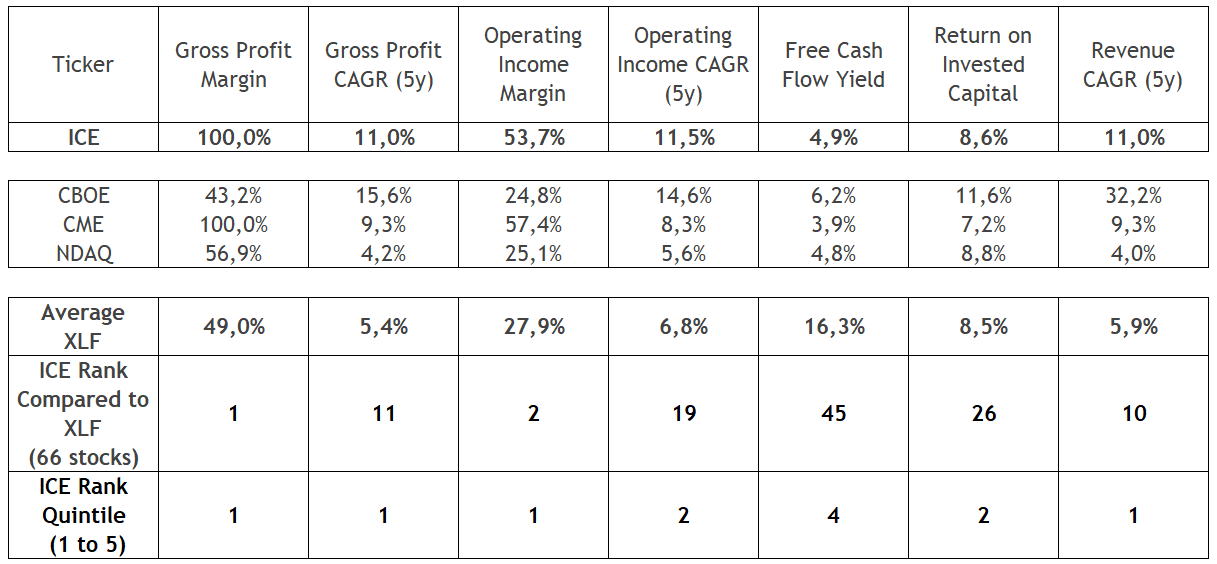
Source: Data from Finbox, consolidated by the author
Shifting to the financial health, ICE’s financial position is generally better than the average of the XLF constituents, while we see a mixed bag comparing to CBOE, CME, and Nasdaq. On the chart below, we can see that despite ICE has increased its financial debt since 2018, its financial debt/EBITDA ratio has remained below the levels seen in 2017.
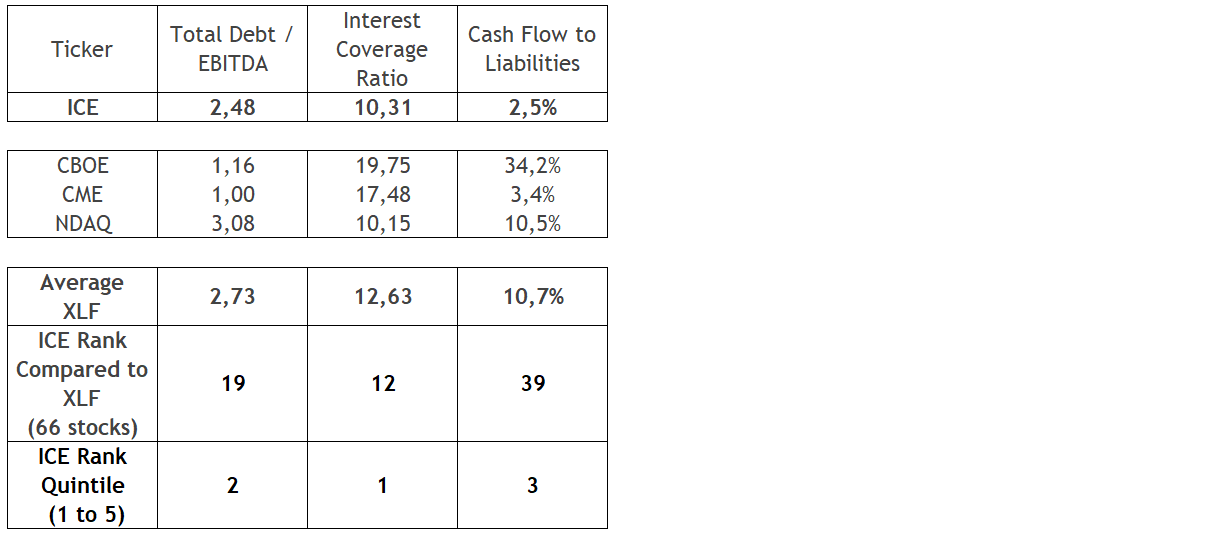
Source: Data from Finbox, consolidated by the author
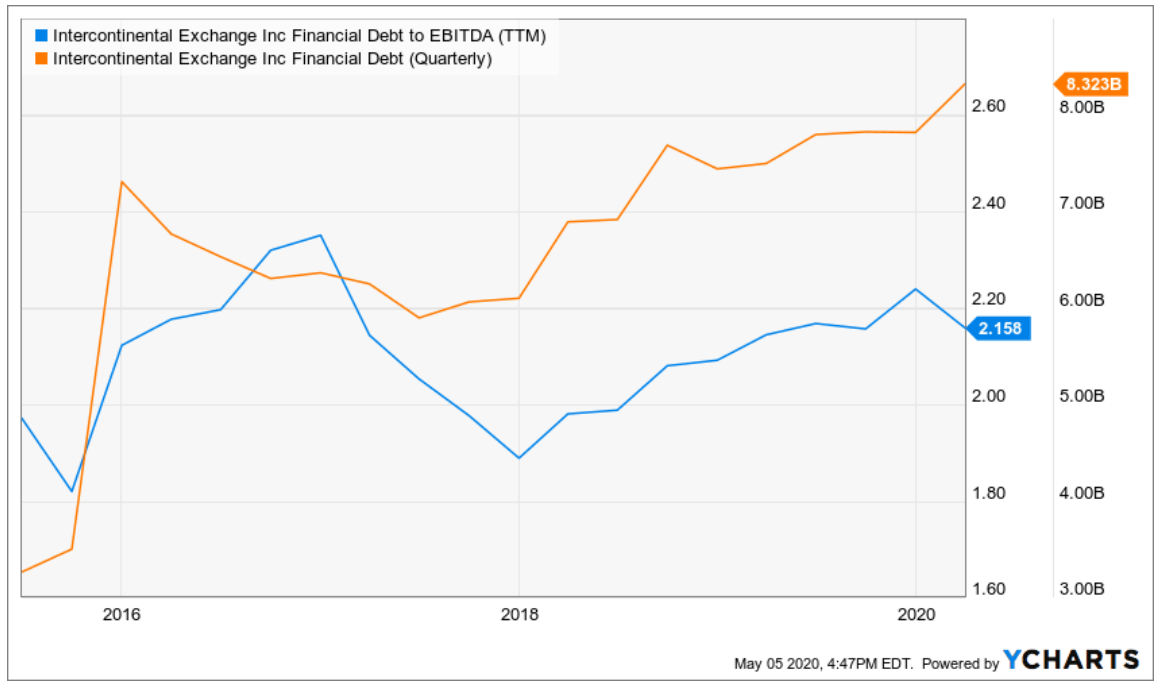
Source: YCharts
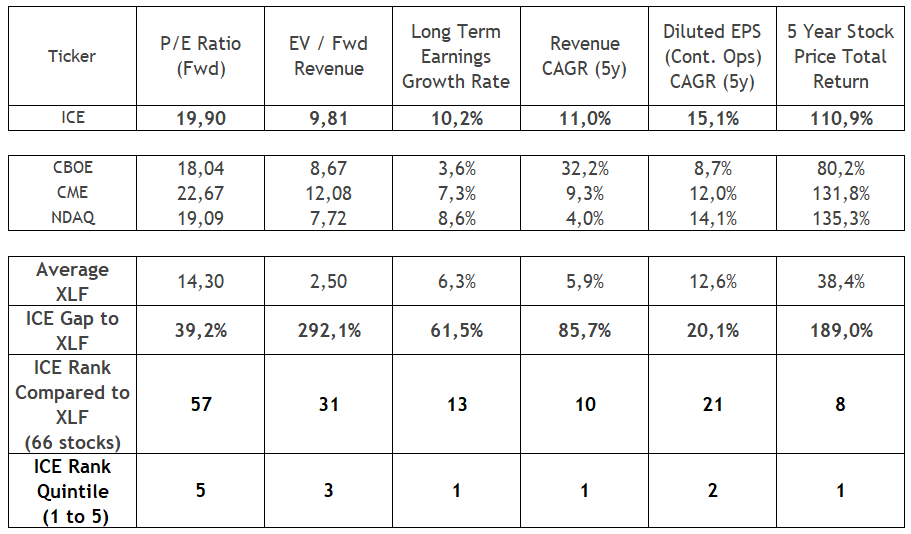
Moving to the valuation analysis, ICE trades at much higher P/E and EV/Revenue multiples compared to the XLF bench market, which is largely justified due to its higher growth profile, both in terms of long-term earnings growth forecast and also historical EPS and revenue growth.
Looking at ICE’s direct peers (CBOE, CME, and Nasdaq), we see that ICE’s PE Fwd is roughly in the middle of the group, as all of them show higher multiples than XLF, and CME seems a little overvalued, trading at 22.7x PE Fwd. Meanwhile, ICE’s earnings growth is the highest one, followed by Nasdaq, which suggests an upside to ICE going forward.
Source: Data from Finbox, consolidated by the author
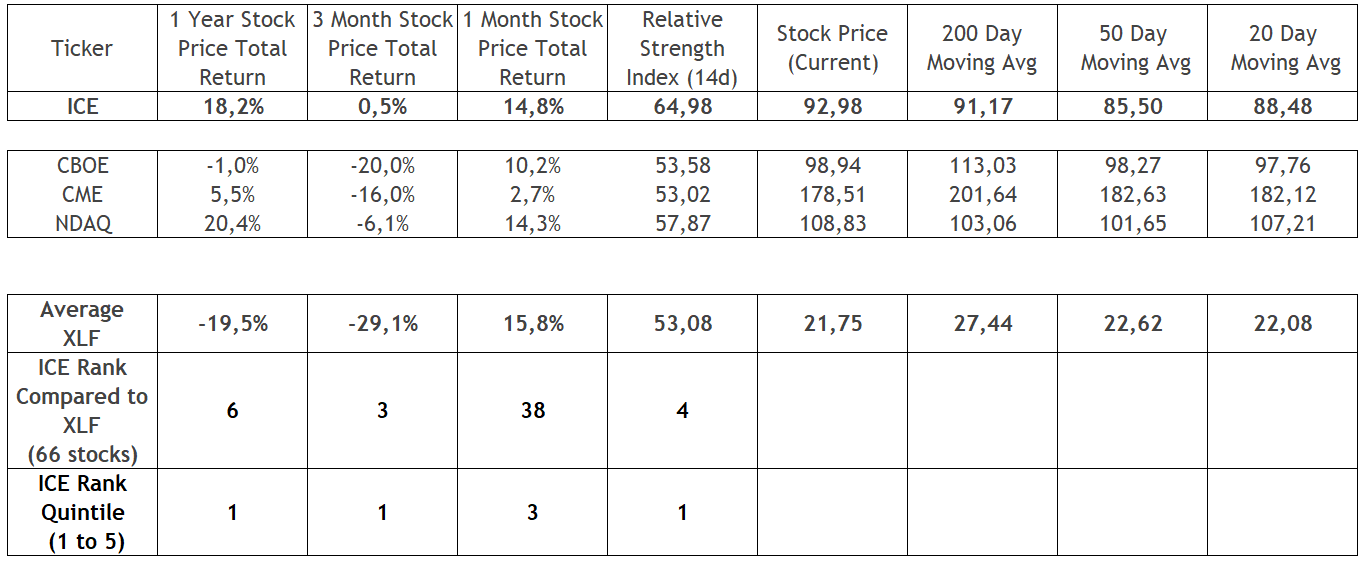
The price momentum analysis shows that shares of ICE have outperformed the financial broader market and direct peers over the past 3 months, but lagged in the recent 1-month period. Despite the relative weakness in the recent month, ICE’s 20-day moving average has crossed above the 50-day moving average, which is indicative of the positive momentum of the stock still in place.
Source: Data from Finbox, consolidated by the author
On the other hand, as we can see in the chart below, ICE’s stock price is approaching a key resistance region near the range of $95 to $100, which suggests that it may be a necessary consolidation phase before sustainable gains above this level.
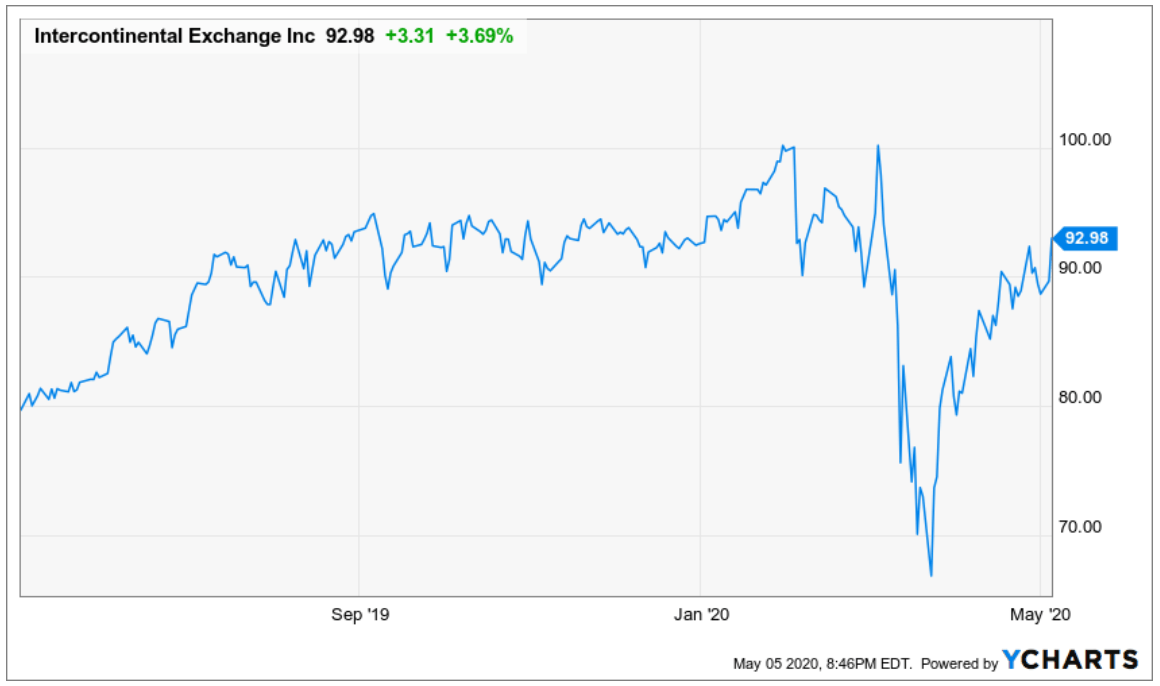
Source: YCharts
Takeaway
As long as we remain in this highly volatile environment, ICE should continue to deliver strong revenue from trading activity. Meanwhile, ICE’s data services business remains stable and the company is investing in new applications to boost future growth.
That said, it is not surprising that ICE is trading at higher multiples compared to the broader financial market. Furthermore, as ICE can continue to meet Wall Street’s estimations, I am confident that ICE should outperform the broader market in the long run while still comfortable owning shares of this company during these turbulent times.
Disclosure: I am/we are long ICE. I wrote this article myself, and it expresses my own opinions. I am not receiving compensation for it (other than from Seeking Alpha). I have no business relationship with any company whose stock is mentioned in this article.
Be the first to comment