

Justin Sullivan/Getty Images News
In our previous analysis of Intel Corp. (NASDAQ:INTC), we concluded that the company would continue lagging behind AMD (AMD) in terms of CPU capability based on process nodes for PC until 2023 based on both companies’ product roadmaps. We forecasted its CCG revenue to contract by 14.3% in 2021, as competition heats up with AMD which secured multiple design wins. In the data center CPU market, we also expected its share to decline by -6.1% with strong competition from AMD’s upcoming EPYC product, forecasting its DCG to remain flat with just a 1.7% increase. In its other business segments (including IoT, Mobileye and PSG), we expected Intel to do well with a forecasted average growth rate of 16.86% in the next 5 years driven by Mobileye with the growth of its ADAS. Overall, we expected Intel’s total revenue to decline by 6.5%.
However, Intel’s 2021 revenue growth came in at 1.5%, blowing past our estimates in both CCG and DCG. Its revenue came in even higher than management’s guidance of $77.7 bln. Its Q4 2021 results showed particular strength with revenues growing by 2.8% YoY and beating analyst consensus by 6.7% driven by growth higher than expected growth in CCG and DCG segments.
In this analysis, we re-examined its CPU business for the PC and server markets. We analyzed its performance of up to 10 chips per gen and at least past 4 to 5 gens to show how its performance has been over time measured by benchmark scores and compared it against AMD’s products to determine the performance advantages for the companies.
Moreover, we analyzed its market share change and projected it going forward based on our obtained average benchmark scores to forecast its share of unit growth of the desktop, notebook and server CPU market by comparing each generation to AMD and weighted its score with the latest generations having the highest weight and decreasing with each previous generation.
Lastly, we compared Intel’s sales against the global semicon industry in terms of the market share of sales based on quarterly TTM. Based on that, we also compared the foundries and chipmakers based on revenue growth rates, markets and country. Then, we compared its capacity expansion plans with its competitors and ongoing supply chain issues.
Following the huge increase in Intel’s CPU performance over the most recent generation, we expect a much more muted market share decline which gives us a total revenue growth forecast of 2% in 2022 followed by 7.6% in 2023. We believe this presents a strong buying opportunity for Intel.
Increasing PC and Server CPU Performance
Intel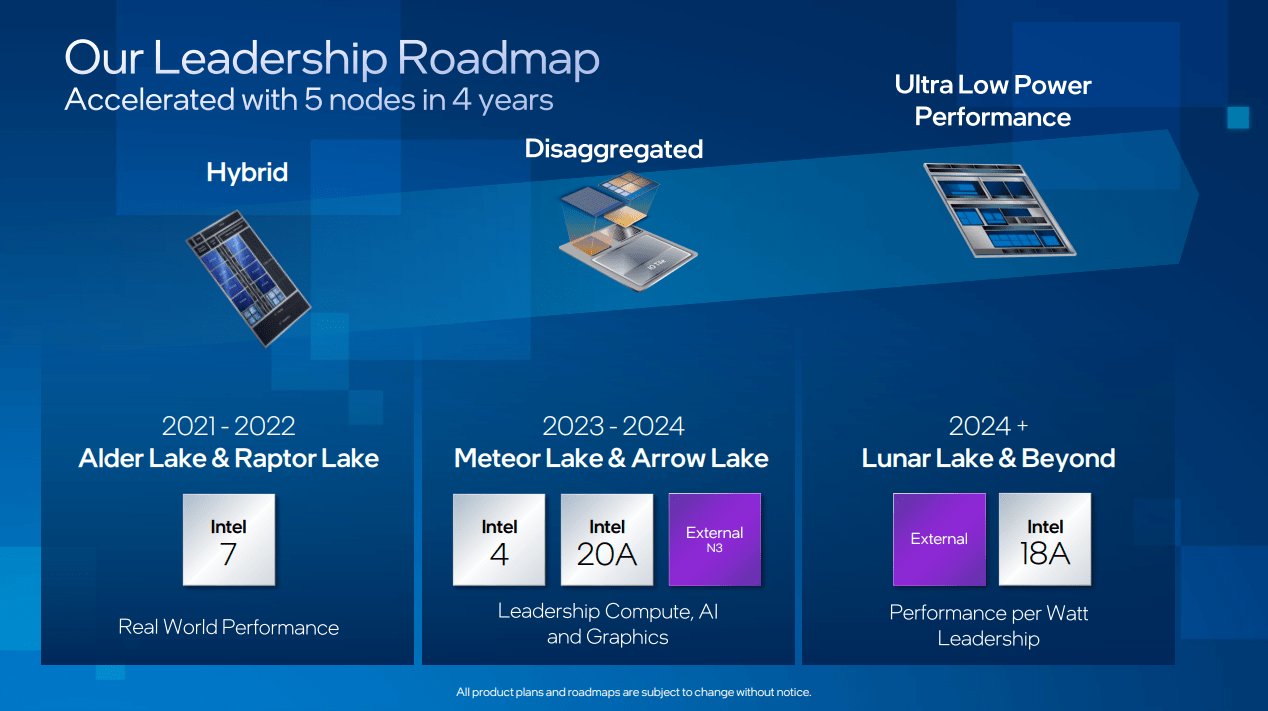
According to Intel’s latest product roadmap from its Investor Day presentation, the company is scheduled to release its upcoming client CPUs for Raptor Lake and Meteor Lake with a performance increase of up to 20% based on Intel 4 in H2 2022 followed by future products based on Intel 3 in 2023 and Intel 18A and 20A process nodes in 2024.
Intel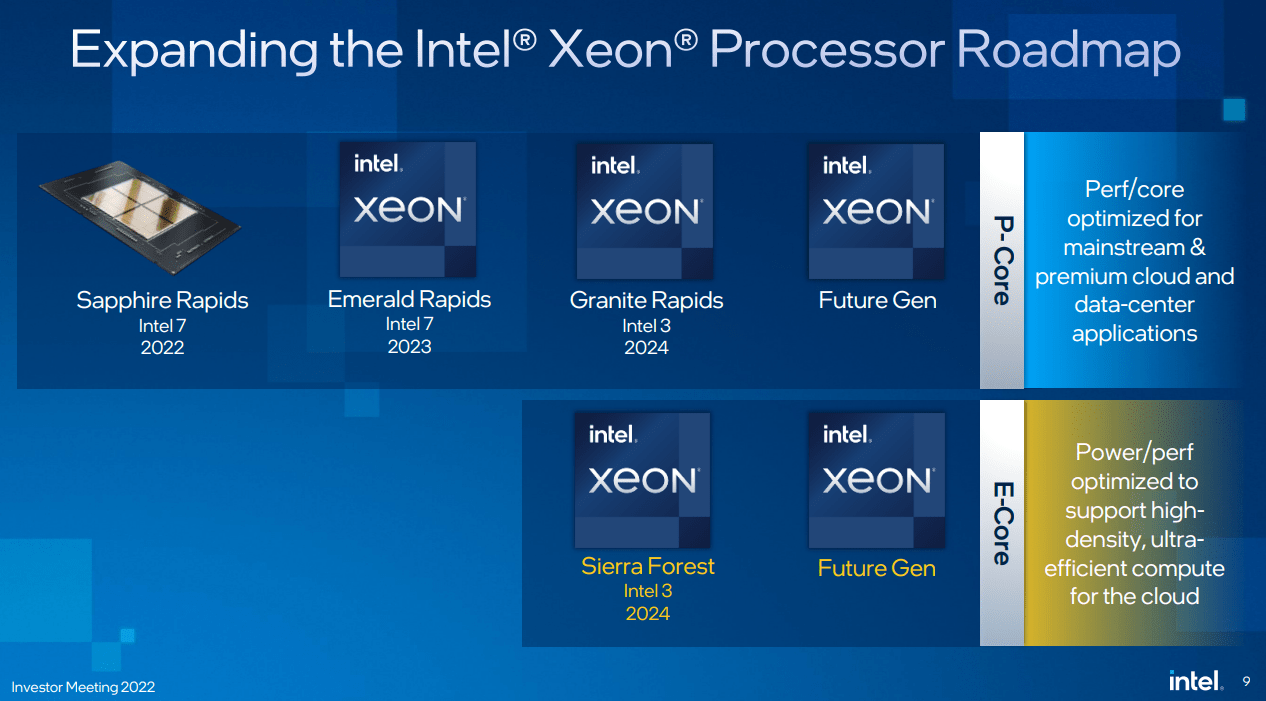
For server CPU, the company had pushed back its launch of its Granite Rapids which is based on Intel 3 to 2024. In our previous analysis, we highlighted Intel’s track record of product delays due to issues related to its process technology. However, Intel’s CEO cited the reason for the Granite Rapids push back was to have a biannual schedule for major new server products. In 2023, it is instead to release its Emerald Rapids product generation based on Intel 7 process similar to Sapphire Rapids launched last year but with improved performance. In 2024, the company is also scheduled to release Intel 3-based Sierra Forest CPUs.
To compare the competitiveness of Intel and AMD’s CPUs, we compiled the CPU benchmark scores from PassMark for each of their CPUs. For Intel, we looked into 138 CPUs across desktop, notebook and server categories across 5 product generations. Then, we looked compiled the benchmark scores for 94 CPUs from AMD for desktop, notebook and servers across 4 generations of desktop and notebook as well as 3 generations for servers. In total, we compiled the data for 232 products and derived an average for each generation for both companies according to the product generation. The chart below is a summary of the average benchmark scores for both companies.
Company 10K, PassMark, Khaveen Investments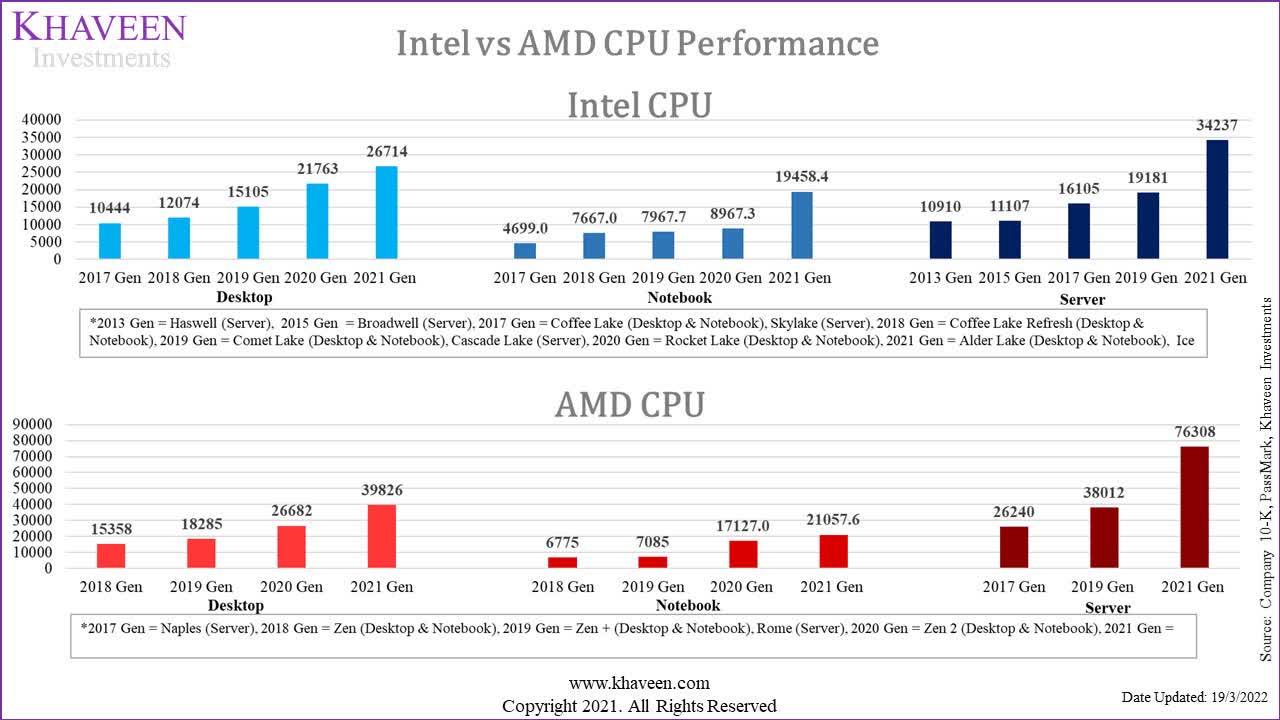
|
Average CPU Benchmark Score Increase |
Desktop |
Notebook |
Server |
|
Intel (5 generations) |
26.9% |
49.2% |
36.1% |
|
AMD (4 generations – Desktop & Notebook, 3 generations – Server) |
38.1% |
56.4% |
72.8% |
Source: Company 10K, PassMark, Khaveen Investments
Based on the chart of the CPU scores, both companies show an increasing trend for their average benchmark scores for each new generation which highlights the performance increase of their products. However, while both companies’ products had continuously improved for each generation, AMD shows the most improvement with their products with a higher average score increase across all product categories compared to Intel as seen in the table above. Though, we note that Intel’s 2021 gen (Alder Lake) average score showed a large increase over the previous-gen for notebooks (117%) but still lagging behind the average score of AMD’s Zen 3 based products. Similarly, Intel’s Ice Lake gen for servers also showed a notable increase of 78.5% for its average benchmark score but also still far behind AMD’s EPYC Milan products. Overall, AMD’s average scores across desktop, notebook and server are higher than Intel. We believe this provides AMD with an advantage in terms of product performance superior to Intel.
All in all, to determine Intel and AMD’s product performance, we compiled their CPU benchmark scores of its desktop, notebook and server CPUs and determined that AMD has an advantage across all 3 platforms as it has a higher average score than Intel. We believe this could be a factor to determine Intel and AMD’s competitive positioning based on product performance with AMD commanding a lead over Intel. However, the CPU shows continuous technological advancements as Intel and AMD have planned upcoming future product gens with could change their competitive positioning. We believe Intel could have an opportunity to continue increasing its product performance by examining its product roadmap. As the launch of Granite Rapids was delayed, we believe that this was unsurprising given its track record of delays. However, we believe this is different this time as the company cited its reason for the delay for a biannual schedule for major product launches. Given Intel’s large performance increase with its latest generations of Alder Lake and Ice Laker, we believe this shows a positive sign for the direction of its outlook in terms of product performance.
CPU Market Share Outlook
PassMark, Khaveen Investments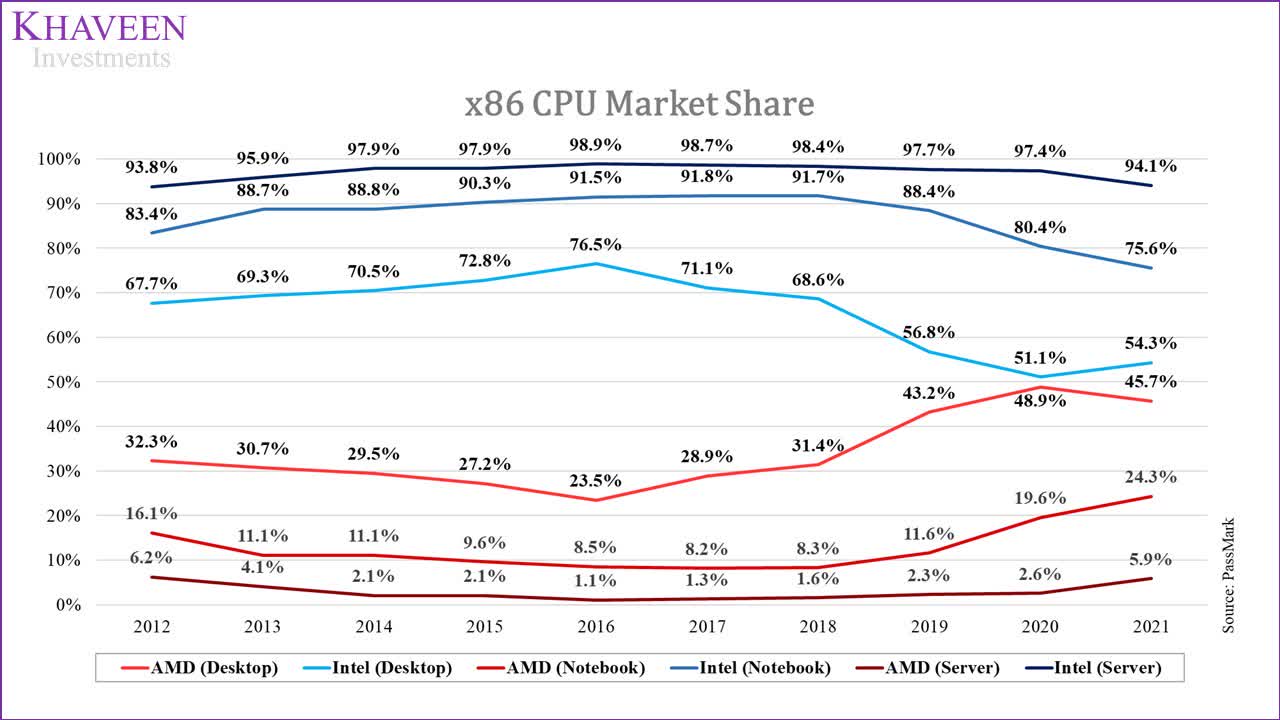
In 2021, Intel had managed to claw back some market share in the x86 desktop CPU market following 5 years of consecutive declines as it competed with AMD which had gained share. However, the company continued to lose market share in the notebook CPU market as AMD increased its share. In the server CPU market, Intel still holds a dominant lead over AMD but saw its market share eroded in 2021 to AMD as it gained share.
Based on our analysis of its CPU benchmarks above, we found that AMD’s products for its latest generations beat Intel across all desktops, notebooks and server categories. Then, we derived the average benchmark score between both AMD and Intel for each product generation and calculated Intel’s difference from the average. We then derived a weighted difference for Intel as our assumption for its share of growth. We assigned the weights according to the product generations with the latest gen carrying the highest weight and decreasing with each previous generation as we believe that the latest gen is more significant and reflects a greater allocation for the latest gens. Moreover, we then projected Intel’s market share based on its share of the growth of the PC and server market forecast CAGR with our obtained average score differences and desktop, notebook and server shipments market forecast through 2025. With our derived shipment forecast for Intel, we also factored in an ASP growth assumption based on its 5-year average to derive our total projection for its CCG and DCF segment revenues.
|
CCG Desktop Forecast |
2020 |
2021 |
2022F |
2023F |
2024F |
2025F |
|
Desktop Market Shipments (‘mln’) |
79.8 |
84.59 |
87.29 |
90.09 |
92.97 |
95.95 |
|
Market Shipment % (‘a’) |
-15.1% |
6.0% |
3.2% |
3.2% |
3.2% |
3.2% |
|
Intel’s Share of Growth (‘b’) |
0.86 |
0.86 |
0.86 |
0.86 |
||
|
Desktop Volume (‘c’) |
-11.0% |
8.0% |
2.8% |
2.8% |
2.8% |
2.8% |
|
Desktop ASP (‘d’) |
2.0% |
3.0% |
3.8% |
3.8% |
3.3% |
2.8% |
|
Revenue Growth % (‘e’) |
-9.6% |
11.2% |
6.7% |
6.7% |
6.1% |
5.6% |
|
Revenues ($ mln) |
10,692 |
11,835 |
12,623 |
12,623 |
13,398 |
14,152 |
|
CCG Notebook Forecast |
2020 |
2021 |
2022F |
2023F |
2024F |
2025F |
|
Market Shipments (‘mln’) |
222.5 |
276.8 |
285.7 |
294.8 |
304.2 |
314.0 |
|
Market Shipment % |
29% |
24% |
3.2% |
3.2% |
3.2% |
3.2% |
|
Intel’s Share of Growth |
0.92 |
0.92 |
0.92 |
0.92 |
||
|
Volume |
28.0% |
8.0% |
2.9% |
2.9% |
2.9% |
2.9% |
|
ASP |
-6.0% |
6.0% |
2.0% |
1.5% |
1.0% |
0.5% |
|
Revenue Growth % |
19.8% |
2.3% |
5.0% |
4.5% |
4.0% |
3.5% |
|
Revenues ($ mln) |
24,903 |
25,475 |
26,749 |
27,948 |
29,058 |
30,062 |
|
DCG Forecast |
2020 |
2021 |
2022F |
2023F |
2024F |
2025F |
|
Market Shipments (‘mln’) |
12.15 |
13.0 |
13.9 |
14.8 |
15.8 |
16.9 |
|
Market Shipment % |
3.4% |
6.7% |
6.9% |
6.9% |
6.9% |
6.9% |
|
Intel’s Share of Growth |
0.71 |
0.71 |
0.71 |
0.71 |
||
|
Volume |
11.0% |
2.0% |
4.9% |
4.9% |
4.9% |
4.9% |
|
ASP |
-3.0% |
2.0% |
3.0% |
2.5% |
2.0% |
1.5% |
|
Revenue Growth % |
7.5% |
-1.5% |
8.0% |
7.5% |
7.0% |
6.5% |
|
Revenues ($ mln) |
23,056 |
22,703 |
24,531 |
26,376 |
28,223 |
30,051 |
*c = a x b
e = [(1+c) *(1+d)] -1
Source: Intel, IDC, DigiTimes, Khaveen Investments
Overall, we factored in our analysis of its CPU performance to project its share of CPU unit growth and market share through 2025 in the chart below. In total, we forecasted its CCG desktop and notebook platform revenues to grow 6.7% and 5% respectively in 2022 as well as 7.9% for the DCG platform. This is also in line with the company’s Investor Day presentation guidance for CCG to grow at low to mid-single digits through 2026 and mid to high-single-digit for the DCG segment through 2023. Our projections differ from our previous analysis which was a negative mid-single digit in 2022 for desktops (-5.6%) and notebooks (-7.1%) due to our lower volume growth forecast in the previous projections of -8.9% (desktop) and -8.2% (notebook) as we assumed its market share to decline at a faster rate of 5.5% per year (desktop) and 10.4% (notebook). Whereas for DCG, our projections in 2022 are higher due to both a higher volume growth forecast of 4.9% to -0.3% and higher ASP growth of 3% compared to -2.8%. However, we note that Intel had performed above expectations with Q4 2021 desktop volume growing by 7% YoY and 8% for the full year while DCG volumes were up 17% YoY in Q4 and 2% for the full year. As a whole, Intel’s revenue beat analyst consensus by 6.7% in Q4 2021.
|
CCG and DCG Forecast 2022 |
CCG Desktop |
CCG Notebook |
DCG Server |
|
Previous Forecast |
|||
|
Volume Growth |
-8.9% |
-8.2% |
-0.3% |
|
ASP Growth |
3.6% |
1.2% |
-2.8% |
|
Overall Growth |
-5.6% |
-7.1% |
-3.1% |
|
New Forecast |
|||
|
Volume Growth |
2.8% |
2.9% |
4.9% |
|
ASP Growth |
3.8% |
2.0% |
3.0% |
|
Overall Growth |
6.7% |
5.0% |
8.0% |
Source: Khaveen Investments
PassMark, Khaveen Investments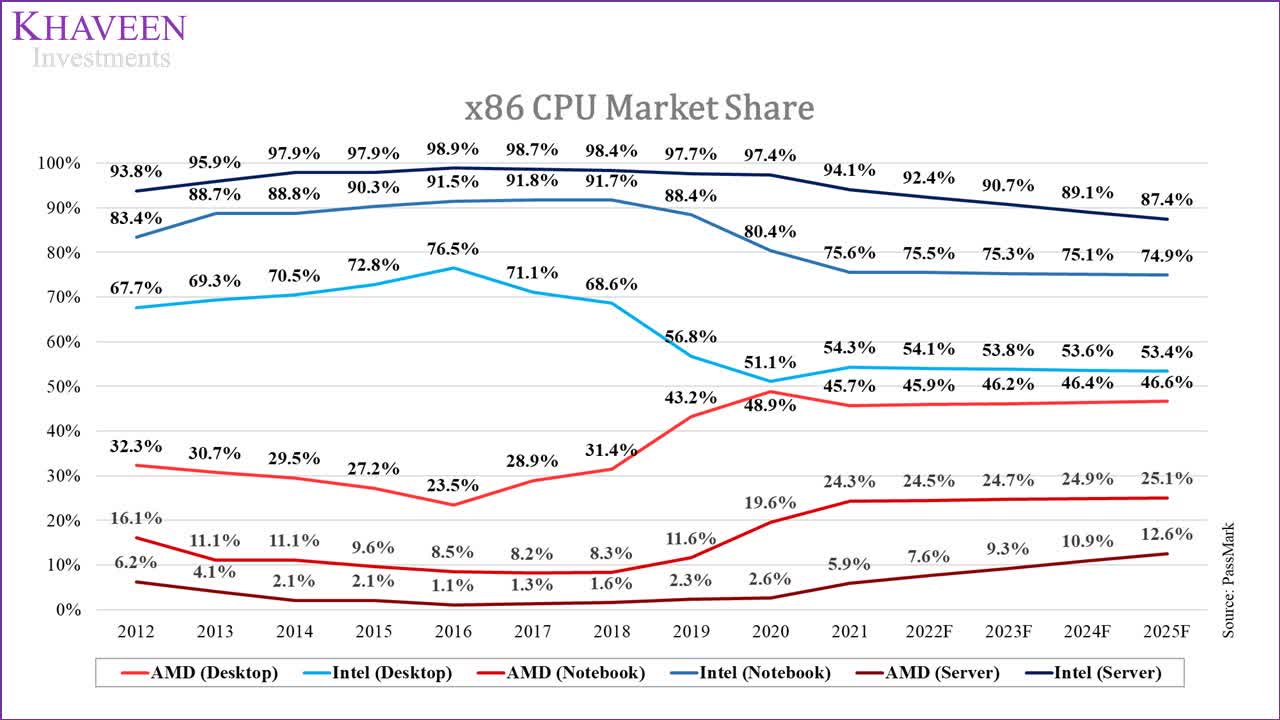
Global Semicon Market
Source: SIA, WSTS, Company Data, Khaveen Investments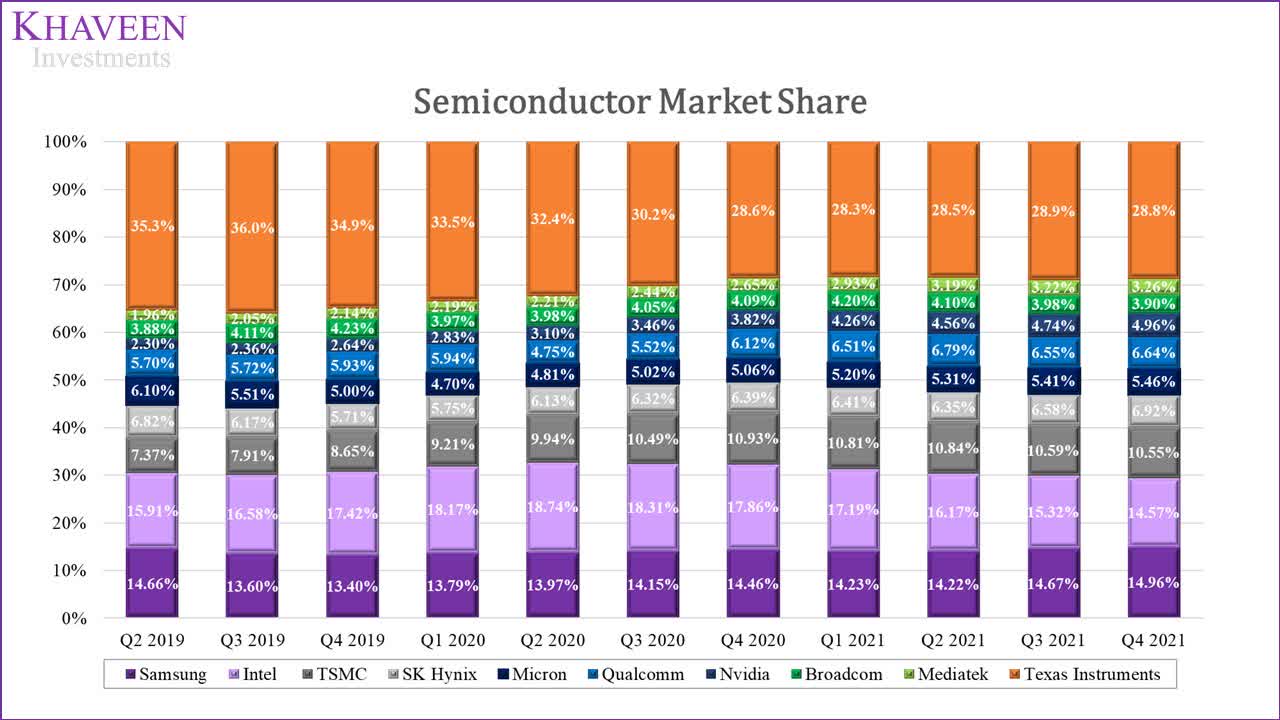
|
Position |
Semiconductor Market |
Revenue (‘TTM’) |
Average Historical Growth |
Subindustry |
Market |
Country |
|
1 |
Samsung (Semiconductor only) (OTC:SSNLF) |
81.1 |
2.4% |
Chipmaker/ Foundry |
Memory/Foundry/DAO |
South Korea |
|
2 |
Intel |
79.0 |
1.2% |
Chipmaker |
Logic |
USA |
|
3 |
TSMC (TSM) |
57.2 |
5.8% |
Foundry |
Foundry |
Taiwan (CHINA) |
|
4 |
SK Hynix |
37.6 |
2.5% |
Chipmaker |
Memory |
South Korea |
|
5 |
Qualcomm (QCOM) |
36.0 |
4.1% |
Chipmaker |
Logic |
USA |
|
6 |
Micron (MU) |
29.6 |
1.3% |
Chipmaker |
Memory |
USA |
|
7 |
Nvidia (NVDA) |
26.9 |
10.3% |
Chipmaker |
Logic |
USA |
|
8 |
Broadcom (Semiconductor only) (AVGO) |
21.2 |
2.1% |
Chipmaker |
Logic/DAO |
USA |
|
9 |
Texas Instruments (TXN) |
18.3 |
2.0% |
Chipmaker |
DAO |
USA |
|
10 |
Mediatek (OTCPK:MDTKF) |
17.7 |
7.5% |
Chipmaker |
Logic |
Taiwan (CHINA) |
Source: SIA, WSTS, Company Data, Khaveen Investments
Based on the market share of semiconductor sales above, the largest player in the semiconductor market is Samsung, overtaking Intel in Q3 2021. Compared to Intel and the rest, Samsung, as the largest company, is also the only company within both the foundry and chipmaker subindustry. It is also present in 3 semiconductor markets (memory, foundry and DAO). The next largest companies are TSMC, SK Hynix and Qualcomm while the smallest player is MediaTek. While Samsung is based in South Korea, most of the companies (6) within the top 10 are based in the US followed by Taiwan (China) and South Korea both with 2 companies in the top 10. Though, impressively for Intel, despite only being in the chipmaker subindustry and focused on logic products such as CPUs, its semiconductor sales are almost comparable to Samsung. One factor is the larger logic semiconductor market representing 42% of the market compared to the memory market at 32% and Intel’s high market share of 60.2% in 2021 in the total x86 CPU duopoly market based on PassMark.
Among the top 10 semicon companies, Intel fared the worst during the period as its growth was below the market average growth rate of 2.2%. It was also the only Logic chipmaker with growth below the market average and lost market share during the period. Besides Intel, the company with the next lowest growth rate of 1.3% was Micron which caters to the cyclical memory market. Meanwhile, Samsung maintained its market share growing almost in line with market growth. After Intel, TSMC is approaching its market position with superior growth compared to Intel. The chipmaker with the highest growth was Nvidia which focuses on GPU products compared to Intel and Qualcomm which is primarily focused on CPUs and application processors (AP) respectively. Unliked CPU and APs, GPUs are not necessarily installed and sold with the PC but exists as discrete and integrated forms. According to Jon Peddie Research, the penetration rate of dGPUs in PC is expected to increase to 42% over the next 5 years which indicates room for growth. Compared to chipmakers, foundries had a higher lowest growth rate which was Samsung whereas pureplay foundry player TSMC had a growth rate twice that of the average market growth rate.
|
Capacity Expansion |
Date Announced |
Expected Completion |
Investment ($ bln) |
|
Intel |
|||
|
Arizona |
2021 |
2024 |
20 |
|
New Mexico |
2021 |
– |
3.5 |
|
Ohio |
2022 |
2025 |
20 |
|
Malaysia |
2021 |
– |
7 |
|
Europe |
2022 |
2022-2031 |
EUR 80 |
|
TSMC |
|||
|
Arizona |
2020 |
2024 |
12 |
|
Japan |
2021 |
2024 |
8.8 |
|
China |
2021 |
2022 |
2.8 |
|
Samsung |
|||
|
Texas |
2021 |
2024 |
17 |
|
Texas Instruments |
|||
|
Texas |
2021 |
2025 |
30 |
Source: Intel, TSMC, Samsung, Texas Instruments
We compiled the expansion plans of the companies in the table above. For Intel, the company had planned to build new fabs in Arizona and Ohio as well as packaging facilities in New Mexico and Malaysia. It also recently unveiled its commitment towards European expansion with EUR80 bln for the next decade for fabs, packaging and R&D facilities. Whereas TSMC is expanding outside its home across the US, Japan and China while Samsung and Texas Instruments have new fab expansion plants in Texas.
Moreover, Intel along with AMD and TSMC are some of the companies which had halted shipments to Russia as the US government threatened to sanction companies doing business with Russia. The US government also previously introduced the Strategic Competition Act of 2021 aimed to reduce its supply chain dependency on China.
Overall, we conclude that while Intel was faced with a setback in the past year as it lost its crown to Samsung, the new market leader, we note several positive observations for the company’s growth trajectory based on our points above including:
- We expect Intel’s growth to accelerate and gain market share as it expands into the foundry market as the companies in the foundry subindustry have a higher growth rate than Intel
- Intel’s revenue mainly as a logic chipmaker alone is already comparable to Samsung, we believe its expansion to the foundry market could provide a boost to its size
- We believe the company’s aggressive expansion plans support its foundry market outlook by providing capacity growth for Intel as the industry is faced with supply constraints
- We expect Intel to continue facing headwinds in the logic semiconductor market as for CPUs as it faces strong competition from AMD and could weigh down on growth
Risk: PC Market Hit by Supply Shortage
Although Intel has several segments and various markets, it is still heavily exposed to the PC market as almost half of Intel’s revenues were derived from the PC market (47%) in 2021. The company could be exposed to the PC supply shortage risk as PC shipments declined in early 2022 due to supply constraints according to Citi with January 2021 shipments down 24% from the previous month. The firm forecasts notebook shipments to decline by 16% QoQ. According to Intel’s CEO in its latest earnings call, the company cautioned that its outlook could be affected by the supply shortage.
We expect results to be tempered by continued industry-wide component constraints, normal seasonality and PC notebook inventory burn as OEMs work through inventory imbalances created by ecosystem constraints that have limited their ability to ship systems in certain segments. – Pat Gelsinger, Chief Executive Officer
Thus, we believe that this could pose a risk to the company’s growth outlook in the near term as a large portion of its business is dependent on the PC market outlook. However, we note that Micron which also felt the impact of the PC market supply shortage on its business provided a positive outlook for the situation recovering throughout the year in its latest earnings call.
Valuation
We updated our revenue projection with the full year 2021 revenues. Further, we updated our revenue projections for its CCG and DCG segments based on our shipment and ASP forecasts for its desktop, notebook and server segments. For its other segments, we forecasted it based on market CAGR.
|
Revenue Forecast ($ mln) |
2020 |
2021 |
2022F |
2023F |
2024F |
2025F |
|
Client computing group |
40.06 |
40.50 |
42.82 |
45.15 |
47.41 |
49.57 |
|
Growth % |
7.8% |
1.1% |
5.7% |
5.4% |
5.0% |
4.6% |
|
Data center group |
26.1 |
25.81 |
27.93 |
30.10 |
32.30 |
34.51 |
|
Growth % |
11.2% |
-1.1% |
8.2% |
7.8% |
7.3% |
6.8% |
|
Internet of Things group (excluding Mobileye) |
3.01 |
3.998 |
4.597 |
5.286 |
6.077 |
6.988 |
|
Growth % |
-21.2% |
32.8% |
15% |
15% |
15% |
15% |
|
Mobileye |
0.967 |
1.386 |
1.929 |
2.686 |
3.738 |
5.204 |
|
Growth % |
10.0% |
43.3% |
39.20% |
39.20% |
39.20% |
39.20% |
|
Non-volatile memory solutions group |
5.36 |
4.306 |
0.00 |
0.00 |
0.00 |
0.00 |
|
Growth % |
22.9% |
-19.7% |
-100.0% |
– |
– |
– |
|
Programmable solutions group |
1.85 |
1.93 |
2.20 |
2.38 |
2.56 |
2.76 |
|
Growth % |
-7.0% |
4.5% |
14.0% |
7.8% |
7.8% |
7.8% |
|
All other |
0.52 |
1.068 |
1.068 |
1.068 |
1.068 |
1.068 |
|
Total Revenue |
77.87 |
79.00 |
80.56 |
86.67 |
93.15 |
100.10 |
|
Total Growth % |
8.2% |
1.5% |
2.0% |
7.6% |
7.5% |
7.5% |
Source: Intel, KPMG, Modor Intelligence, Khaveen Investments
As we expect the company to continue generating positive cash flows, we valued it with a DCF analysis with a terminal value based on a perpetual growth terminal value with the denominator based on its discount rate (7.5%) less a long-term growth rate assumption (2.8%). We factored in management’s capex guidance at $27 bln in 2022 in our cash flow forecast.
Intel, Khaveen Investments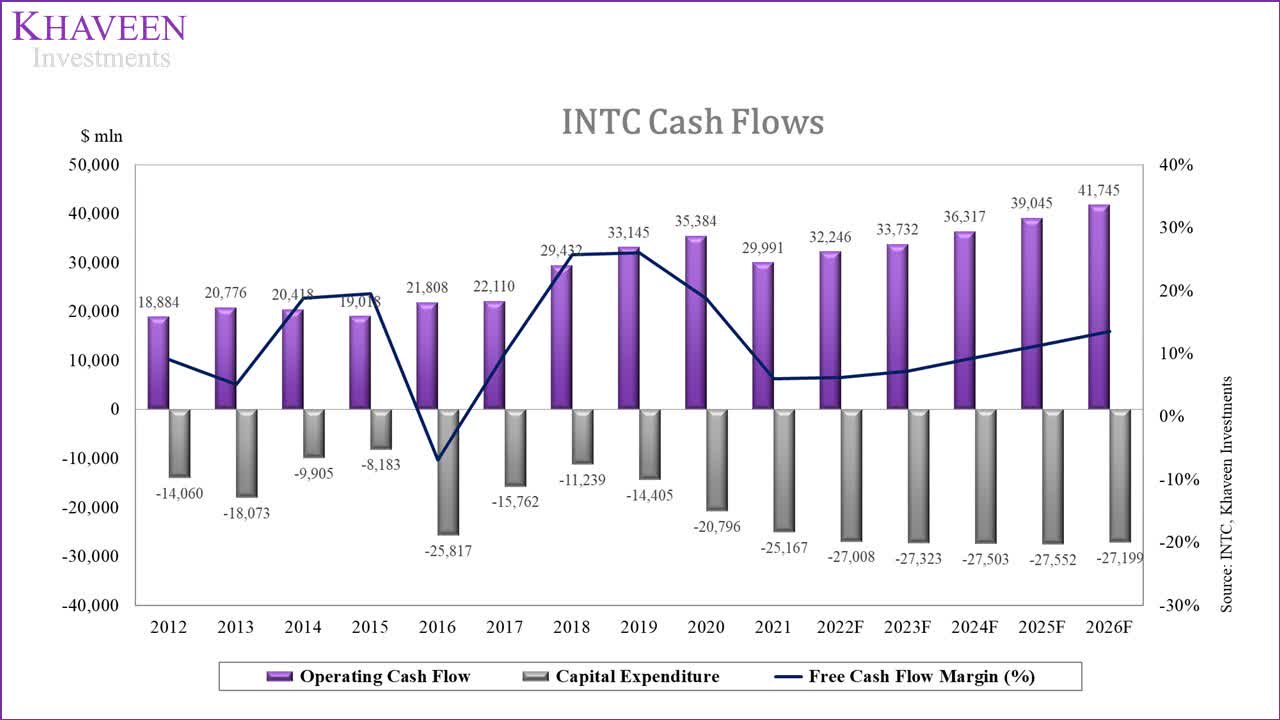
Based on a discount rate of 7% (company’s WACC), our model shows its shares are undervalued by 32%.
Khaveen Investments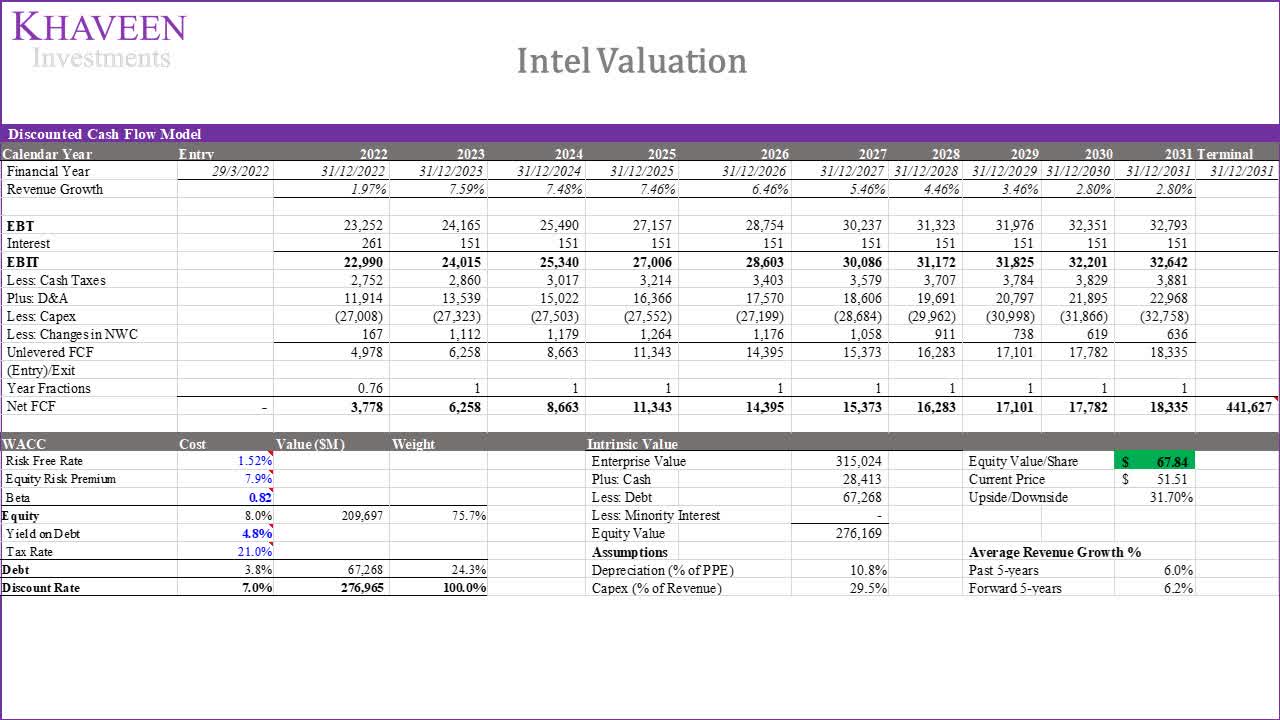
Verdict
To sum it up, we determined that despite its recent product launches with huge performance increases, Intel still lags behind fierce competitor AMD in terms of product performance by analyzing its average benchmark scores for a total of 232 CPU products where we found AMD leading across all of the desktop, notebook and server markets with higher average scores than Intel, implying a performance advantage for AMD. Based on this, we derived a weighted average growth factor and projected Intel’s share to continue decreasing in all categories but at a moderate rate compared to our previous analysis. In total, we revised our CCG (5.7%) and DCG (8.2%) revenue projections taking into account a higher volume growth projection for desktop, notebook and server segments. Lastly, we analyzed its market share at 14.5% in Q4 2021, placing it second behind Samsung. However, based on our analysis of the top 10 companies and capacity expansion, we believe Intel’s share could grow as it expands capacity aggressively amid the industry supply shortage. Overall, we rate Intel as a Strong Buy with a target price of $67.84.
Be the first to comment