

anyaberkut
A Quick Take On Instructure
Instructure (NYSE:INST) went public in July 2021, raising approximately $250 million in gross proceeds from an IPO that priced at $20.00 per share.
The firm provides learning management system software to various education markets worldwide.
INST’s relative performance has been far better than so many other software stocks over the past 12 months and the company appears positioned for further growth and progress toward positive earnings.
My outlook on INST is a Buy at $22.00 per share.
Instructure Overview
Salt Lake City, Utah-based Instructure was founded to develop a learning management system for global learning administration to create learning efficiencies for both K-12 and higher education & continuing education markets.
The company originally went public in 2015 and was taken private by Thoma Bravo in 2020.
Management is headed by Chief Executive Officer Steve Daly, who has been with the firm since July 2020 and was previously CEO of Landesk/Ivanti, an IT management and security software company.
The company’s primary offerings include:
-
Canvas LMS
-
Canvas Studio
-
Canvas Catalog
-
Assessments
-
Portfolium
-
Canvas Network
The firm seeks customer relationships with schools and school districts in the U.S. and core international markets.
Instructure’s Market & Competition
According to a 2020 market research report by Technavio, the U.S. market for e-learning is forecast to grow by over $21 billion from 2020 to 2024.
This represents a forecast CAGR of 9.8% from 2020 to 2024.
The main drivers for this expected growth are increased consumer demand for more cost-efficient and time-flexible learning programs available on multiple devices rather than having to go to a physical classroom.
Also, the high adoption of mobile devices and the reduction in the cost of Internet bandwidth make the entry cost for consumers lower than in previous years.
Major competitive or other industry participants include:
-
Blackboard
-
D2L
-
Moodle
-
Schoology
-
Cengage Learning
-
Others
Instructure’s Recent Financial Performance
-
Total revenue by quarter has grown according to the following chart:
9 Quarter Total Revenue (Seeking Alpha)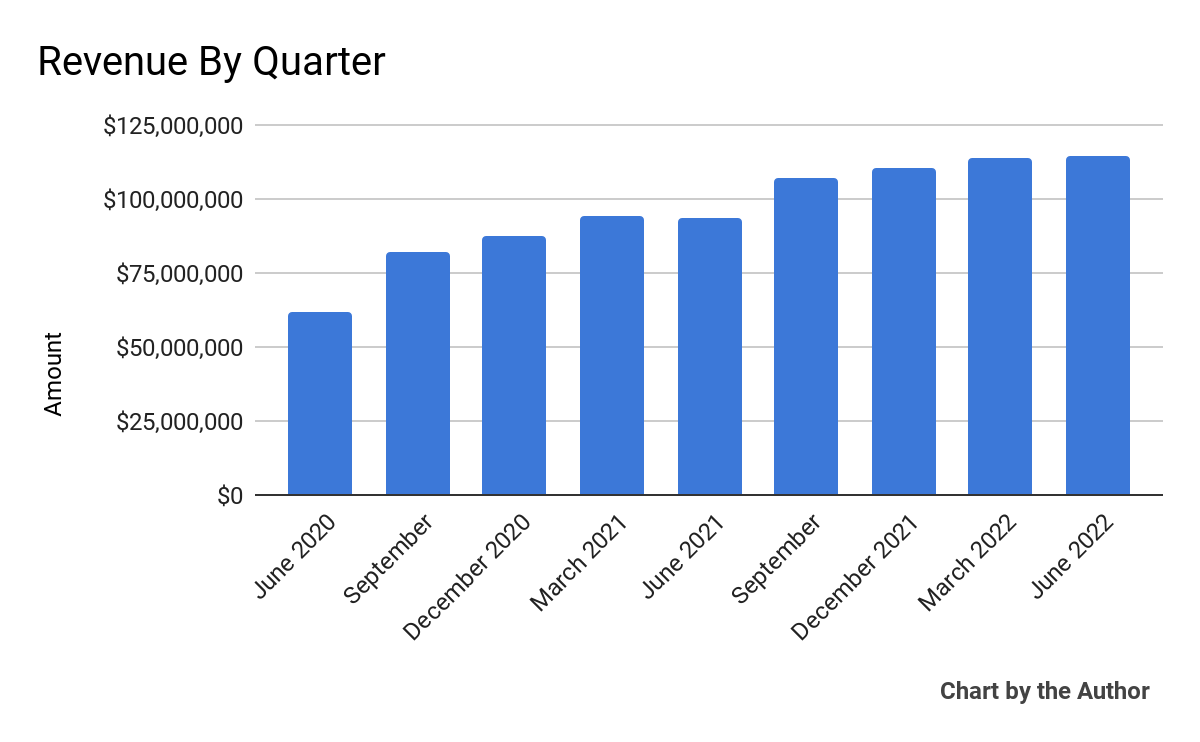
-
Gross profit by quarter has produced a similar trajectory as total revenue:
9 Quarter Gross Profit (Seeking Alpha)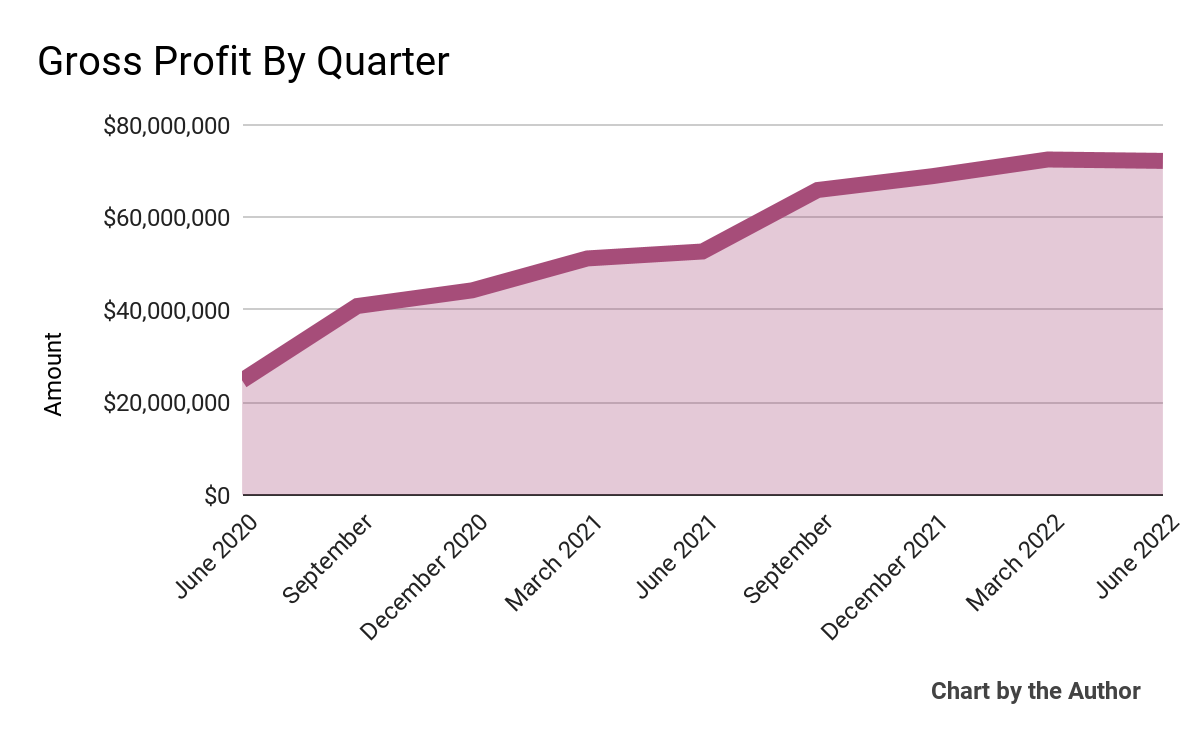
-
Selling, G&A expenses as a percentage of total revenue by quarter have remained relatively stable in recent quarters:
9 Quarter Selling, G&A % Of Revenue (Seeking Alpha)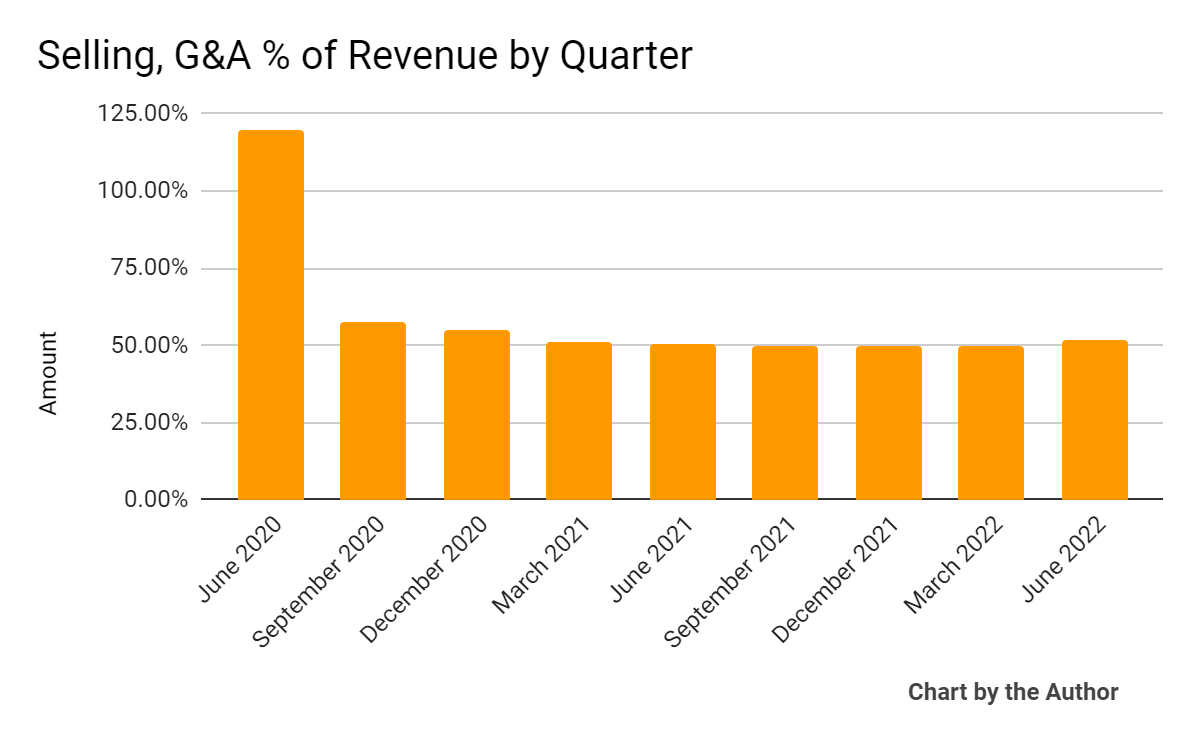
-
Operating losses by quarter have lessened, as the chart shows below:
9 Quarter Operating Income (Seeking Alpha)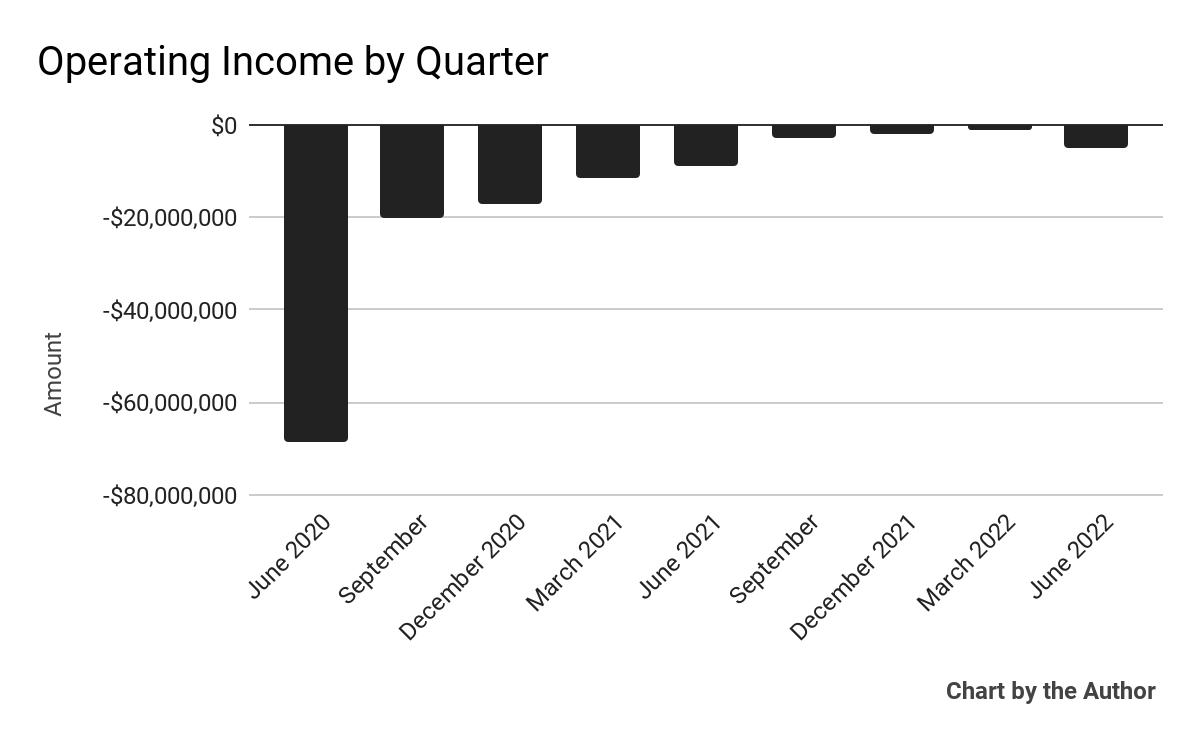
-
Negative earnings per share (Diluted) have also generally improved:
9 Quarter Earnings Per Share (Seeking Alpha)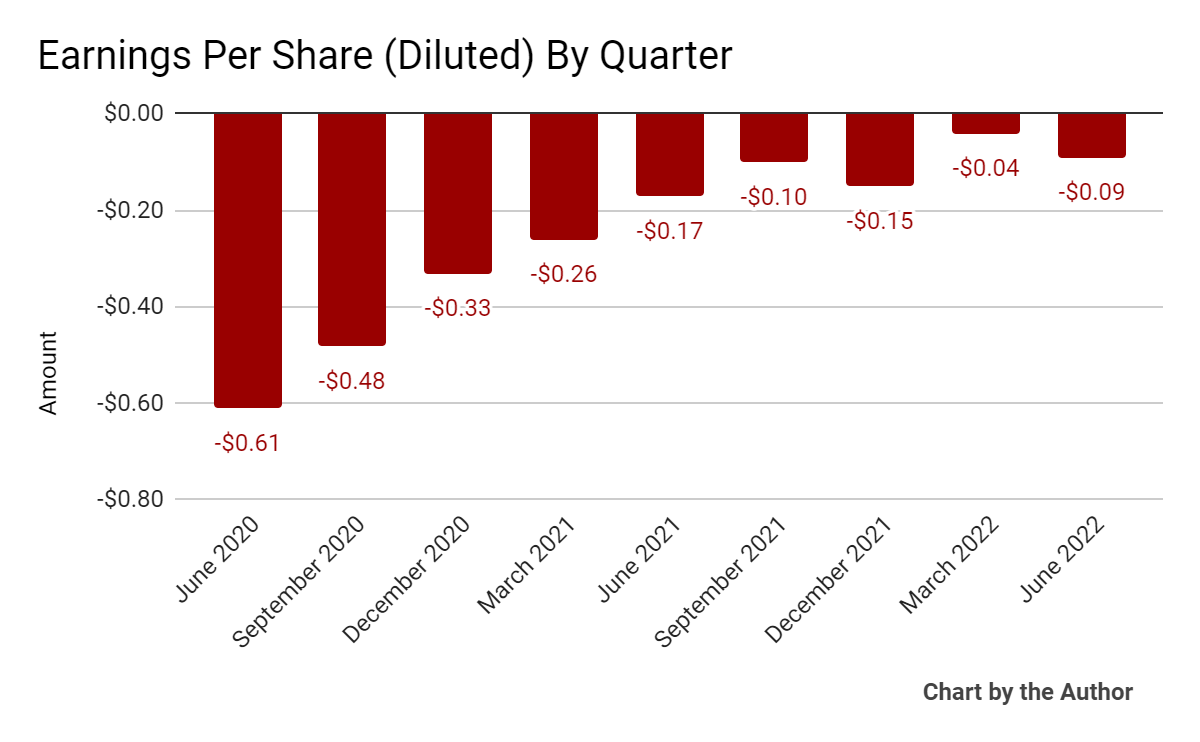
(All data in above charts is GAAP)
Since its IPO, INST’s stock price has dropped 0.6% vs. the U.S. S&P 500 index’s fall of around 17.3%, as the chart below indicates:
52 Week Stock Price (Seeking Alpha)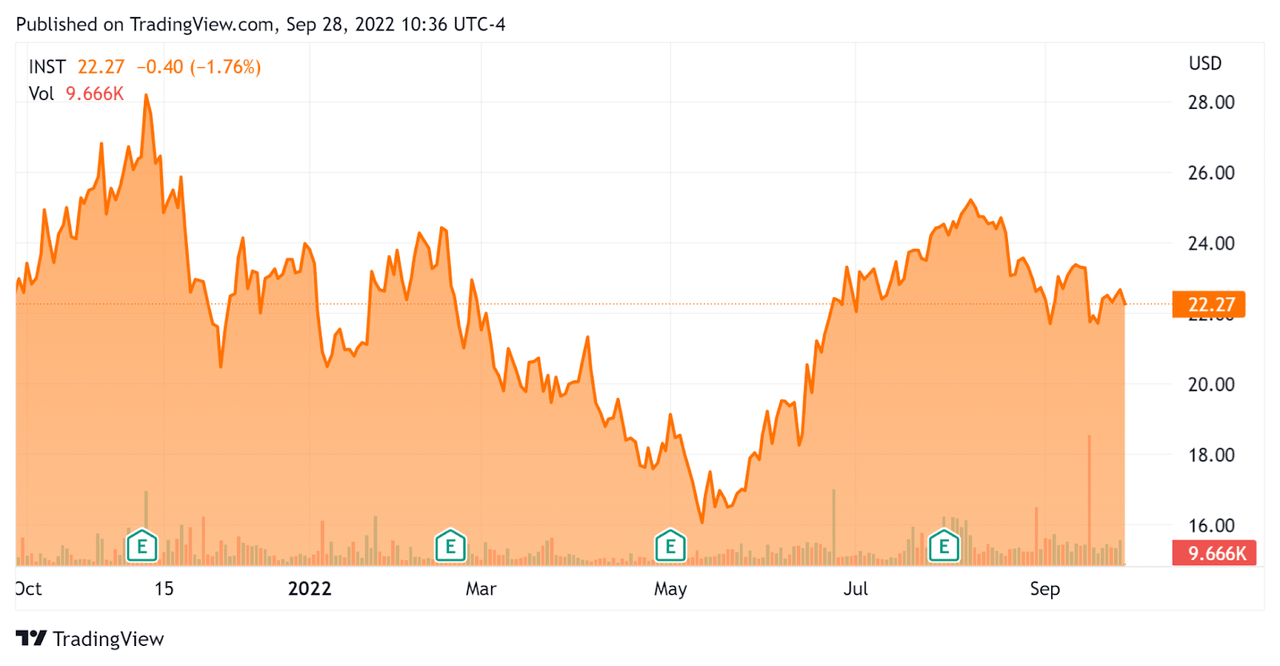
Valuation And Other Metrics For Instructure
Below is a table of relevant capitalization and valuation figures for the company:
|
Measure [TTM] |
Amount |
|
Enterprise Value / Sales |
8.13 |
|
Revenue Growth Rate |
24.9% |
|
Net Income Margin |
-11.8% |
|
GAAP EBITDA % |
28.4% |
|
Market Capitalization |
$3,190,000,000 |
|
Enterprise Value |
$3,620,000,000 |
|
Operating Cash Flow |
$99,970,000 |
|
Earnings Per Share (Fully Diluted) |
-$0.38 |
(Source – Seeking Alpha)
The Rule of 40 is a software industry rule of thumb that says that as long as the combined revenue growth rate and EBITDA percentage rate equal or exceed 40%, the firm is on an acceptable growth/EBITDA trajectory.
INST’s most recent GAAP Rule of 40 calculation was 53.3% as of Q2 2022, so the firm has performed well in this regard, per the table below:
|
Rule of 40 – GAAP |
Calculation |
|
Recent Rev. Growth % |
24.9% |
|
GAAP EBITDA % |
28.4% |
|
Total |
53.3% |
(Source – Seeking Alpha)
Commentary On Instructure
In its last earnings call (Source – Seeking Alpha), covering Q2 2022’s results, management highlighted exceeding financial guidance since its IPO while continuing strong R&D investment and making three acquisitions with the goal of expanding its addressable market.
Also, management has placed significant focus on its international growth strategy through a channel partner approach.
Leadership also hinted at creating ‘further shareholder value going forward,’ which to my mind may include a stock buyback program from its expected free cash flow.
As to its financial results, revenue rose 22% year-over-year while producing non-GAAP gross margin of 77.6%, a 3.9% increase.
Management did not disclose the company’s net dollar retention rate, which provides visibility into its product/market fit and sales & marketing efficiency.
However, the firm’s Rule of 40 results have been impressive.
Sales and marketing and G&A expenses rose somewhat as a percentage of allocated combined receipts [ACR], while R&D expenses dropped slightly against ACR. Negative earnings increased sequentially.
For the balance sheet, the firm finished the quarter with $87.6 million in cash, equivalents and restricted cash. It had $492.5 million in long-term debt, which is considerably less than the $772.4 million at the end of Q1 2021.
Over the trailing twelve months, free cash flow was an impressive $94.2 million.
Looking ahead, management raised its full year ACR revenue guidance to a growth rate of 14% at the midpoint of the range. Adjusted EBITDA margin is expected to be 36.2% at the midpoint.
Regarding valuation, the market is valuing INST at an EV/Sales multiple of around 8.13x.
The SaaS Capital Index of publicly held SaaS software companies showed an average forward EV/Revenue multiple of around 6.8x at August 31, 2022, as the chart shows here:
SaaS Capital Index (SaaS Capital)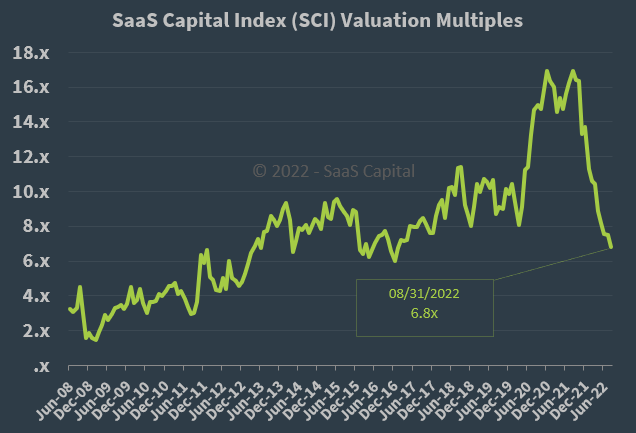
So, by comparison, INST is currently valued by the market at a premium to the broader SaaS Capital Index, at least as of August 31, 2022.
The primary risk to the company’s outlook is an increasingly likely macroeconomic slowdown or recession, which may slow sales cycles and reduce its revenue growth trajectory.
A potential upside catalyst to the stock could include a stronger sales environment due to the still untapped amounts of the U.S. Federal ESSER legislation funding, which totaled $141 billion as of May 31, 2022. 25% of ESSER funds have apparently been earmarked for technology expenditures.
While INST hasn’t yet reached operating breakeven, management has made significant progress in that regard while substantially reducing long-term debt and increasing its focus on international growth opportunities through channel partners.
INST’s relative performance has been far better than so many other software stocks over the past 12 months and the company appears positioned for further growth and progress toward positive earnings.
My outlook on INST is a Buy at around $22.00 per share.
Be the first to comment