

gguy44/iStock via Getty Images
Investment Thesis
On September 16, 2022, the VictoryShares US EQ Income Enhanced Volatility Weighted ETF (NASDAQ:CDC) underwent one of its semi-annual reconstitutions, swapping 25 holdings in favor of Financials and to the detriment of Consumer Staples and Utilities. CDC remains defensive, but just not as much as before, and unfortunately, it takes some of the allure away for me. However, CDC is now superior in sales, earnings, and dividend growth and has a chance at distributing a 4% annualized yield this quarter. These are reasonable compromises, so I’ve decided to maintain my buy rating, and I look forward to explaining why in greater detail below.
CDC ETF Overview
Strategy
CDC tracks the Nasdaq Victory U.S. Large Cap High Dividend 100 Long/Cash Volatility Weighted Total Return Index, ultimately selecting 100 high-yielding large-cap stocks and inversely weighting them by 180-day price volatility. The entire process is as follows:
- The Index screens the largest 500 U.S. equities, except REITs, and eliminates those without four consecutive profitable quarters.
- The highest-yielding 100 stocks are selected and inversely weighted by their 180-day standard deviation of price returns.
- Sector exposures are limited to 25%
- Reconstitutions are in March and September
The selection process is straightforward enough, effectively ensuring a solid level of profitability and a defensive lean. However, CDC adds a layer of downside protection by reallocating to 75% cash when the Index is down 8% from its All-Time Highest Daily Closing Value. I’ve discussed this strategy in previous articles, including my last review when I tested it over twenty years. I concluded that one could only expect the method to work about half the time, but it should help reduce the most extreme losses. Nevertheless, CDC will be 100% long most of the time, so discussing its fundamentals is probably the best plan for today’s analysis.
Sector Exposures and Top Holdings
Many readers like to compare CDC with the Schwab U.S. Dividend Equity ETF (SCHD). I think of them as good compliments. SCHD overweights Technology and Industrials, while CDC picks up the slack on Utilities. There’s usually about a 25% overlap in weight between the two, so it’s a good use of capital if you’re looking to corner the high-dividend U.S. equity market.
Morningstar
CDC’s top ten holdings are all Health Care and Utilities stocks. They include Bristol-Myers Squibb (BMY), Merck & Co. (MRK), Duke Energy (DUK), and Dominion Energy (D). These four stocks have five-year betas of 0.42, 0.34, 0.35, and 0.42, but don’t let that fool you. There are plenty of newcomers this month further down the holdings list with betas over 1.20, including Fifth Third Bancorp (FITB), Advance Auto Parts (AAP), and Eastman Chemical (EMN).
VictoryShares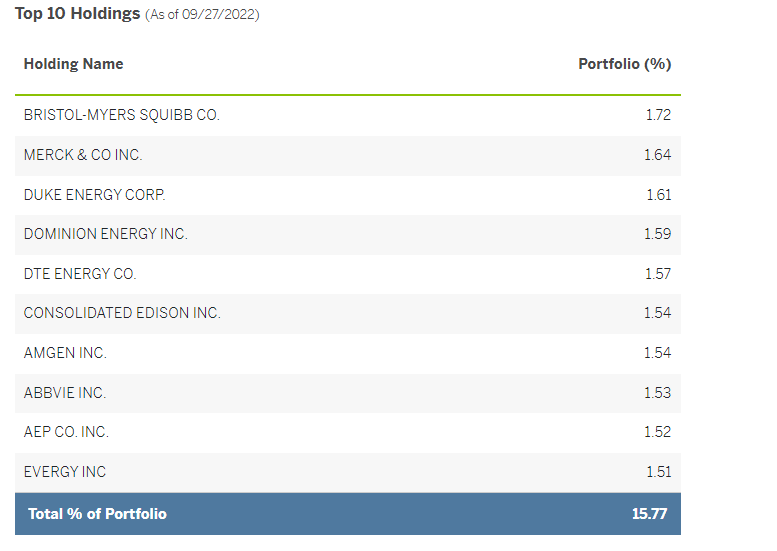
Reconstitution Summary
There were 25 additions this month, summarized by sector below:
- Communication Services: Comcast (CMCSA)
- Consumer Discretionary: Ford Motor (F), Advance Auto Parts, Garmin
- Energy: Pioneer Natural Resources (PXD), Devon Energy (DVN)
- Financials: Bank of New York Mellon (BK), Northern Trust (NTRS), Ares Management (ARES), Carlyle Group (CG), Ally Financial (ALLY), PNC Financial Services (PNC), Fifth Third Bancorp
- Health Care: Medtronic (MDT), Viatris (VTRS)
- Industrials: UPS (UPS), Stanley Black & Decker (SWK)
- Materials: International Flavors & Fragrances (IFF), Eastman Chemical
- Technology: Juniper Networks (JNPR), Corning (GLW), Seagate Technology (STX), HP (HPQ)
- Utilities: PPL (PPL), NRG Energy (NRG)
The 25 deletions were:
- Consumer Discretionary: Genuine Parts (GPC), Whirlpool (WHR)
- Consumer Staples: General Mills (GIS), J. M. Smucker (SJM), PepsiCo (PEP), Coca-Cola (KO)
- Energy: Marathon Petroleum (MPC)
- Financials: Apollo Global Management (APO), Lincoln National (LNC), Allstate (ALL), CNA Financial (CNA), Webster Financial (WBS)
- Health Care: Cardinal Health (CAH), Johnson & Johnson (JNJ)
- Industrials: Cummins (CMI)
- Materials: Air Products and Chemicals (APD)
- Technology: Texas Instruments (TXN), NetApp (NTAP)
- Utilities: Xcel Energy (XEL), Alliant Energy (LNT), Eversource Energy (ES), CMS Energy (CMS), WEC Energy Group (WEC), Ameren (AEE), Sempra Energy (SRE)
These changes were driven mainly by dividend yield rather than volatility. The average dividend yield of the additions is 3.79%, compared to 3.11% for the deletions. Meanwhile, the average five-year beta for the additions is 1.18 compared to 0.84 for the deletions.
The Index removed household name stocks like Coca-Cola, PepsiCo, and Johnson & Johnson in favor of several Asset Management & Custody Bank stocks like Northern Trust and Ares Management. These changes were alarming, with a potential recession around the corner. However, before making any judgments, let’s see how the fundamentals of the new and old portfolios look.
CDC Fundamental Analysis
The following table highlights selected fundamental metrics for CDC’s top 25 industries. It helps illustrate the tradeoffs, which seem to be safety and momentum in favor of growth, value, and yield.
The Sunday Investor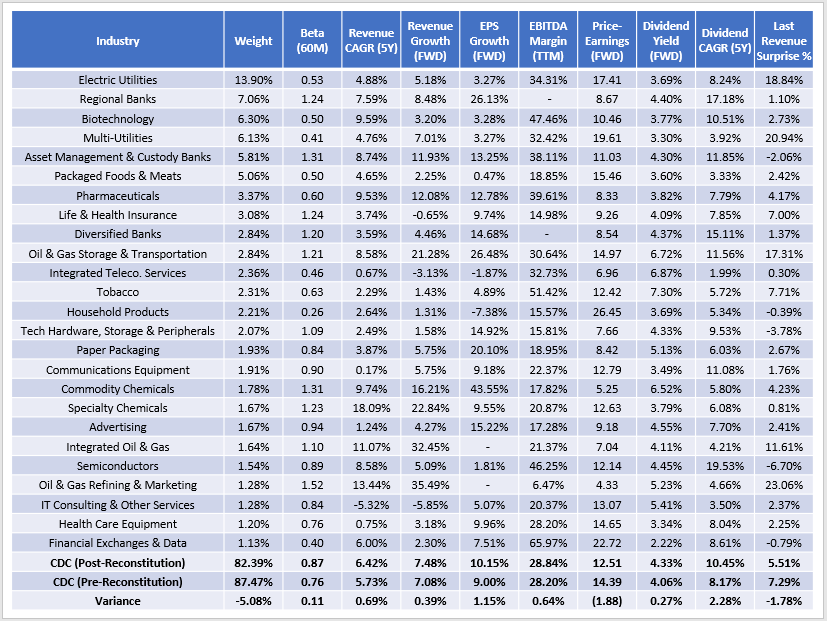
Key Negatives: Added Volatility, Less Momentum
Electric and Multi-Utilities still make up 20% of the ETF, which will offer investors excellent exposure to a sector I’m still bullish on. Still, the seven deleted Utilities stocks averaged a solid 2.90% dividend yield, a 0.41 five-year beta, and had price returns averaging 7.42% over the last year. I wouldn’t have removed them, but that’s what investors sign up for when buying rules-based ETFs. As a result, CDC’s 0.87 five-year beta is near the average for the dividend category (0.92) and high for the low-volatility category (0.81). In short, CDC likely won’t offer the same level of downside protection we’ve seen previously. It’s evident when looking at backtested results of the current portfolio and the previous portfolio.
Portfolio Visualizer
As shown, the current portfolio gained an annualized 8.57% per year vs. 9.83% for the portfolio pre-reconstitution. These results aren’t surprising because yield and price are inversely related. However, it’s the added volatility that caught my eye. The current portfolio experienced annualized volatility of 14.49% compared to 12.98% for the pre-reconstitution portfolio and 12.76% for the ETF. The current portfolio also would have lost 25.65% in Q1 2020. Now, there’s always a chance CDC would move to 75% cash before such a crash occurs, but since the Index only evaluates its position monthly, the timing might not work out so well the next time.
The other key negative is the loss of momentum, measured by the lower last quarterly revenue surprise figure (5.51% vs. 7.29%). Again, this is due to lower Utilities sector exposure. According to Yardeni Research, large-cap Utilities stocks had a 16.3% sales surprise in Q2, more than double Energy (7.3%) and almost 14% better than the S&P 500 Index. Year-over-year sales growth was 16.9%, and 93.1% of companies had a positive surprise.
Yardeni Research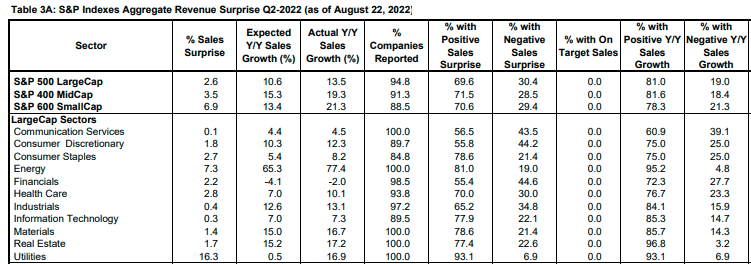
In my view, it’s important not to reduce the sector to a simple matter of evaluating its yield relative to ten-year treasuries. It’s so much more complex than that. These sales surprise figures help explain why the Utilities Select Sector SPDR ETF (XLU) is the second-best-performing large-cap sector ETF this year (behind XLE), despite offering a lower yield than U.S. treasuries.
Key Positives: Better Growth and Valuation, 4% Yield
The following table highlights the same metrics as earlier for CDC’s top 25 companies. These holdings total 36.15%, and this time, I want to focus on three areas of improvement: more substantial growth, lower valuation, and a potential 4% net dividend yield.
The Sunday Investor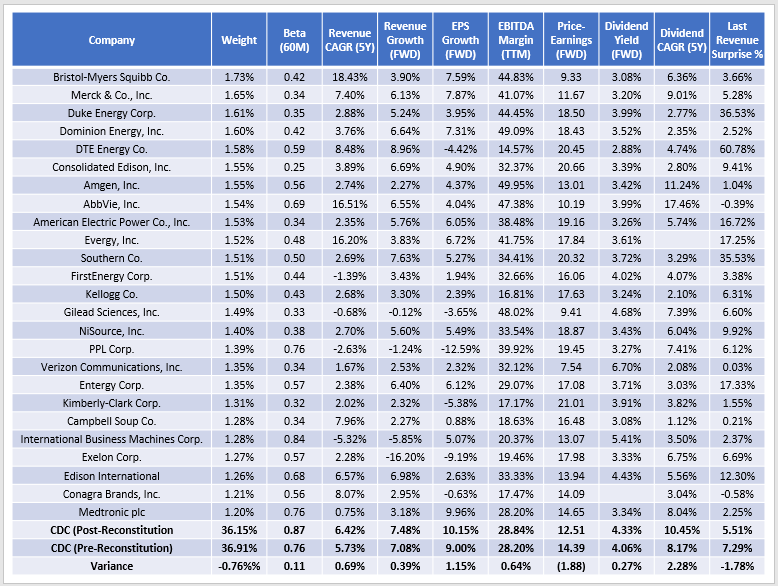
First, CDC’s current constituents have raised sales by an annualized 6.42% over the last five years compared to 5.73% previously. Estimated sales and earnings growth are about 0.50-1% higher, and EBITDA margins are about the same at 28.84%. The current portfolio trades at just 12.51x forward earnings, one of the lowest in the dividend ETF space today. These depressed valuations seem mostly the result of lower prices rather than higher earnings forecasts. Current portfolio constituents have lost 16.70% over the last six months compared to 11.29% for the previous portfolio. Furthermore, the current portfolio’s Seeking Alpha EPS Revisions Score is only 5.20/10 compared to 5.77/10 before. The lower valuation is nice but reflects this negative sentiment on Wall Street more than anything.
Second, prospective investors have another reason to consider buying CDC: a shot at a 4% dividend yield. Current constituents yield 4.33% based on September 27 prices, and after the 0.35% expense ratio is subtracted, the 4% figure isn’t out of the question. Although most high-payers aren’t top holdings at the moment, 50 companies (45% of the weight) currently yield above 4%, and 38 companies (34% of the weight) pay above 4.50%. Most are in the Financials sector and represent the tradeoff between safety and yield. Here’s a sample of six holdings across five industries, showing strong dividend consistency, growth, and a payout ratio below 50%.
Seeking Alpha
Overall, CDC’s payout ratio is 50.40%, which is excellent considering how many capital-intensive Utilities stocks it still holds. The average payout ratio in this sector is 66.34%.
Investment Recommendation
CDC’s latest reconstitution resulted in a less-defensive and more volatile portfolio, making it less of a “unicorn” fund in the dividend and low-volatility ETF space. By swapping safe, positive-momentum Utilities and Consumer Staples stocks for riskier plays in the Financials sector, it’s a bet that markets are close to bottoming. That could be the case, but I was alarmed at how much it changed the portfolio’s profile. CDC’s five-year beta jumped 11 points to 0.87 and doesn’t stand out as much as before.
However, these negatives are offset by more robust sales, earnings, and dividend growth, and better diversification at the industry level. Plus, CDC now has a chance of distributing a 4% annualized dividend yield this quarter, a figure that hasn’t been challenged since March 2020. These are great reasons to own, and why, after much back and forth, I’ve decided to maintain my buy recommendation on CDC. Thank you for reading, and I look forward to discussing more in the comments section below.
Be the first to comment