

dseignerx6/iStock via Getty Images
By John R. Mousseau, CFA
Muni Update, First Quarter 2022The first quarter of 2022 is ending in the largest bond market sell-offs since 1994.
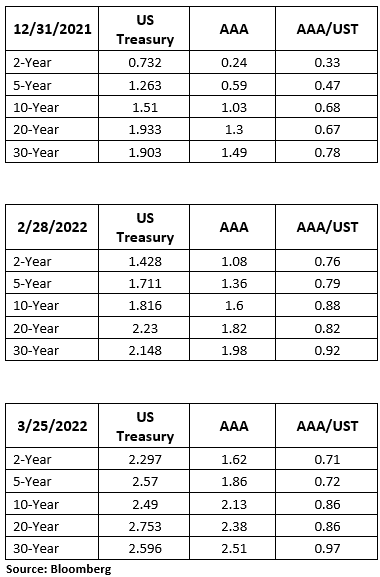
Below is a comparison of AAA tax-free yields and the respective US Treasury yields. As you can see, the yield ratios are a touch cheaper than they were at the end of the second quarter but are still rich by historical standards.
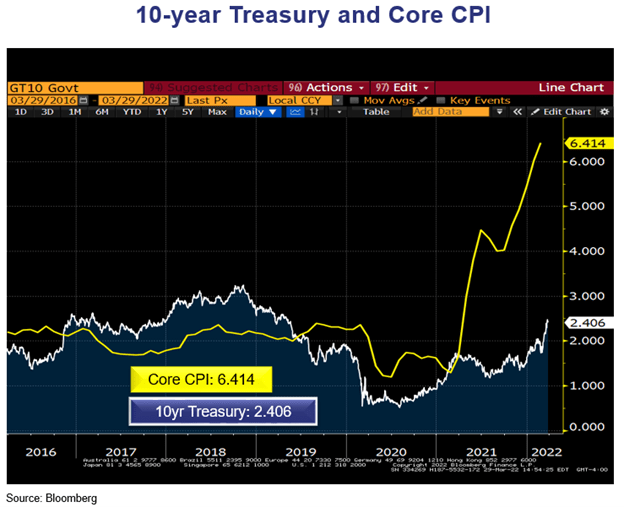
The sharp uptick in yields has been a response to both the uptick in inflation and the Federal Reserve’s beginning to raise short-term interest rates.
There are several points to note from the chart:
- The rise in overall yields has been very sharp, as is seen in both US Treasury as well as tax-free muni yields.
- The acceleration upward has been very sharp since the end of February, with 70% of the rise in the 10-year US Treasury yield since year end occurring in March.
- A similar acceleration is reflected in tax-free yields, and it has been sharper. Note the rise in the muni/Treasury yield ratios since the start of the year, with the 10-year muni/Treasury ratio moving from 68% to 86% and the 30-year ratio moving from 78% to 97%.
- Remember this is an AAA scale. Many longer muni bonds are trading MUCH cheaper – in mid to high 3% levels and some deep discounts near 4% levels. This is very cheap from a relative value standpoint.
- Some of the biggest change in yield ratios is on the short end, where levels had become extremely low (witness the 2-year and 5-year ratios on Dec 31). At those ratios, it was uneconomic to own munis in the AAA range – better to buy Treasuries and pay the federal tax. This extreme valuation happens rarely and was most likely reflecting a potential hike, which now seems to be unlikely, in the federal marginal tax rate.
The Federal Reserve has begun to tighten short-term interest rates with a hike in the Federal funds target rate from 0%–0.25% to 0.25%-0.5%. What has spooked the bond market is the Fed’s language suggesting a resolve to keep hiking rates to reduce inflation expectations, which have risen significantly as outright inflation has also risen. This rise in yields is producing the worst quarter for bonds since 1994.
Below are three graphs – one showing the federal funds target rate going back 30 years, the next showing the 10-year bond yields going back 30 years, and then the combination of the two graphs.
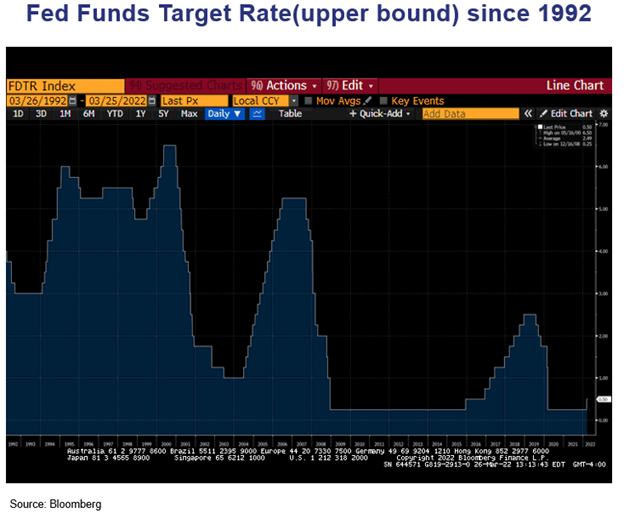
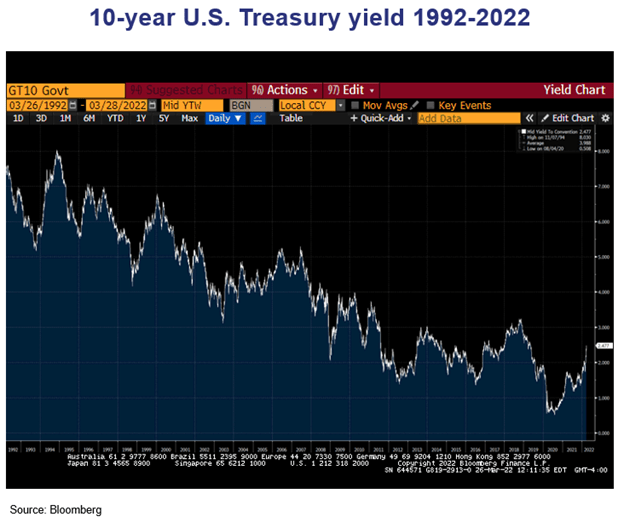
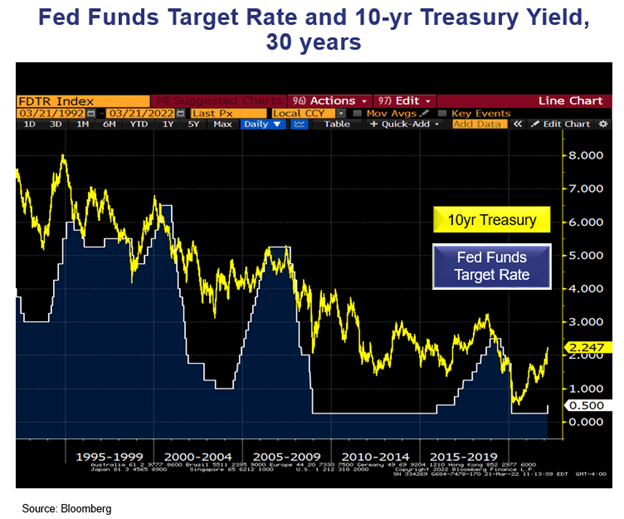
As you can see, in 1994, the Fed started to raise the Fed funds target early in the year and longer-term interest rates began to rise. This year, longer-term interest rates began to rise well before the Fed instituted their first hike earlier this March. We don’t think this is as much the market front-running the Federal Reserve as it is a reversion to the mean after Covid. The low in the 10-year bond yield intraday was 0.3 in March of 2020, and the lowest end-of-day yield was 0.5 in August of 2020. Though rates have moved up sharply since then, it’s important to remember that since the start of 2020 – just before the onset of the pandemic – the 10-year bond yield was 1.9%. So, when compared to that, a 60-basis-point rise in rates seems more reasonable, particularly given that inflation has risen (though we also think we will see some retreat in inflation later in the year). What is also important is that the absolute low level of bond yields is also causing the volatility because of the longer duration of these lower coupons.
For example, the duration of a 5%, 30-year bond at par is roughly 15. The duration of a 2%, 30-year bond issued at par is approximately 22. So same maturity, but the 2% bond is more vulnerable in price. This means that if the bond yield goes from 5% to 6%, the approximate loss on the 5% bond is 14 points, less whatever the coupon pays during that period. With a 2% bond moving to 3%, the loss is approximately 20 points, less a smaller amount of coupon income for the same period.
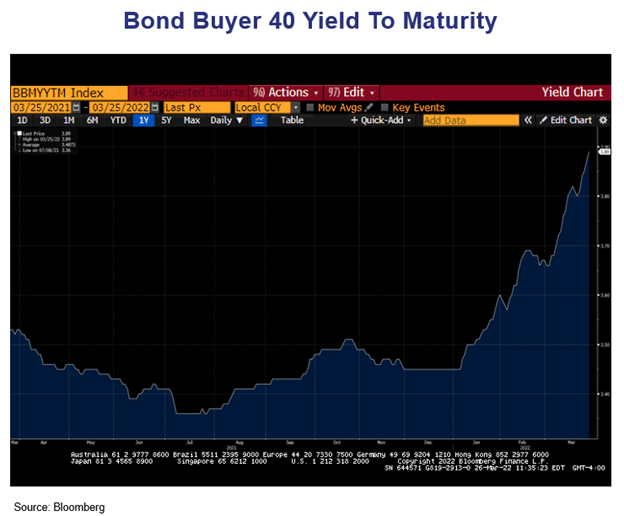
Our belief is that current yield levels, particularly in muni bonds where high-grade bonds are approaching 4%, represent a level at which to extend maturities and durations in portfolios.
The relative value of a near-4% muni versus a 2.60% is hard to overstate at over 150%. At those levels, the backoff (from these levels) should be slower as ratios revert to the mean. But if past bond markets are a guide, intermediate-to-longer-term interest rates begin to peak while the Fed is in the middle of their hiking cycle. And as the graph showed us, the bond market started rising in yield well before the Fed started hiking this month.
There is no doubt that we have witnessed a sharp rise in inflation – particularly relative to bond yields.
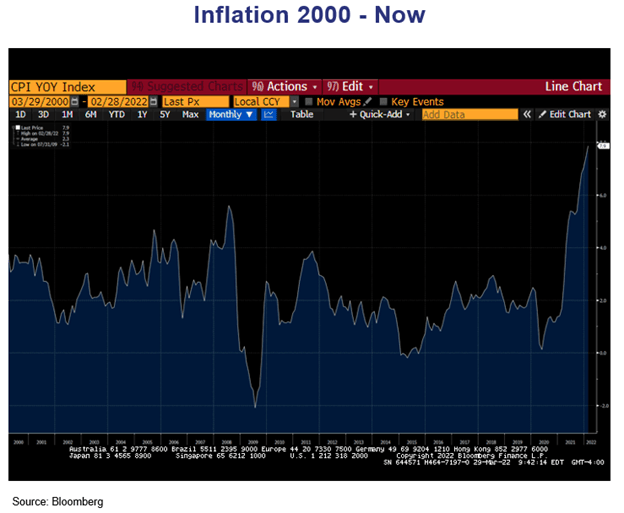
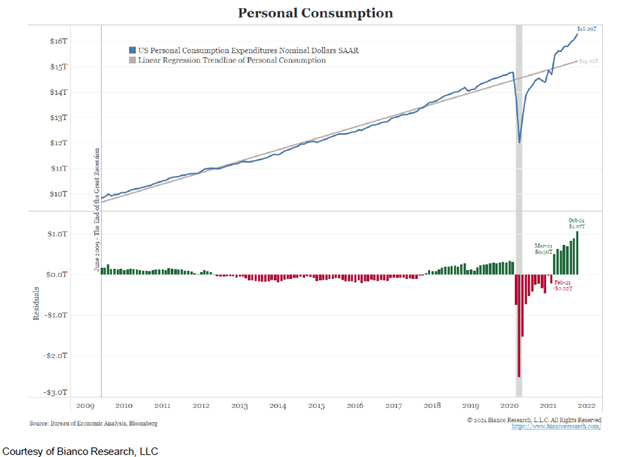
Our belief is that this inflation is directly related to the pandemic, the federal government’s fiscal stimulus producing a rise in consumer demand, and the supply chain constrictions that followed.
We are starting to see some signs that inflation may be starting to slow.
The Core Producer Price Index last week printed at 0.2% for the month of February. This was versus an expectation of 0.6%.
Existing home sales were down -7.2% versus an expectation of -6.2%, and this compares to +6.7% in January.
Higher interest rates will start to crimp the affordability of mortgages and are already having an impact on refinancing activity.
Durable goods orders in February were down -2.2% versus an expectation of -0.6%.
There are other examples, but our models generally tell us that when you have a combination of negative return on bonds, combined with deeper negative return on an after-inflation basis (and that is what we have), then it is usually the time to start buying some longer-dated paper, extending durations, and to begin to position portfolios to benefit when interest rates inevitably turn down. The level of queasiness usually correlates with the opportunity that’s presented.
Editor’s Note: The summary bullets for this article were chosen by Seeking Alpha editors.
Be the first to comment