

Ridofranz/iStock via Getty Images
Especially over the last two decades, investing has become an apparent no-brainer. The S&P 500 index (SPY) has been propelled to its current all-time high, mostly due to easy monetary policy and low interest rates, persistently low inflation, and the 2018 corporate tax cut. The great financial crisis marked the beginning of probably the strongest bull market in modern history, as can be noticed from the S&P 500’s 16% annualized rate of return between March 2009 and March 2022. With technological advances, investing has also become much cheaper, and industry behemoths such as Vanguard or BlackRock (BLK) have increasingly been offering low-cost index-tracking funds to the public, which are commonly known as exchange-traded funds (ETFs).
As it seems, it has become commonplace to put ones retirement investment on “autopilot”, by making monthly deposits into accumulating ETFs, watching the snowball grow and finally retiring at the age of 65 by applying the well-known 4%-rule, which can be adapted to a little higher percentage to account for the increasing life expectancy. Individual stock risk is practically switched-off, as the index contains only the largest companies in terms of market capitalization, making this strategy appear to be very low-risk. At times, ETFs are even touted as a modern replacement for bank deposits or savings accounts. I will not go into detail why this is a highly flawed and particularly dangerous comparison.
The retirement strategy of investing in an accumulating index fund assumes that markets move up and to the right ad infinitum, i.e., that assets are being accumulated at a lower cost than at which they are sold during the withdrawal phase. While this may be true in the very long run, there are also times when the stock market goes nowhere for an extended period of time or even generates negative returns.
The accumulation phase of a typical investor starts in the 30s, after the newly formed family has moved into its first home and the first well-paying job has been taken up. Suppose you are a bit late to the game at 35 and have just signed up for an ETF savings plan in a tax-deferred retirement account. The chart shown in Figure 1 is a theoretical future scenario, illustrating the potential performance of the S&P 500 during the accumulation phase in green, and the withdrawal phase in red. The chart is not necessarily particularly realistic but you get the idea. On a net basis, an investor builds assets at a higher price than he/she can withdraw. The 4% rule breaks down, especially considering that living expenses typically rise with increasing age. Even worse, the excellent performance in the late 2040s in this example leads the investor to believe that he/she can actually retire rich because of this particularly strong bull market.
Figure 1: Hypothetical chart of the S&P 500 index, based on a Monte Carlo simulation, taking the index’ total return and volatility between 2002 and 2022 into account (own work, based on the daily adjusted closing price of the S&P 500 index)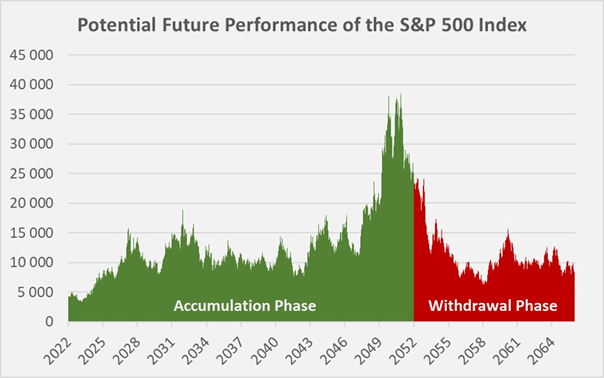
Personally, I have never been a fan of this retirement strategy for this very reason. If you plant a tree in your thirties, would you cut it down a few decades later? Wouldn’t it be much more rational if your tree kept growing and you just harvested the fruit? As its keeps growing, you would certainly learn to appreciate that you can count on an ever-increasing amount each year as long as the tree remains healthy.
You see where this is going – investing in individual dividend-paying stocks. A diversified dividend stock portfolio certainly fits this analogy. Individual stocks can be seen as branches of the tree, and they certainly might get sick once in a while and rarely, a branch might even die off. However, with a reasonable investment of time and considering the abundant information available about each company, such a portfolio is easy to manage even for the less ambitious investor.
I have always been a strong advocate of this strategy due to the dependability of its results. Having the freedom to own what I prefer has always been of utmost importance to me. Would you feel comfortable buying a fund like the S&P 500, currently weighting Tesla at 2.2% or Apple at almost 7%, knowing each company’s current valuation? Would you feel comfortable with a strategy that currently focused on information technology, at a sector weighting of over 28%? Conversely, would you deem a 0.2% allocation to Altria or 1.1% to Johnson & Johnson appropriate?
Obviously, you could diversify your ETF portfolio beyond the S&P 500, also in terms of geography, by purchasing international ETFs. This certainly makes sense but I’d still argue that dividend-paying stocks with a strong track-record will likely continue to deliver outsized returns, with a strong emphasis on reliability. A retirement based on dividend-paying stocks takes the emotions out of the equation. In this way, the retirement income is dependent only on corporate profits and no longer on the markets, which can remain irrationally emotional over long periods of time.
In this article, I want to illustrate the potential of this well-known but often underappreciated strategy by briefly discussing six stocks that I own in my personal portfolio. I do not necessarily consider all of them a buy at the moment, but these are nonetheless great companies to be owned for the long haul. I will outline what an equally weighted portfolio of these holdings would yield upon retirement, assuming an initial investment of $15k in each company and a recurring monthly investment of another $350. Dividends are being reinvested at appropriately growing share prices, i.e., at the rate observed over the last two decades on average.
The hypothetical dividend investor in this example therefore starts with a portfolio value of $90k at the age of 35 and invests $2.1k per month. I assume that his/her salary grows at 3% per year and expect the long-term annual rate of inflation to be around 3% as well. The average monthly expenses of the investor’s household amount to around $3.3k, while $1.7k per month are spent on a mortgage loan or rent. Certainly, the household in this example is not among the poorest, assuming a monthly household income of $7.1k. The household’s living expenses amount to $60k in 2022, but increase to $145k by 2052, thirty years later, when the investor retires and must be able to fund the family’s expenses from the portfolio. To be conservative, I assumed that the mortgage loan would not be repaid and, along with the other costs of living, would actually increase at the rate of inflation.
Now, let’s see how our hypothetical investor fares, purchasing $15k worth of share of Merck, Johnson & Johnson, Procter & Gamble, Altria, T. Rowe Price and Amgen today.
Merck
I have covered Merck (MRK) very recently and am pretty bullish on the company’s future. I consider the stock a reasonably good value at $80 (see Figure 2). Keytruda, which contributed 35% to total 2021 sales, is Merck’s current cash cow. The company has an acceptably well-diversified portfolio, which is expected to strengthen further thanks to potential acquisitions. Besides acquisitions, the massive cash flows from Keytruda (loss-of-exclusivity in 2028) will most certainly be used for share repurchases and an increasing dividend. The company’s profitability in terms of return on invested capital (ROIC) has gradually improved over the last years and reached almost 16% in 2021. Analysts expect Merck’s earnings to grow at a double-digit rate on average over the next years and it should be noted that earnings predictions have been very accurate according to the analyst score card from FAST Graphs.
Figure 2: FAST Graphs chart for MRK, based on adjusted operating earnings (obtained with permission from FAST Graphs)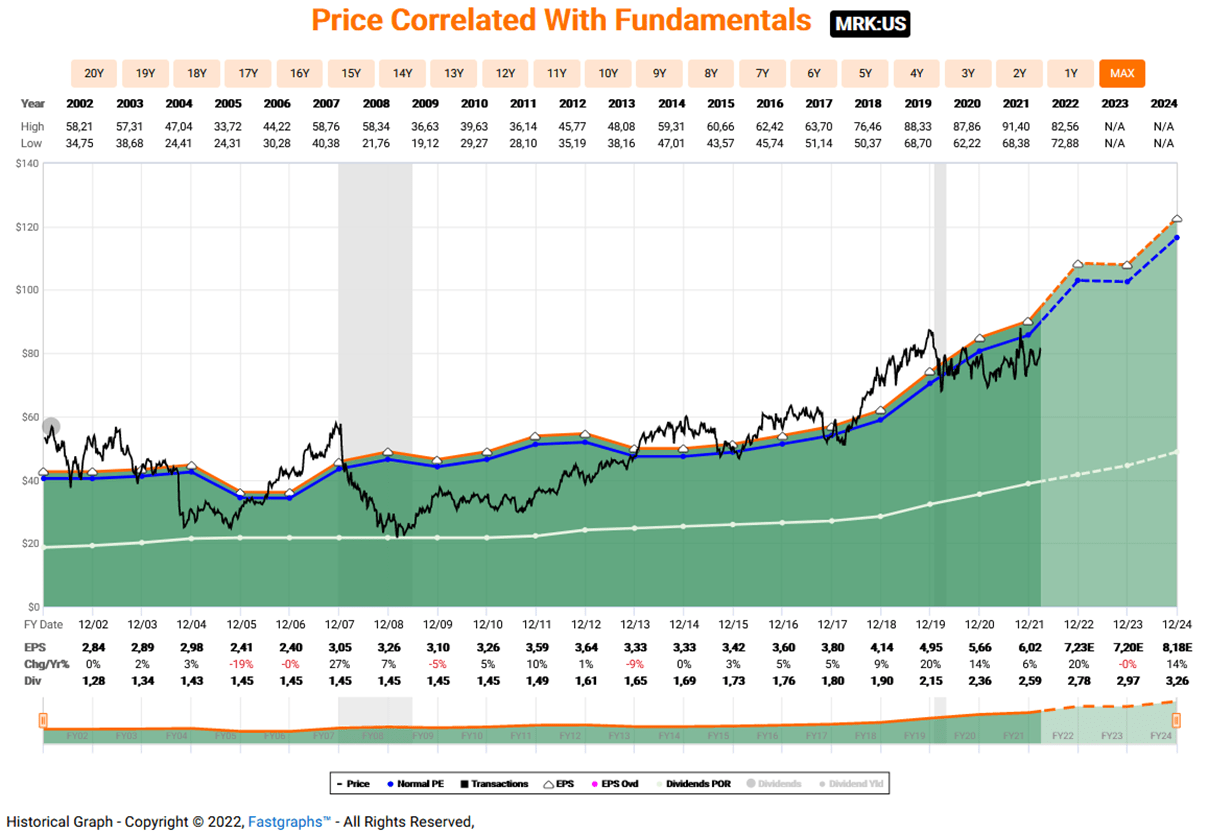
Merck has paid a consistent dividend since 1970 and has increased it for 12 consecutive years. The stock’s long-term performance in terms of capital appreciation has been pretty weak at an annualized rate of return of only 2.1% over the last 20 years, while the compounding dividend growth rate of 3.7% per year over the same time was certainly acceptable. Note that MRK’s seemingly bad performance is mostly attributed to the stock’s significant overvaluation around the year 2000. The shares currently yield around 3.4% and the dividend is well covered by free cash flow. However, it should be noted that Merck is a pharmaceutical company with a comparatively weak free cash flow efficiency. Nevertheless, the company’s balance sheet is of high quality, at a leverage ratio of 1.5x net debt to EBITDA.
A $15k investment in Merck buys 185 shares today. Investing another $350 each month into shares of the company and reinvesting dividends, assuming a share price appreciation of 2.1% per year, translates to 4.3k shares at the time of retirement. While the dividend payout is only around $511 in 2022, it is expected to grow to the substantial sum of $35k by 2052. The yield-on-cost, counting only newly deployed capital, is 16% – that is the magic of compounding, with reinvested dividends acting as the major yield booster. This example illustrates that a pretty weak performance in terms of share price amplifies the compounding effect stemming from reinvested dividends.
Johnson & Johnson
Johnson & Johnson (JNJ) is probably one of the most well-known blue-chip companies. It designs, manufactures and sells medical devices, pharmaceuticals and consumer products and has recently announced plans to spin-off of its consumer health business. JNJ mainly grows through acquisitions but maintains a very high-quality balance sheet while delivering a pretty consistent ROIC of around 15%. Earnings are expected to grow at a mid-single digit rate over the next years and analyst estimates are typically well in line with actual earnings, according to FAST Graphs’ analyst score card.
The company grew its dividend at a compound annual growth rate (CAGR) of over 9% over the last 20 years and its stock performed pretty well at an annualized rate of return of 5.7% in terms of capital appreciation. JNJ is a dividend king with 60 consecutive years of dividend increases. The dividend is very well covered by free cash flow. The current dividend yield of 2.4% is below the long-term average. JNJ typically trades at a – in my opinion deserved – premium, but occasionally revisits its intrinsic value (see Figure 3). I do not consider the stock a screaming buy at the moment, but remain bullish on the company’s well-diversified business and am confident that JNJ will continue to reward long-term shareholders generously.
Figure 3: FAST Graphs chart for JNJ, based on adjusted operating earnings (obtained with permission from FAST Graphs)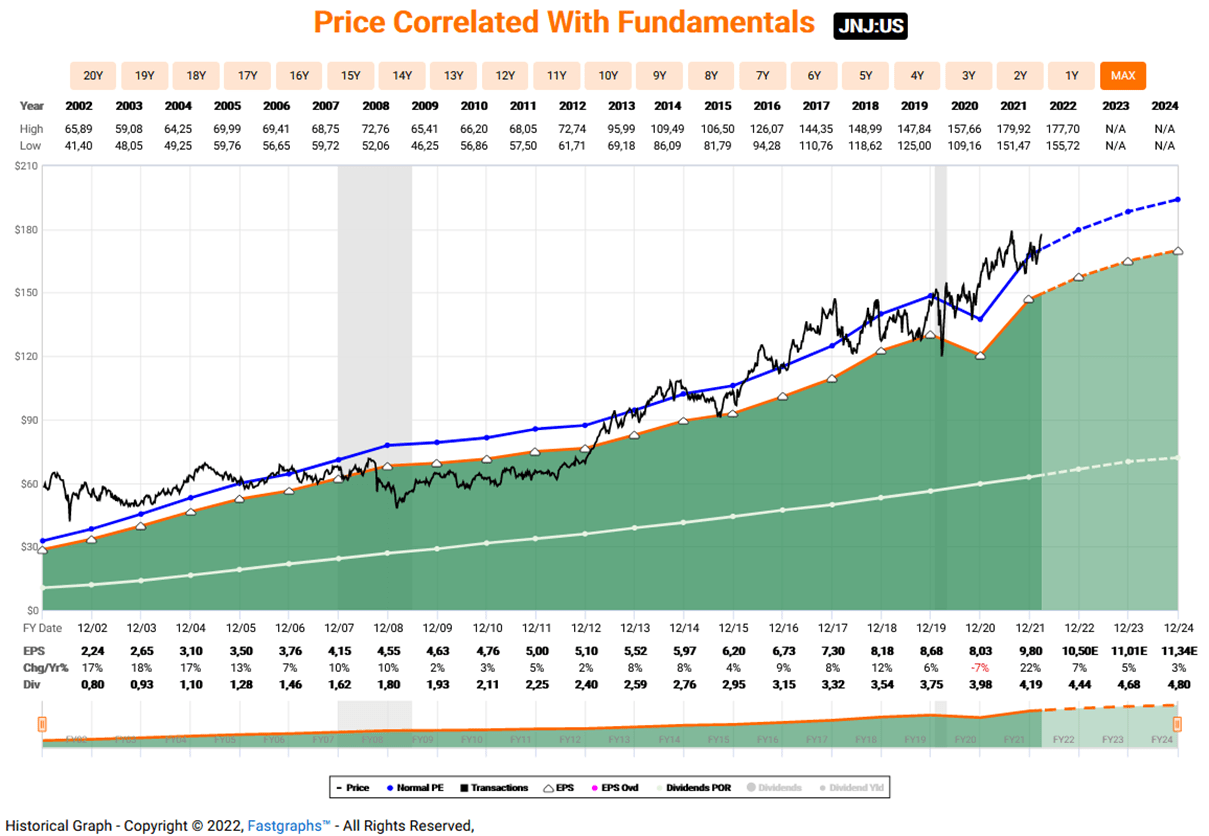
A $15k investment in JNJ buys 84 shares at today’s price of $177. Investing another $350 each month into shares of the company and reinvesting dividends, assuming a share price appreciation of 5.7% per year, translates to 858 shares at the time of retirement. Note that I capped the dividend growth rate at 5% to remain conservative with my estimates, even though JNJ grew its dividend at a CAGR of over 9% over the last 20 years. The current dividend payout of around $356 is expected to grow to $15.7k at the investor’s age of 65. The yield-on-cost of 7.1% is not particularly high but certainly acceptable for such a high-quality company and considering the current valuation.
Procter & Gamble
Procter & Gamble (PG) is also among the most well-known defensive blue-chip companies. It owns a large number of renowned consumer products brands. The company faced some challenges between 2013 and 2018 as is emphasized by the weak ROIC of 9% or even less. PG sold less profitable businesses and began focusing on the most profitable and strongly growing brands. The company delivered stellar earnings in fiscal 2021 and its ROIC has been rising consistently over the last couple of years to currently 15%. PG’s balance sheet is particularly strong, as is emphasized by its current net debt to EBITDA ratio of less than 1.5.
Operating earnings are expected to grow at a mid- to high-single digit rate over the next couple of years, which is certainly very strong for a consumer goods company. PG deservedly trades at a premium but I consider the current valuation a bit of a stretch. The market’s current optimism about PG’s future is best illustrated by the FAST Graphs chart in Figure 4.
Figure 4: FAST Graphs chart for PG, based on adjusted operating earnings (obtained with permission from FAST Graphs)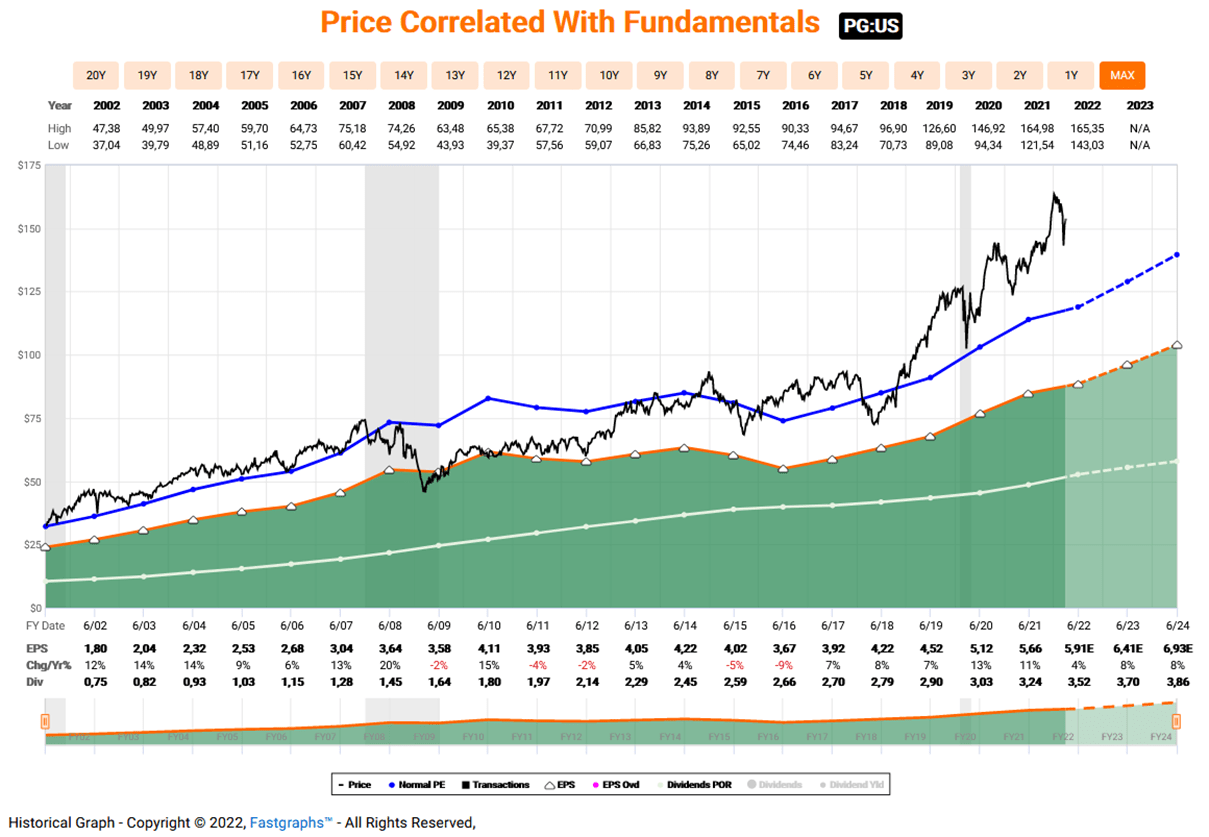
PG grew its dividend at a record-breaking CAGR of almost 12% over the last 20 years and its stock performed very well at an annualized rate of return of 7.9% in terms of capital appreciation. The company is a dividend king with 65 consecutive years of dividend increases. The dividend remains very well covered by free cash flow, thanks to the company’s high margin business and the very solid balance sheet. Nevertheless, the stock’s current overvaluation is also noticeable from the below-average dividend yield of currently only 2.2%.
A $15k investment in PG at a share price of $155 would translate to 96 shares. Investing another $350 each month into shares of the company and reinvesting dividends, assuming a share price appreciation of 7.9% per year, translates to 698 shares at the time of retirement. The dividend payout of around $334 in 2022 is expected to grow to $10.5k in 2052. The yield-on-cost of only 4.8% underscores the stock’s current overvaluation and is also a function of the substantial capital appreciation, which dampens the compounding effect significantly. Nevertheless, it should be kept in mind that the obtained yield-on-cost is also a result of the precautionary cap of the dividend CAGR at 5%, as a terminal growth rate of 12% (see above) appears overly optimistic.
Altria
Altria (MO) is Philip Morris’ U.S. operations that remained after the spin-off of the international business (PM) in 2008. The company has undertaken efforts to diversify its operations away from the combustibles business, however, so far with moderate success (e.g., through investments in JUUL and Cronos Group). Nevertheless, as Altria’s business remains highly profitable at a ROIC of typically around 20 to 25%, the company continues to be able to return very generous amounts of cash to its shareholders. In part due to the recent acquisitions, Altria’s balance sheet quality has decreased substantially, but this does not appear concerning in light of the extremely strong free cash flow. Earnings are expected to continue to grow at a healthy rate of 5 to 6% per year, according to the robust analyst estimates according to FAST Graphs’ analyst score card. The stock still appears undervalued also at the recently appreciated price (Figure 5). Note, though, that the low valuation is also a consequence of several uncertainties the company is facing (e.g., potential ban of menthol cigarettes, overall political risk, onerous launch of IQOS – PM’s heated-tobacco device).
Over the last 20 years, MO grew its dividend at a CAGR of 10%, while its stock returned 8.2% per year in terms of capital appreciation. The company is a dividend king when ignoring the factually correct reset of its counter due to the spin-off of Philip Morris International. The dividend remains well covered by free cash flow, thanks to the company’s high margin business, but the payout ratio is a bit on the high side. The stock currently yields 6.9%.
Figure 5: FAST Graphs chart for MO, based on adjusted operating earnings (obtained with permission from FAST Graphs)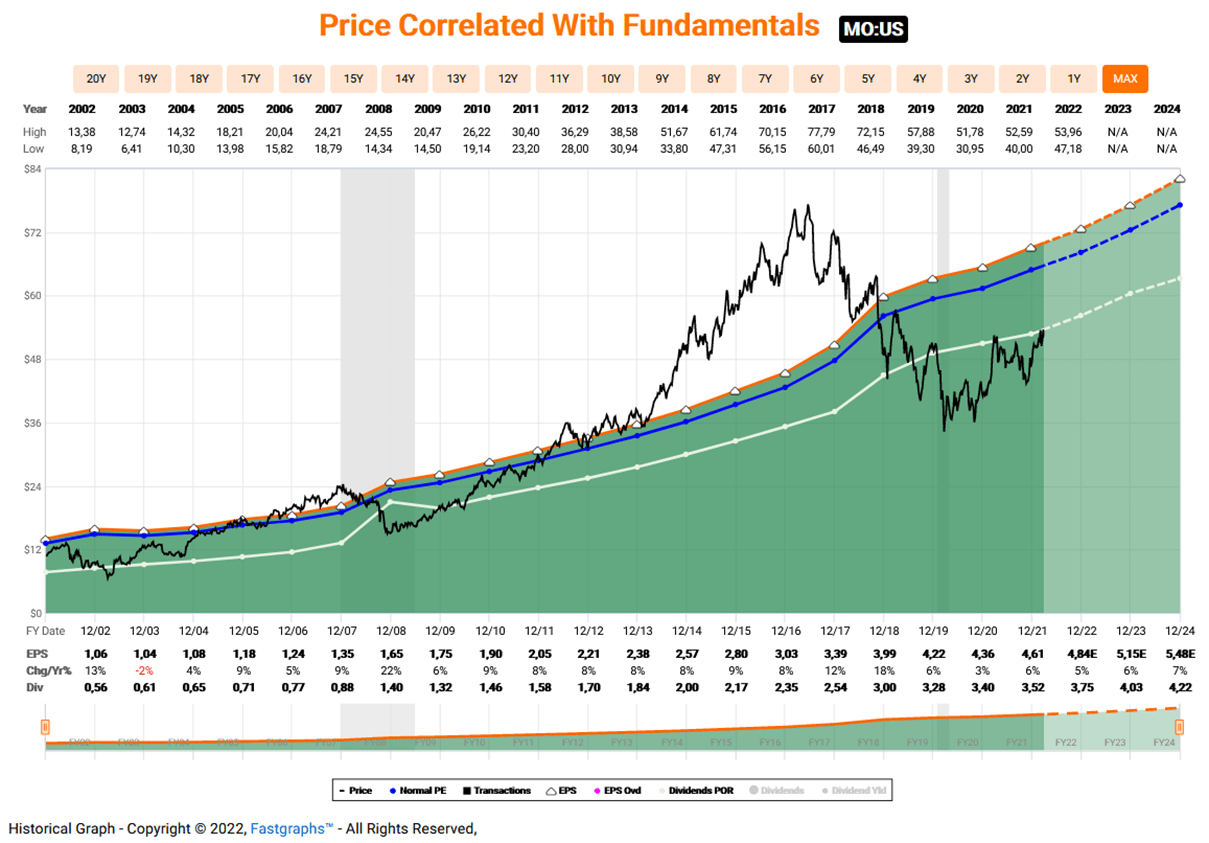
Investing $15k in MO would buy 288 shares today. Consistently investing $350 each month into shares of the company and reinvesting dividends, assuming a share price appreciation of 8.2% per year, translates to almost 3.8k shares at the time of retirement. Altria would send our investor already more than $1k over the next 12 months but the payout should increase to a staggering $58k per year by 2052. Note that due to Altria’s relatively high payout ratio, I capped the dividend growth rate at 5% per year, even though the company increased the dividend at a CAGR of over 10% over the last 20 years. Nevertheless, the yield-on-cost is still pretty spectacular at over 27%. Note that this assumes an annual increase in share price of 8.2% – you be the judge whether Altria’s stock will appreciate at this rate going forward. Keep in mind, that the worse Altria performs in terms of share price, the more pronounced the beneficial effect from reinvested dividends will be. Of course, it remains to be seen whether the company continues to be able to offset declining combustibles volume with price increases. However, also taking into account diversification into heated tobacco products, electronic cigarettes and other areas such as cannabis, I remain positive about the company’s future and earnings power.
T. Rowe Price
I have covered T. Rowe Price (TROW) very recently and consider the stock a compelling value at $155. Asset managers are a bet on the future performance of the stock market as their fees are tied to the company’s assets under management (AUM). Therefore, the stock may be viewed as a far from ideal example in the context of this article. Nevertheless, I’d argue that active fund managers typically outperform during difficult times and that market participants have lately turned overly conservative with regard to TROW’s future prospects. This is also emphasized by the FAST Graphs chart in Figure 6, with analysts expecting TROW’s earnings to be roughly flat over the next couple of years. The earnings of asset managers are understandably very difficult to estimate, however, analysts of TROW have overall been very conservative and the company has typically beaten estimates by a wide margin according to FAST Graphs’ score card.
The company is very well managed and highly profitable at a ROIC of typically 25%+, thanks to its asset-light business model and the economies of scale that benefit this comparatively large investment manager (year-end assets AUM of $1.7 trillion). As a consequence, also its balance sheet is very strong and the company operates practically without any leverage.
Thanks to the robust free cash flow, the company was able to increase its dividend at a CAGR of more than 14% over the last two decades. In terms of capital appreciation, the stock returned 11% per year – a very solid performance indeed. TROW has increased its dividend for 35 years and is expected to continue to do so given its robust free cash flow and the conservative payout ratio. At today’s share price of $155, the stock yields 3.2%, an above average yield for TROW.
Figure 6: FAST Graphs chart for TROW, based on adjusted operating earnings (obtained with permission from FAST Graphs)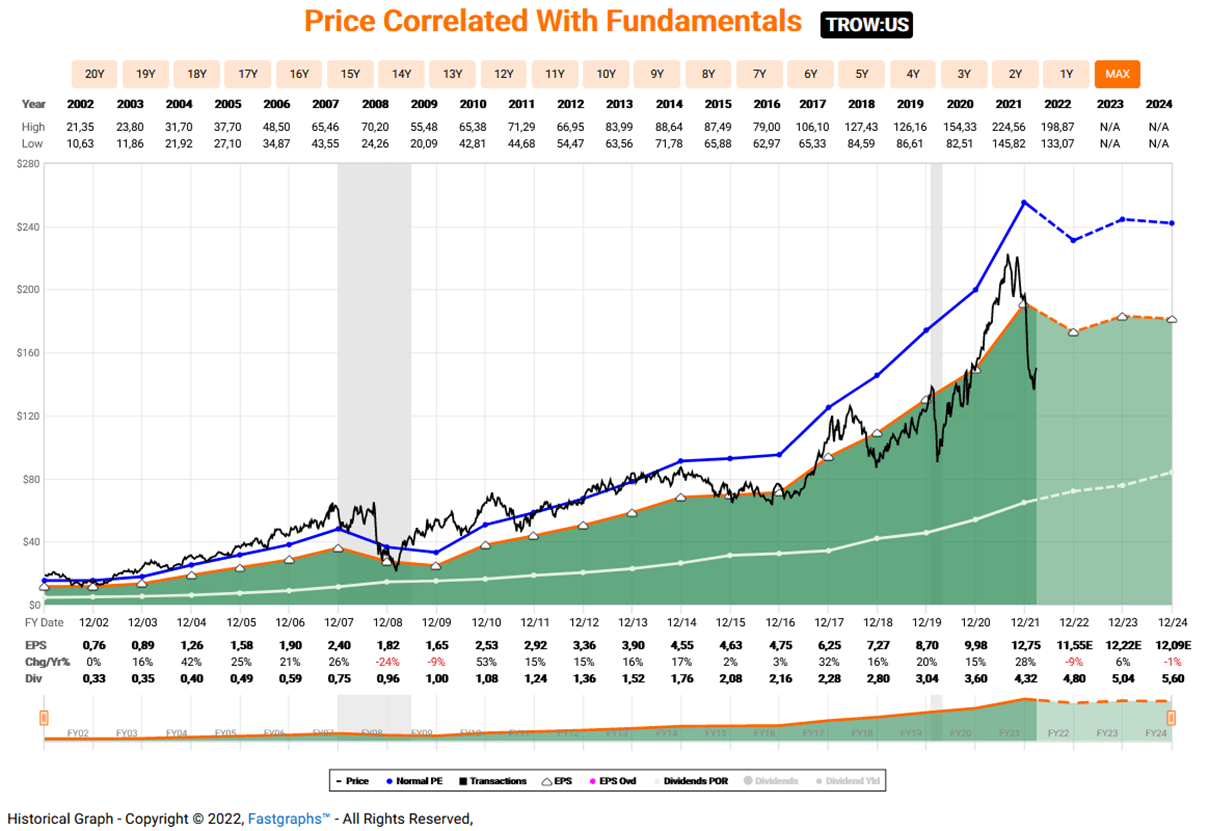
A $15k investment in TROW translates to 100 shares. Consistently investing $350 each month into shares of the company and reinvesting dividends, assuming a share price appreciation of 11% per year, results in 568 shares at the time of retirement. The initial payout of $480 per year would grow to almost $12k by 2052. Also in this case, I capped the dividend growth rate at 5% per year to remain conservative. However, I did not cap the share price appreciation of 11% p. a., which is of relevance for the number of shares purchased through reinvested dividend, in that a stronger appreciation in share price leads to a weaker compounding, as is emphasized by the yield-on-cost of only 5.3%.
Amgen
Finally, I want to briefly discuss biotech blue-chip Amgen (AMGN), which I have covered in late 2021 for the first time. I still believe that the share price is largely a function of uncertainties surrounding Amgen’s pipeline, potentially necessary price discounts following the loss-of-exclusivity of AbbVie’s Humira (which is a direct competitor of Amgen’s Enbrel) but also the company’s lack in geographical diversification. Nevertheless, I increasingly appreciate the shareholder-friendly attitude of management and consider the stock a promising dividend growth investment case, as I have outlined in my recent article. Earnings are expected to grow at a high-single digit rate over the next years. Note that analysts typically underestimate AMGN’s earnings according to FAST Graphs’ analyst score card. The stock is not a screaming buy at the moment, especially when compared to, e.g., Bristol-Myers Squibb, but certainly good value (see Figure 7).
Thanks to the strongly growing free cash flow, the company was able to cut the number of its shares outstanding almost in half, while at the same time increasing the dividend at a very healthy rate. Since its inception in 2011, the dividend grew at a CAGR of breathtaking 33%. In terms of capital appreciation, the shares also performed well, at an annualized rate of return of over 7.5%. The stock currently yields 3.2%.
Figure 7: FAST Graphs chart for AMGN, based on adjusted operating earnings (obtained with permission from FAST Graphs)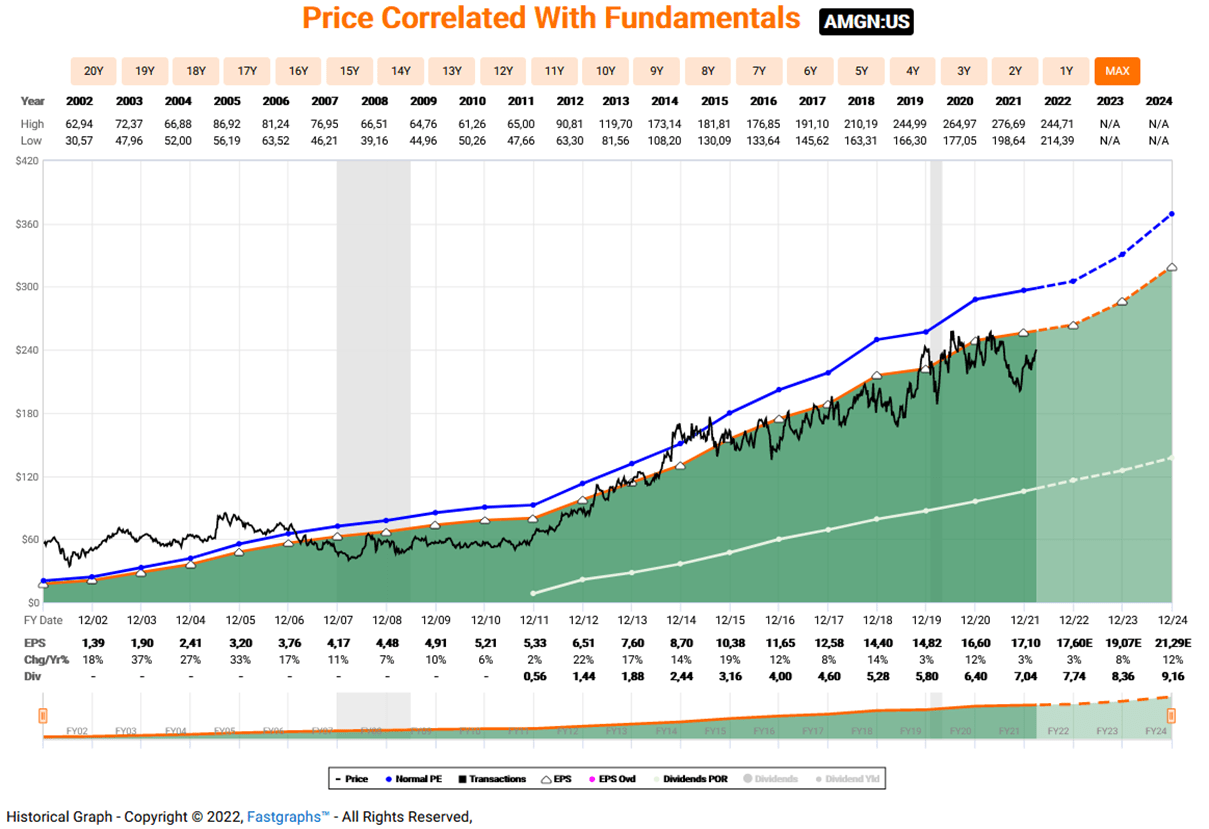
A $15k investment in AMGN at a share price of $240 would translate to 62 shares. Investing another $350 each month into shares of the company and reinvesting dividends, assuming a share price appreciation of 7.5% per year, leaves our investor with 545 shares at the time of retirement. The dividend payout of around $481 in 2022 is expected to grow to more than $18k upon retirement. In 2052, our hypothetical investor would look at a sizable yield-on-cost of 8.3%.
Final Thoughts
After 30 years of consistently reinvesting dividends and investing remaining cash, our investor retires at the age of 65. Due to inflation, the living expenses of the household have increased to $145k per year, however, it should be remembered that this estimate is somewhat conservative due to the assumptions regarding the mortgage loan not being paid back and actually increasing at the rate of inflation.
However, also the portfolio, which had an initial value of only $90k grew substantially, to the respectable sum of $7.6 million. Our investor is not planning to cut off branches from the tree, as he/she notices the unbelievable amount of fruit. While the portfolio paid only $3.2k in 2022, the annual income increased to mouth-watering $150k each year. This amount of money covers all of the household’s living expenses, just from the ever-increasing stream of dividends.
Clearly, the most unloved and underappreciated stocks gave rise to the highest yields-on-cost, as the weak share price performance amplifies the compounding effect when reinvesting dividends (Table 1). This was particularly evident in the example of Merck, even at the comparatively low dividend growth rate. Investing in an unloved business with a high dividend yield leads to even better results, as the example of Altria shows. Note that in this example, a share price appreciation of 8% per year was assumed, dampening the compounding effect considerably. Assuming the shares of MO appreciate by only 4% per year, all else being equal, the yield-on-cost would be almost unbelievable 80%. Conversely, investments in currently favored companies such as PG and JNJ appreciate much less spectacularly. Nevertheless, both contribute substantially to Fortuna’s cornucopia, at expected annual payouts of $10.5k and $15.7k, respectively. The example of T. Rowe Price best illustrates the dampening effect of the share price appreciation on the compounding, as the shares were assumed to continue to appreciate in price at 11% per year until retirement.
Table 1: Assumed share price appreciations, current dividend yields and expected yields-on-cost for the stocks discussed herein (own work, based on the current stock and dividend data and historic growth rates of each company)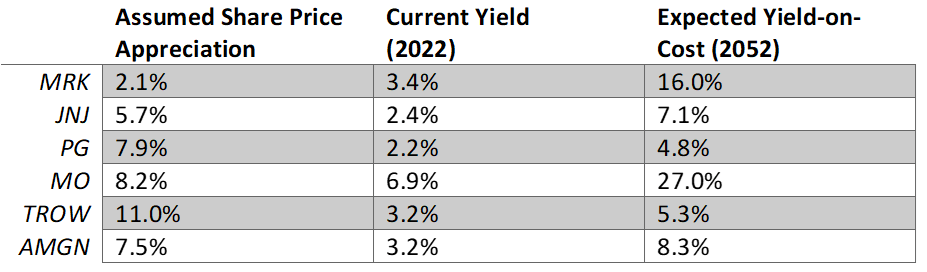
As a final word of caution, I want to emphasize that this model does not factor in transaction costs and taxes. Also, it should be kept in mind that past performance in not necessarily a reliable indicator of future performance and that I personally consider a portfolio of six holdings – especially in relation to the sector-specific allocation – as not appropriately diversified. The companies discussed in this article should merely serve as an example illustrating the power of compounding when reinvesting dividends. All six companies look back on a history spanning several decades, and with occasional due diligence, I am confident that a weakening branch of the fruit-laden tree could be replaced well in time.
Overall, I believe that dividend investors, who can only rely on the income from their holdings during retirement, have a significant advantage over index fund investors. The retirement income is dependent only on corporate profits and no longer on the markets, which can remain irrationally emotional over long periods of time. Also, life expectancy is no longer a limiting factor, and I am sure that a steadily declining portfolio value is particularly difficult to stomach as the years go by and the holdings are gradually sold off.
Be the first to comment