

da-kuk
The iShares MSCI India ETF (BATS:INDA) provides exposure to large and mid-cap Indian equities. Indian equities benefit from several tailwinds. In the short term, India benefits from having access to discounted Russian oil, which allows India to report relatively lower inflation figures. India is also benefiting from companies diversifying their production out of China. Longer-term, India has one of the best demographic setups for the next few decades. For those with a long-term view, INDA may be a fund to own for years.
Fund Overview
The iShares MSCI India ETF provides exposure to large and medium-sized companies in India. It is the largest India-focused ETF with $4.7 billion in assets (Figure 1). The INDA ETF charges a 0.68% expense ratio.
Figure 1 – INDA vs. peer funds (Seeking Alpha)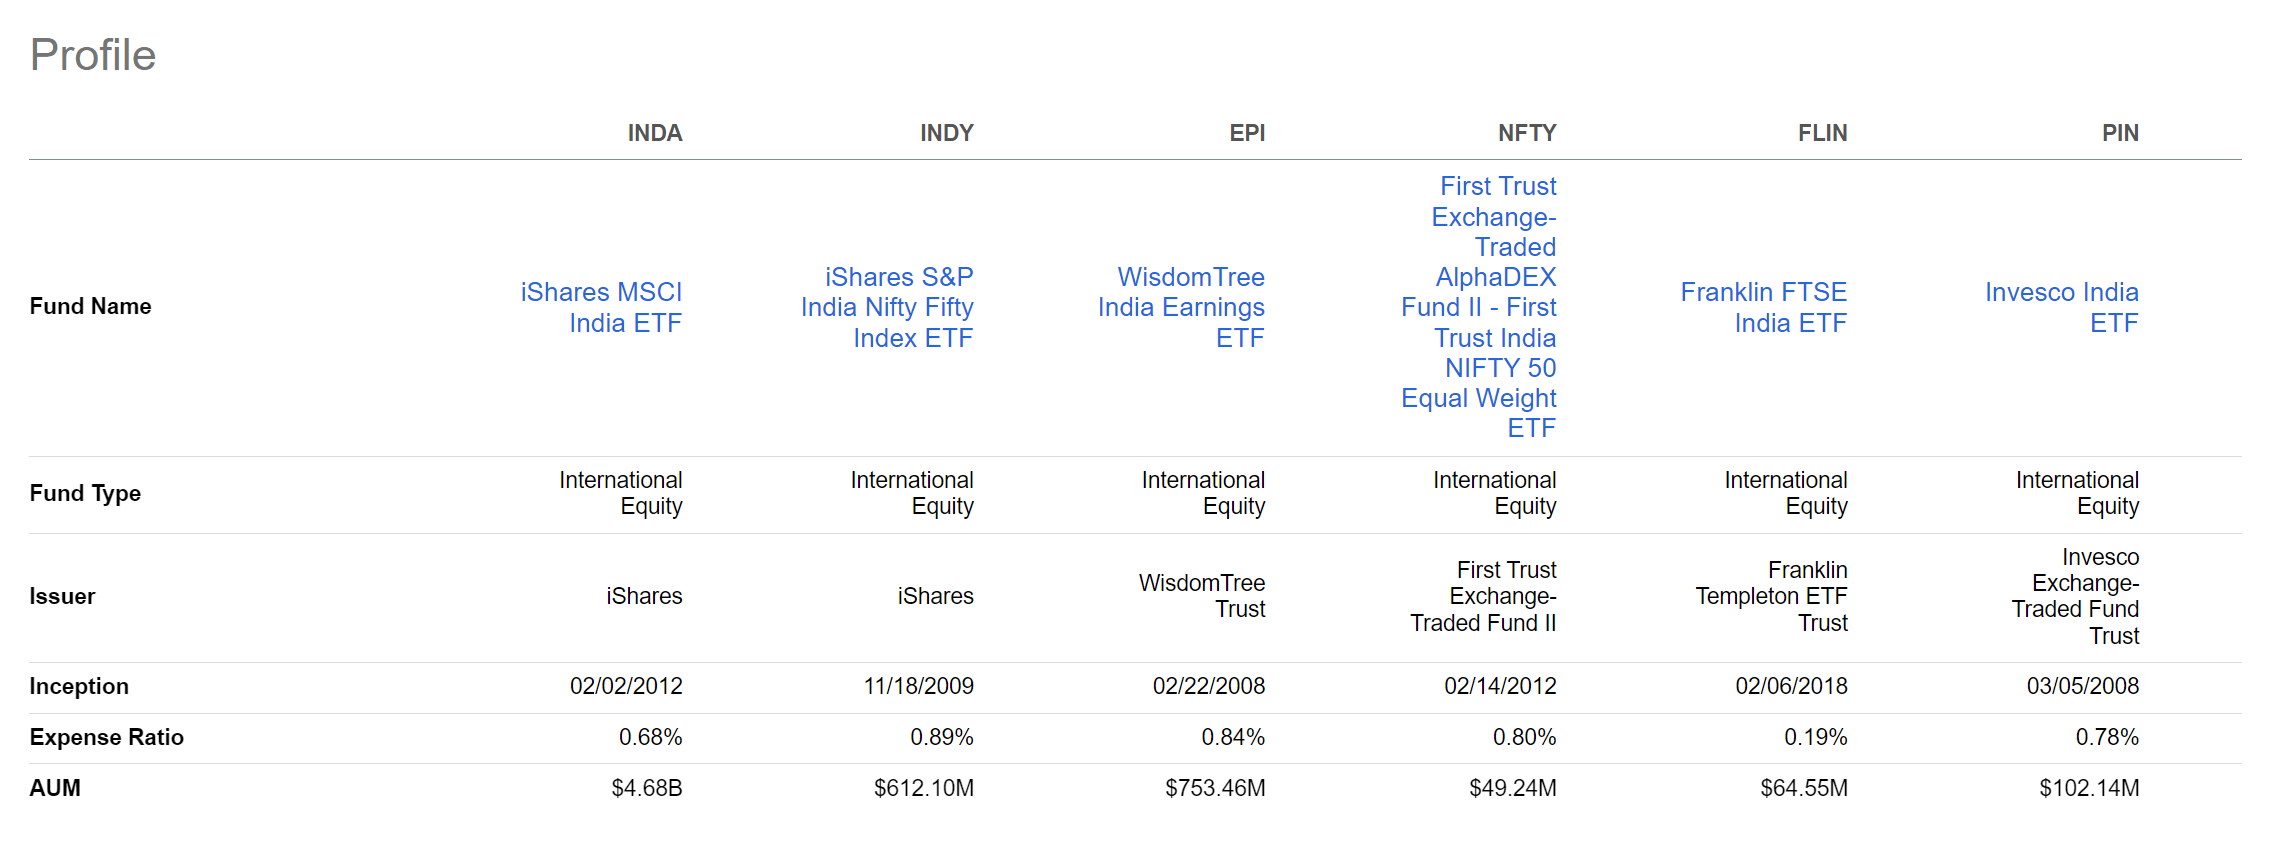
Strategy
The INDA ETF tracks the investment performance of the MSCI India Index (“index”), an index designed to measure the performance of large and mid-capitalization companies in the Indian equity markets.
Portfolio Holdings
As can be seen in figure 2 below, the INDA ETF has almost a quarter of its portfolio invested in the financial sector. Other large sector weights include Technology and Energy at 14.6% and 12.2% respectively.
Figure 2 – INDA sector weights (ishares.com)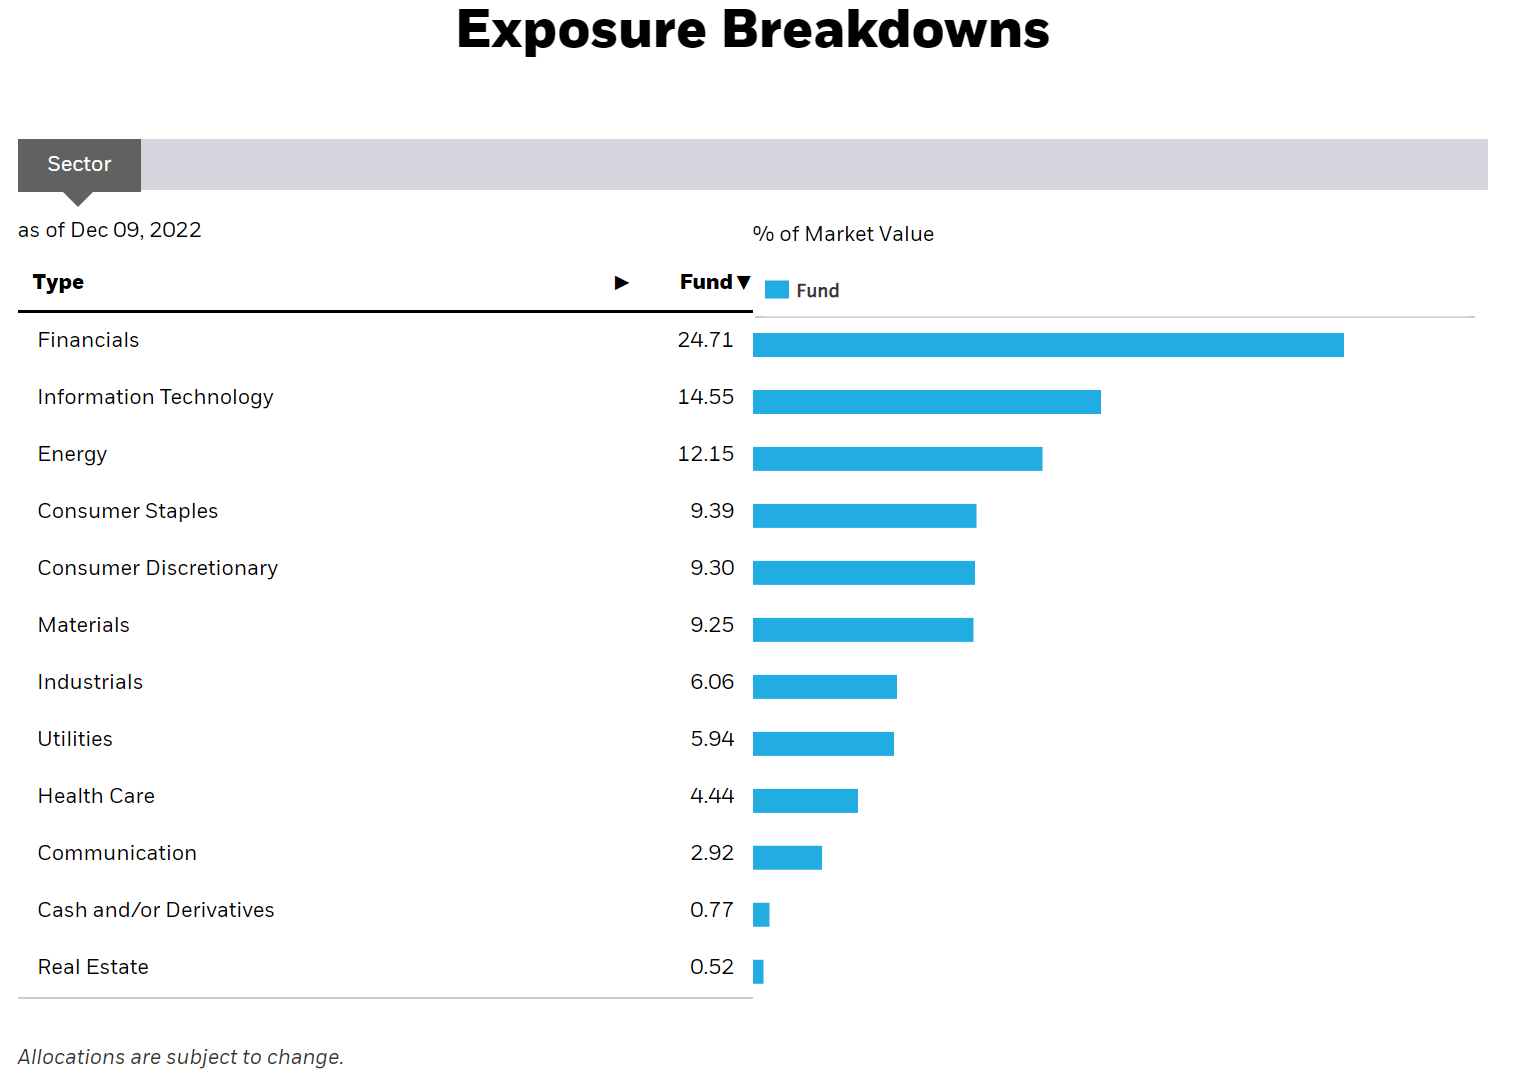
Overall, the fund has 113 positions and the top 10 holdings account for 47.4% of the portfolio (Figure 3). Reliance Industries, controlled by one of the richest industrialists in India (Mukesh Ambani), is the fund’s largest holding at over 10%.
Figure 3 – INDA top 10 holdings (ishares.com)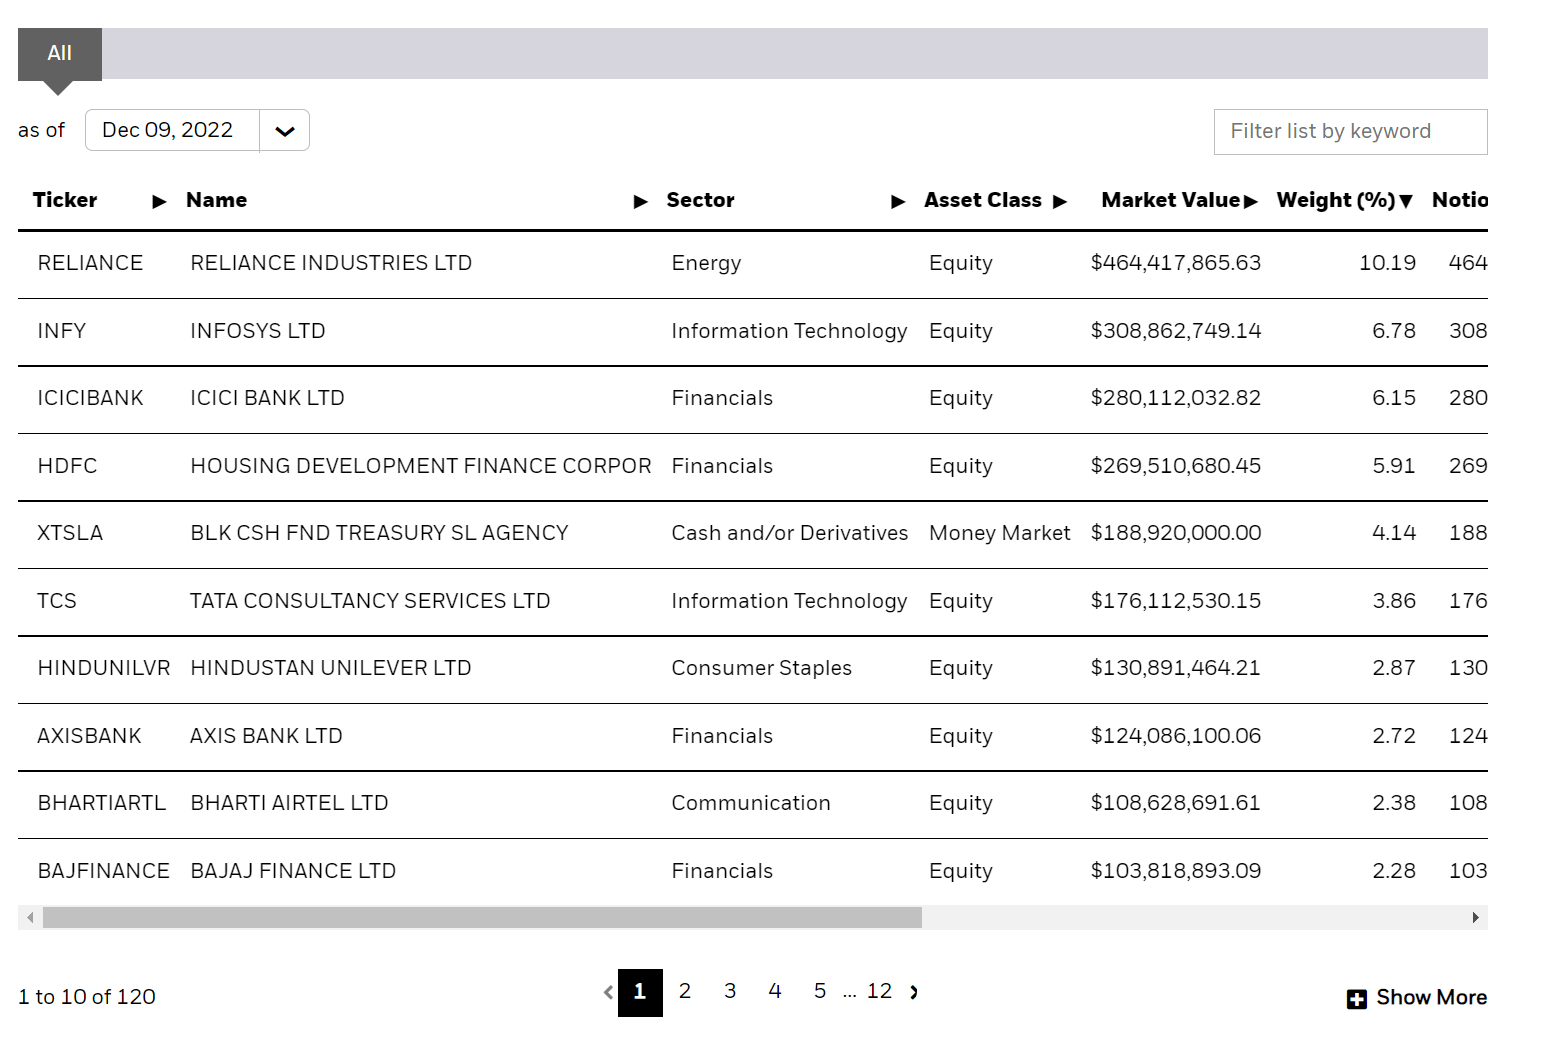
Returns
In the short term, India has been one of the best performing international markets with the INDA ETF returning -0.5% to November 30, 2022. On a longer-term timeframe, INDA’s 5Yr average annual return of 6.9% is respectable, but lags behind that of the U.S.-focused iShares Core S&P 500 ETF’s (IVV) 10.9% (Figure 4).
Figure 4 – INDA returns (ishares.com)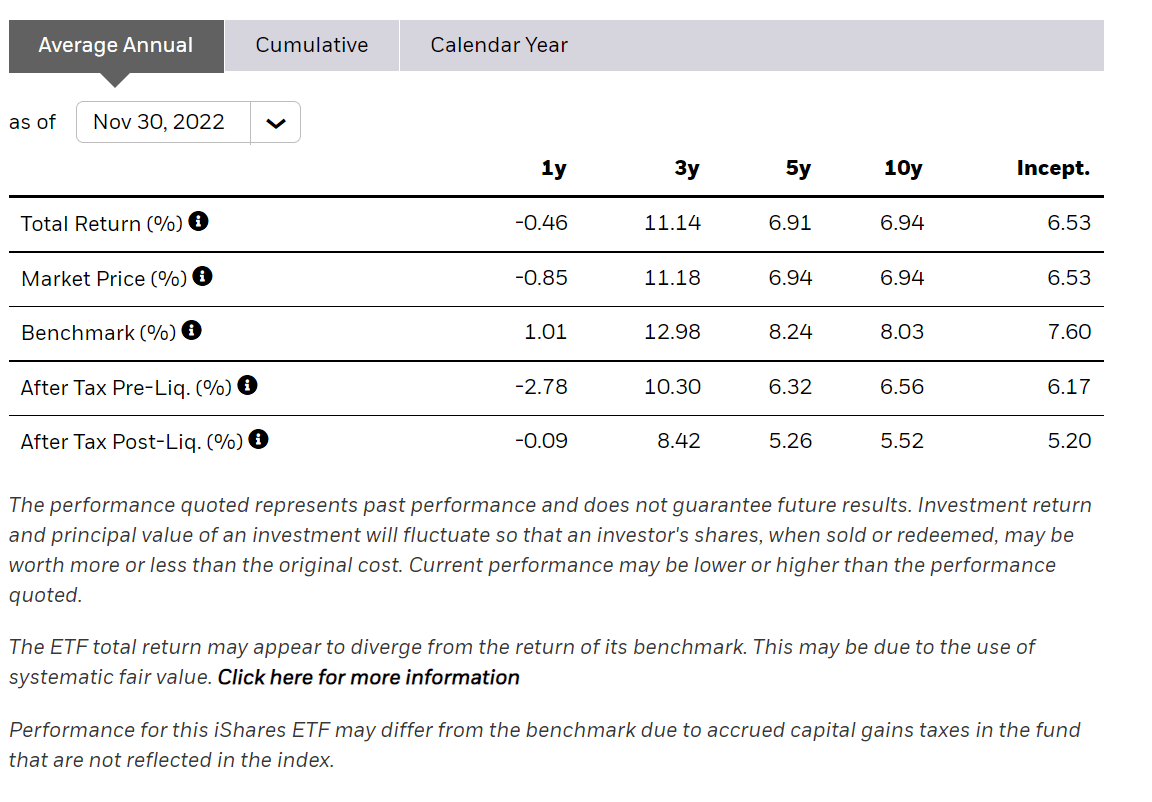
Distribution & Yield
The INDA ETF pays a semi-annual distribution that is variable. Historically, INDA’s distribution was not a significant component of returns, although it did pay a large $2.91 / share distribution in December 2021 funded by net investment income (Figure 5).
Figure 5 – INDA distributions (Seeking Alpha)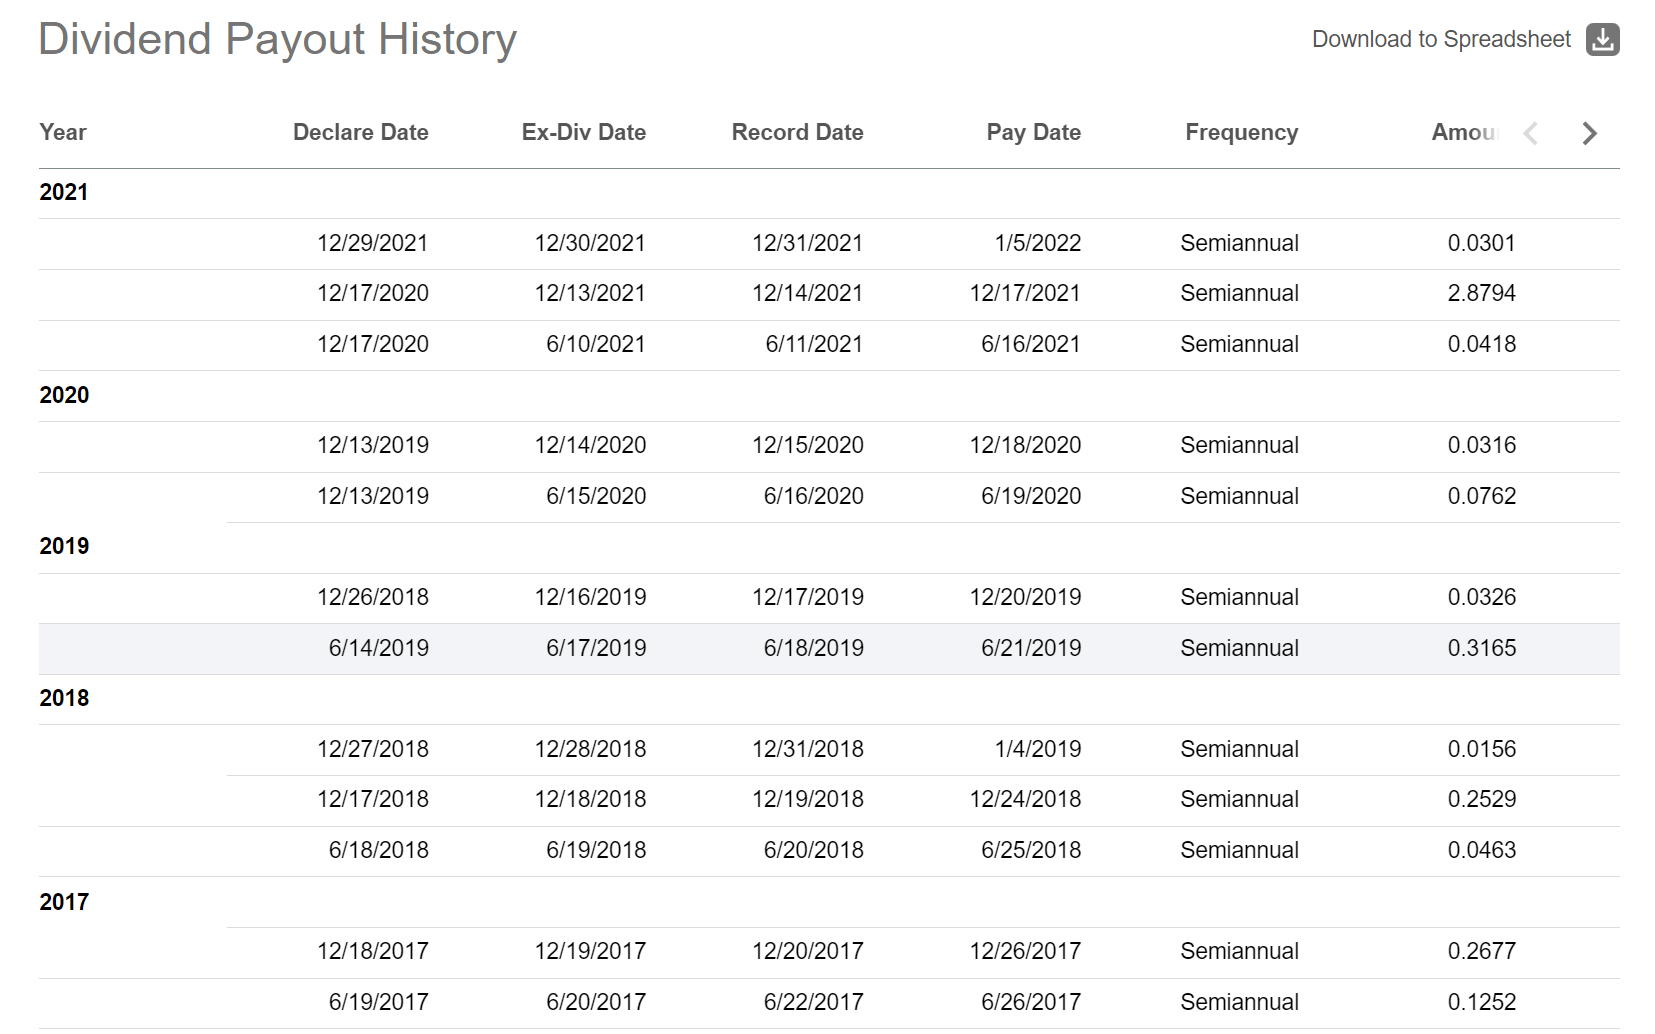
Tailwinds For India
Currently ranking #6 with a $3.3 trillion economy, India looks like one of the best-positioned large economies in the world for the next several years (Figure 6).
Figure 6 – World GDP ranking (Visual Capitalist)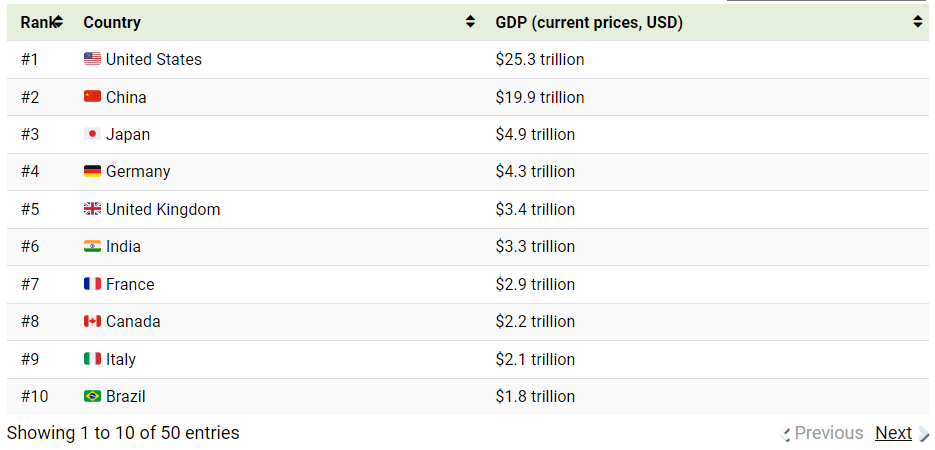
The IMF estimates India’s economy to grow by 6.8% in 2022 and 6.1% in 2023, among the best in the world (Figure 7). In my opinion, India’s economic growth is fueled by several tailwinds.
Figure 7 – IMF world GDP forecast (imf.org)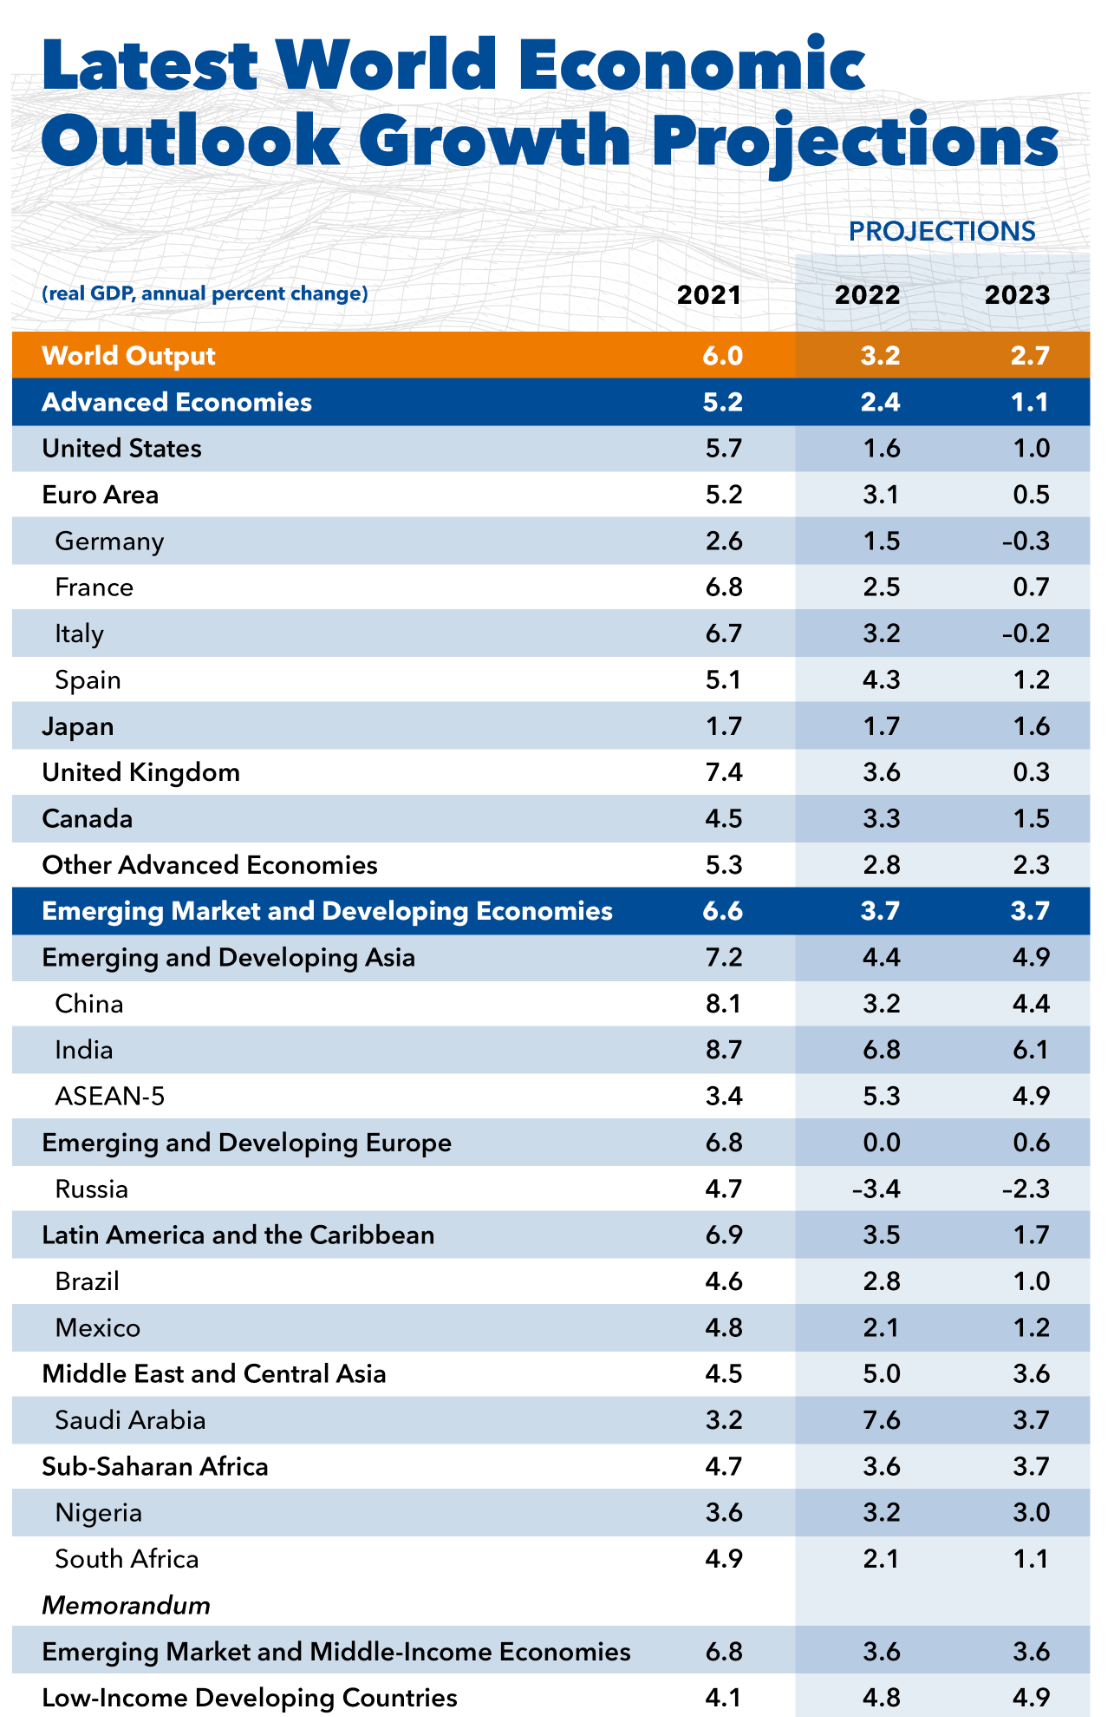
Cheap Russian Oil Has Softened The Inflation Pain
First, in the short-term, unlike Europe which has sided with America in boycotting Russian oil due to Russia’s invasion of Ukraine, India has been busy importing discounted Russian oil to fuel its economy. From a low base of practically nil prior to the war, India has been importing almost a million barrel-per-day of Russian oil in recent months (Figure 8).
Figure 8 – India has been a top importer of Russian oil (BBC)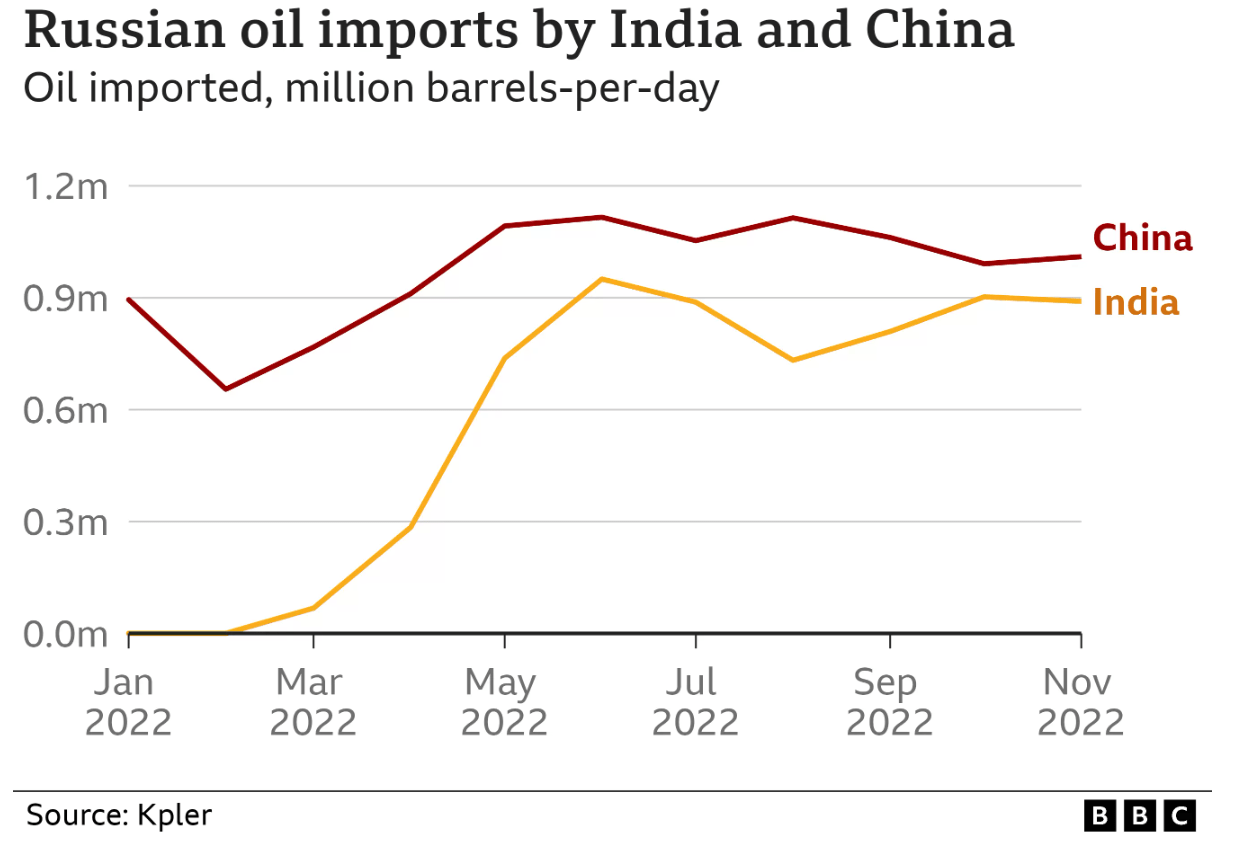
Discounted Russian oil has allowed the Indian economy to record one of the lowest inflation rates in the world at 5.9% in November despite one of the fastest growth rates (Figure 9).
Figure 9 – Global inflation rates (tradingeconomics.com)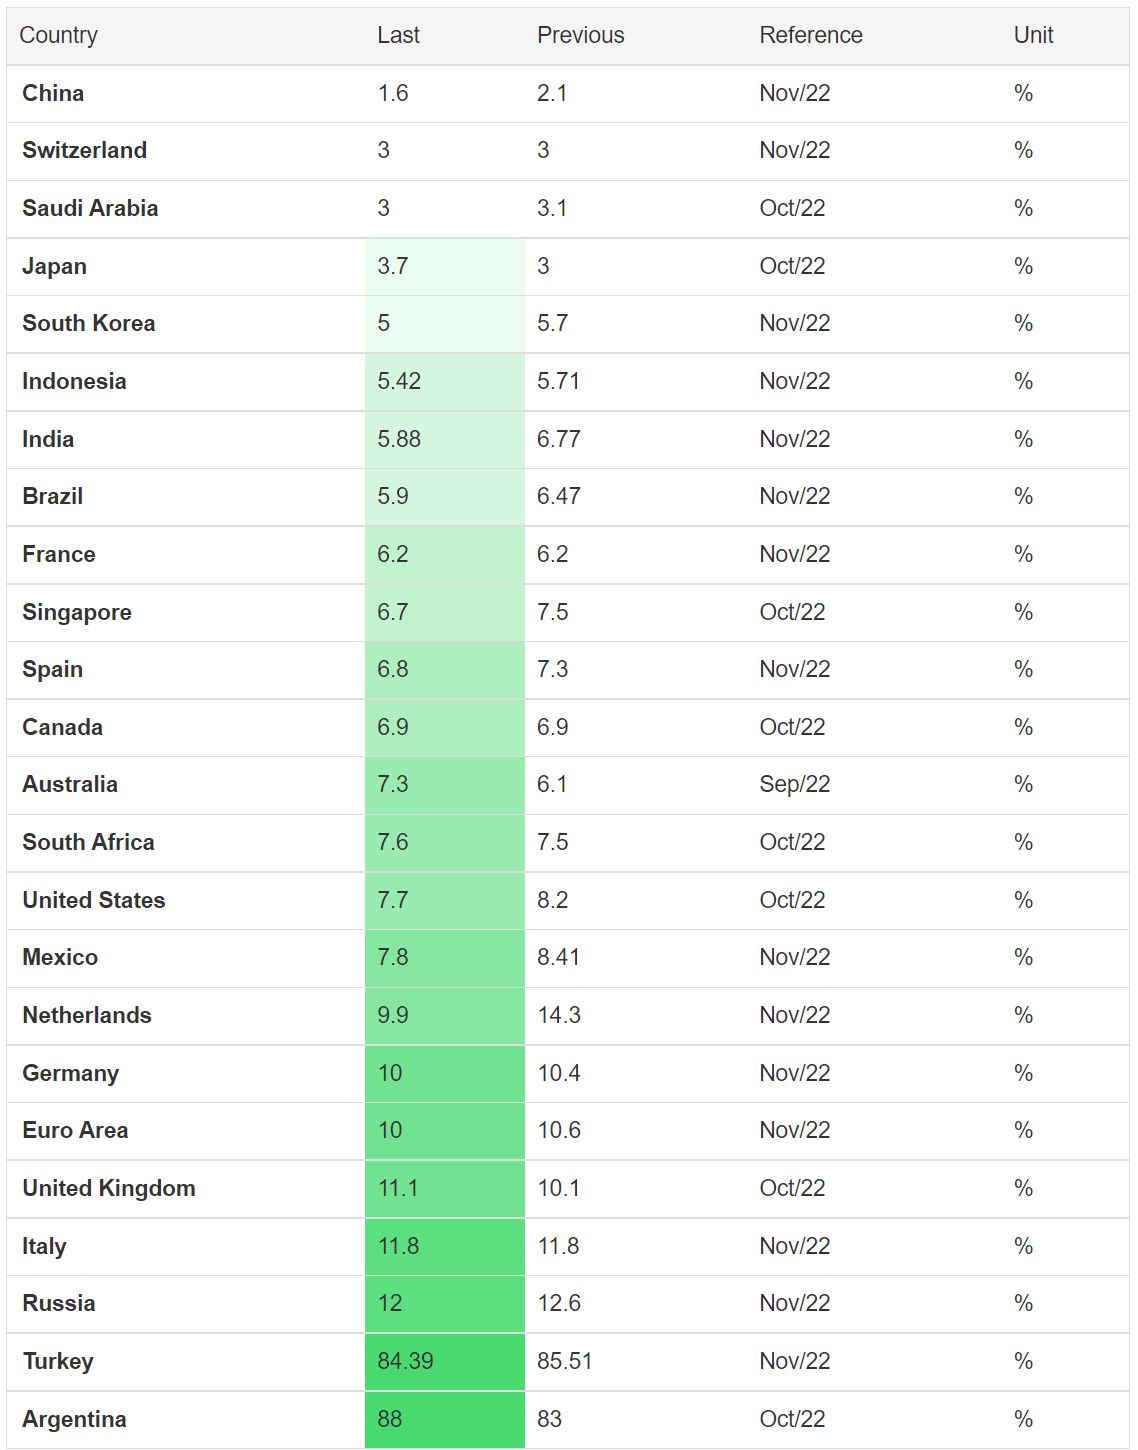
India Is Becoming A Manufacturing Alternative To China
Second, in the medium-term, due to supply-chain disruptions in the last few years, major companies such as Apple Inc. (AAPL) are increasingly diversifying their supply chains and shifting production of key products from China to India and other emerging markets. No doubt, 3 years of draconian Chinese zero-COVID policies factored in these decisions. But more importantly, geopolitics may be playing an increasing part in the decision-making process.
For example, America’s recent export ban of high-end semiconductors to China severely limits the ability of Chinese factories to manufacture leading edge electronics in the coming years. Throw in the threat of a Chinese invasion of Taiwan (and any resulting global sanctions), and it is little wonder that manufacturers are fleeing from China as fast as they can.
Demographics Favour India
Finally, in the long-term, while China’s working age population is set to rapidly decline in the coming years, India’s working age population is forecast to continue to grow and surpass China’s by 2030 (Figure 10).
Figure 10 – Demographic projections between China and India (un.org)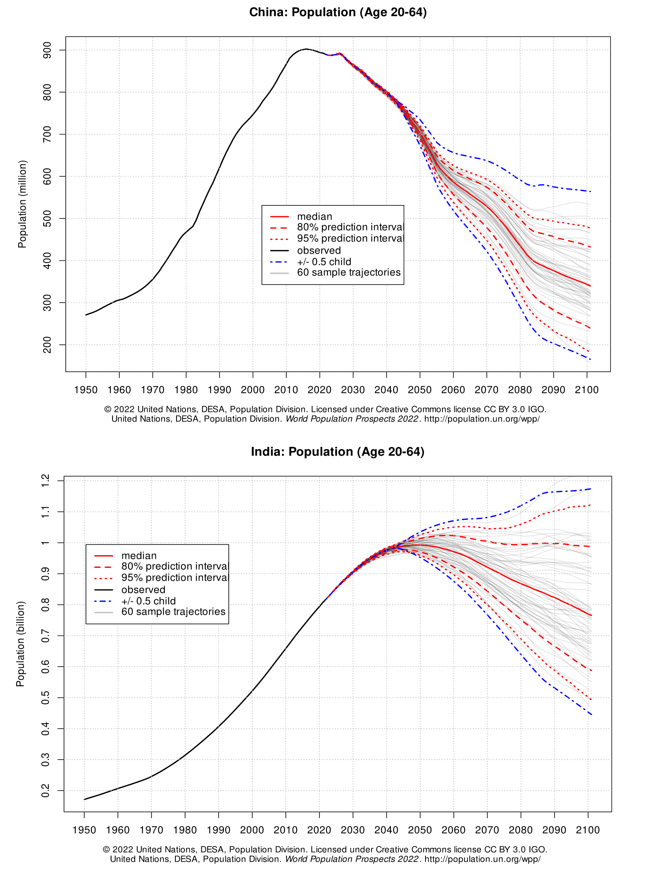
With the world’s largest working age population, India has the opportunity to replace China and become the world’s manufacturing hub.
Risk
The biggest risk to Indian equities is valuation. Looking at the INDA ETF, we see that the portfolio trades at 107x P/E and 3.7x P/B (Figure 11). Both figures are high, especially the price-to-earnings figure.
Figure 11 – INDA portfolio characteristics (ishares.com)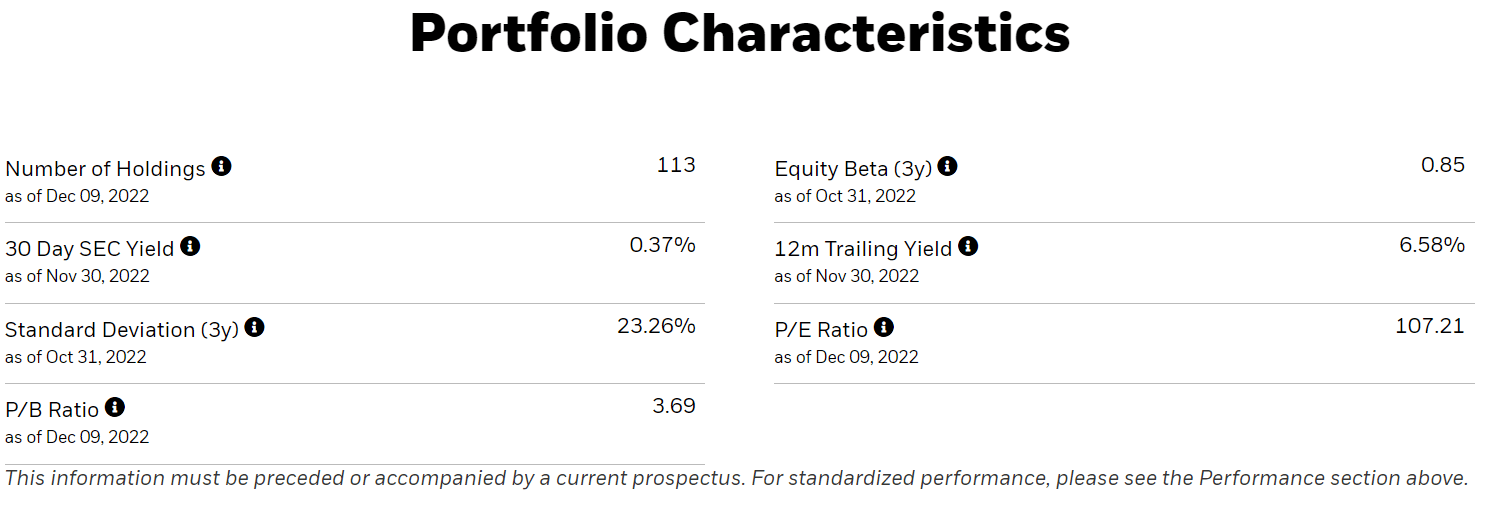
If the world economy enters a recession in 2023, expensive Indian stocks could fall a long way before they get any valuation support.
Conclusion
The INDA ETF provides exposure to large and mid-cap Indian equities. In the short to medium term, Indian companies benefit from access to discounted Russian oil and a desire by global manufacturers to diversify out of China. In the long run, India has one of the best demographic setups for the next few decades as it grows its working age population while former growth standouts like China shrinks.
Be the first to comment