

bymuratdeniz
Canadian stocks are humming along with an impressive seven percentage point-plus outperformance compared to the S&P 500 in 2022. The iShares MSCI Canada ETF (EWC) is down just about 9% this year, and its alpha stems from, in large part, its relatively high Energy sector exposure.
EWC has a whopping 19.5% weight in Energy while SPY has just 5.2% to this year’s best niche. I spotted one impressive integrated name domestic investors might not know about.
Oh Canada! EWC Outpaces SPY In 2022
Stockcharts.com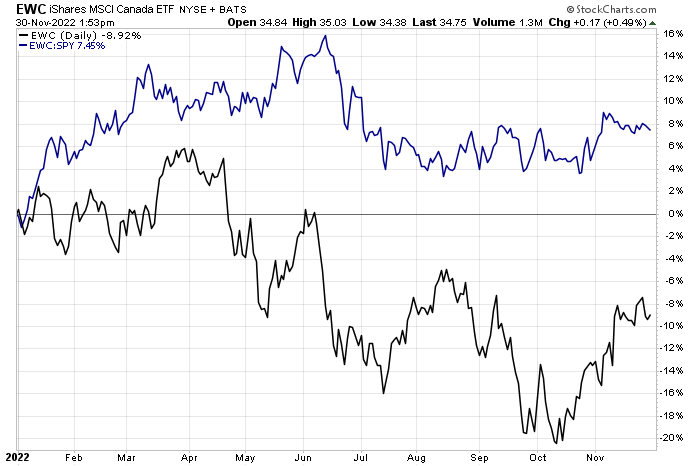
According to Fidelity Investments, Imperial Oil Limited (NYSE:IMO) engages in the exploration, production, and sale of crude oil and natural gas in Canada. The company operates through three segments: Upstream, Downstream, and Chemical segments. The Upstream segment explores for, and produces crude oil, natural gas, synthetic oil, and bitumen. As of December 31, 2021, this segment had 386 million oil-equivalent barrels of proved undeveloped reserves. The Downstream segment is involved in the transportation and refining of crude oil, blending of refined products, and the distribution, and marketing of refined products. It also has transportation activities.
The Alberta-based $34.8 billion market cap Oil, Gas & Consumable Fuels industry company within the Energy sector trades at a low 7.5 trailing 12-month GAAP price-to-earnings ratio and pays a 2.3% dividend yield, according to The Wall Street Journal.
The firm recently beat on earnings and reported a Q3 48.8% rise in revenue from a year earlier. It also hiked its dividend by a whopping 29% while raising FY22 production guidance. Finally, Imperial unleashed a large C$1.5 billion share repurchase program. These are all bullish news items, and the stock is not surprisingly near 52-week highs.
IMO’s strong free cash flow warrants a higher valuation than it has today. BofA likes its downstream position that complements exploration and production activities. In terms of its assets, the company has an ownership stake in one of the newest sands mines in Kearl. Downside risks include obvious exposure to volatile oil prices, unfavorable tax rate changes in Canada, environmental and disaster risks, and a shortage of pipeline capacity.
On valuation, analysts at BofA see per-share profits having soared in 2022. A small EPS drop is expected next year and in 2024, but those are still expected to be healthy profit periods. The Bloomberg consensus forecast is not as optimistic as BofA, though.
Dividends are expected to continue rising at a strong pace, leading to a slightly higher payout rate in the coming years if the stock price is steady. Both Imperial’s operating and GAAP P/Es look good when applying forecast earnings figures while its EV/EBITDA ratio is low compared to the market. Finally, you can see how strong free cash flow is now and in the coming quarters. Overall, I like the valuation.
Imperial Oil: Earnings, Valuation, Free Cash Flow Forecasts
BofA Global Research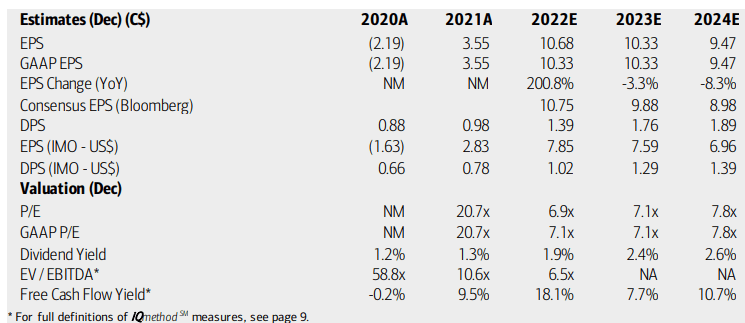
Looking ahead, corporate event data provided by Wall Street Horizon shows an unconfirmed Q4 2022 earnings date of Friday, February 3. Before that, IMO trades ex-div on Thursday, December 1.
Corporate Event Calendar
Wall Street Horizon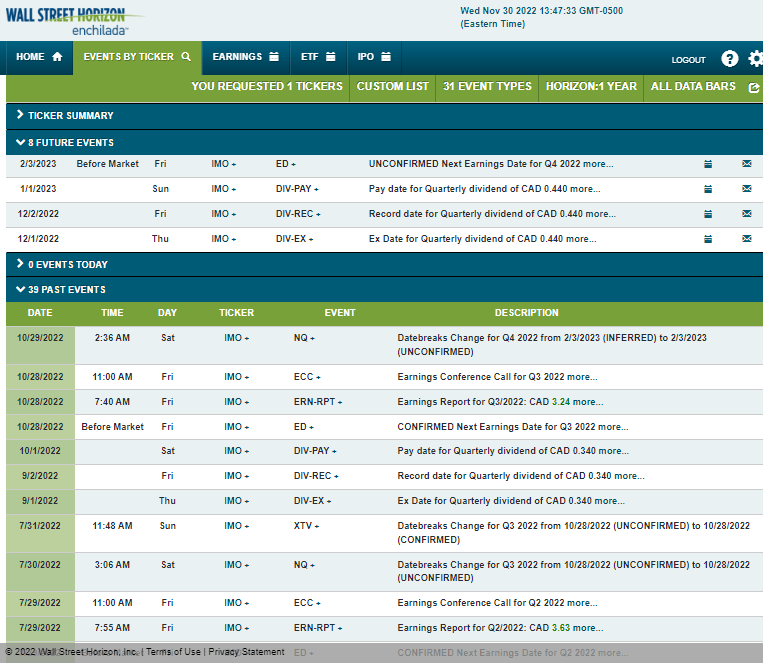
The Technical Take
While still barely below its 2008 all-time high of $63, IMO features a bullish cup and handle chart pattern which, if triggered, would yield an upside price objective to near $80. Notice in the chart below that shares put in a bullish double-bottom pattern after falling sharply off its June peak. That 30% pullback was a great buying opportunity, but a favorable momentum play could be shaping up from the long side.
I see support near the $52 to $53 range, but also notice that there is an old gap that lingers near $50 – that’s another spot that the stock could pull back to. What I also like here is that both IMO’s 50-day and 200-day moving averages are rising – something you do not see much in the market right now. I would go long on a break above $60 from a technical perspective.
IMO: Bullish Cup & Handle Pattern Potential
Stockcharts.com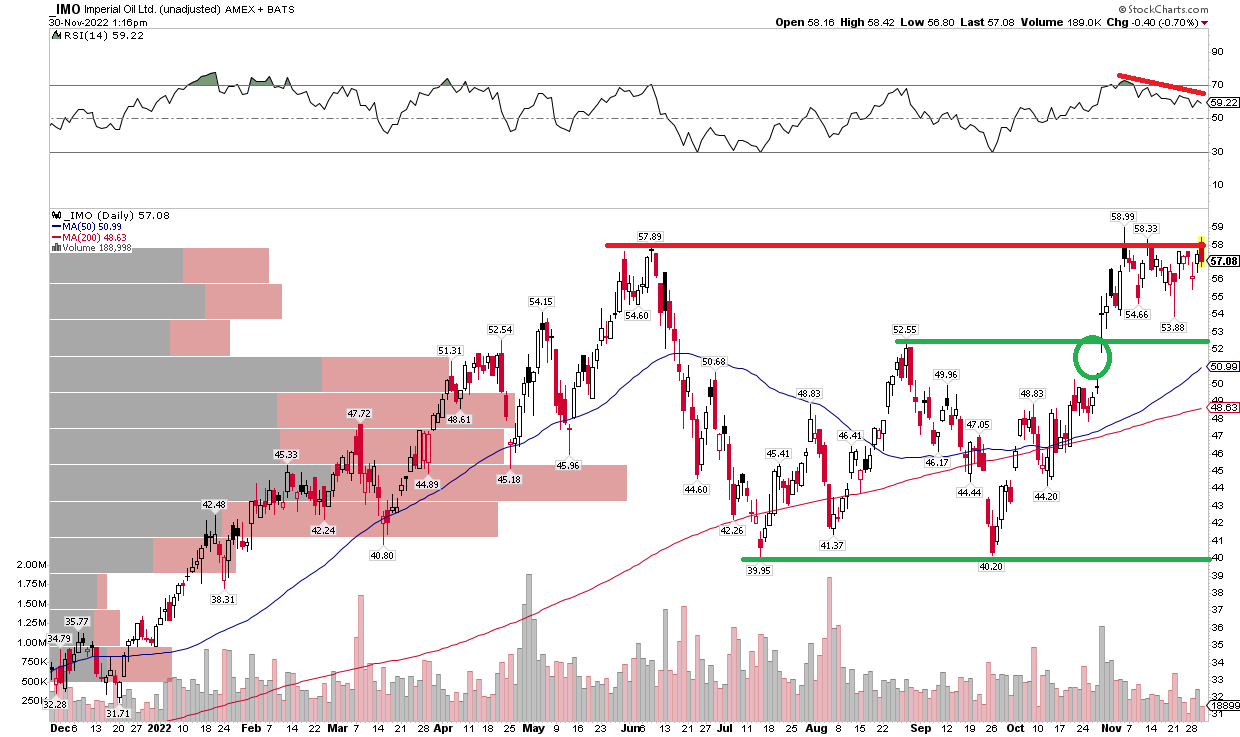
The Bottom Line
Imperial Oil has an attractive valuation, impressive free cash flow, shareholder accretive activities, and a potentially bullish chart setup. I assert taking a long position makes sense.
Be the first to comment