

Falcor
While the general market has been pummeled, with its correction exceeding 26%, the Gold Miners Index (GDX) has suffered the real bear market. This is evidenced by a 53% correction from its 2020 highs. Given that bear markets take time and damage to eradicate bullish sentiment entirely, the more fertile ground for looking for new ideas is in the gold sector, where the 22-month cyclical bear market has ground any remaining optimism to fine dust. So, with the world’s 2nd largest gold producer seeing a significant valuation disconnect, this pullback below US$14.50 is a gift.
Nevada Gold Mines Operations (Company Video)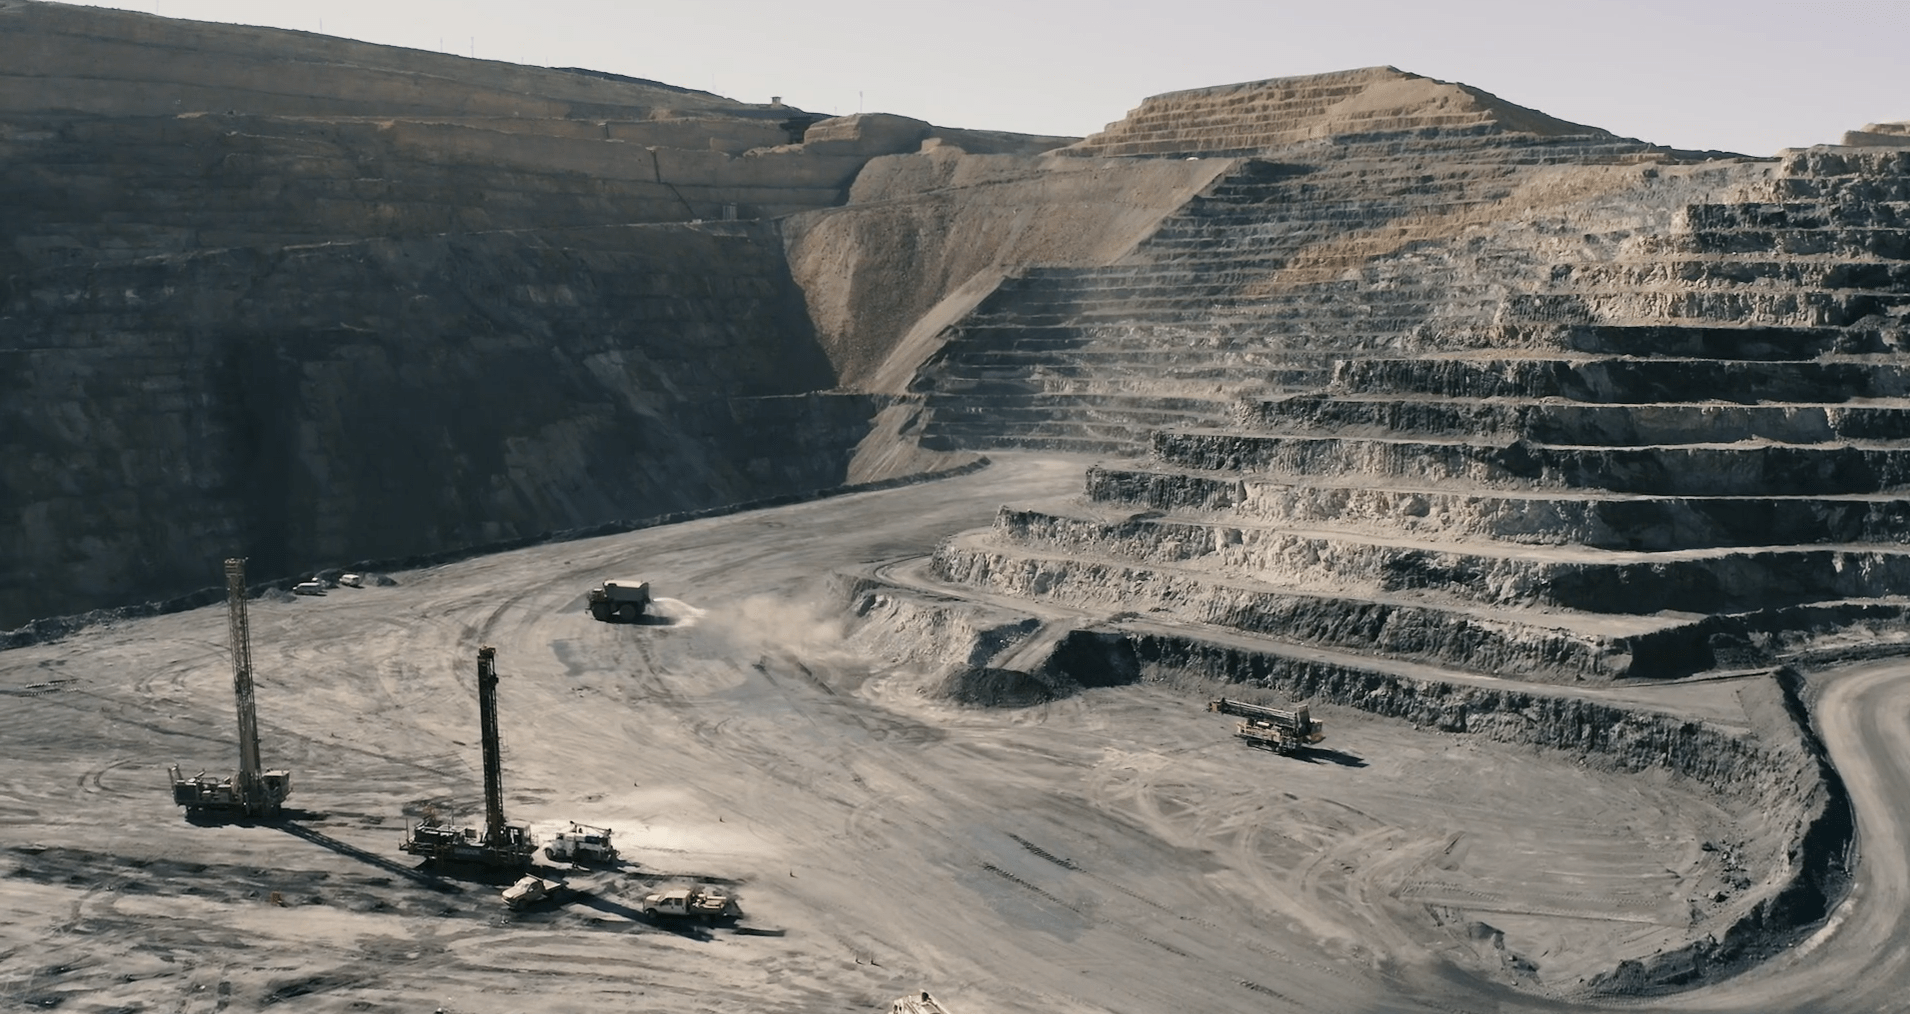
Q3 Production/Sales
Barrick Gold (NYSE:GOLD) released its preliminary Q3 results last week, reporting quarterly production of ~0.99 million ounces of gold and ~123 million pounds of copper. This translated to a 9% decline in gold production year-over-year, while copper production increased 23% year-over-year. The lower gold production was related to the completion of Phase 1 mining in May at Long Canyon (Nevada Gold Mines LLC) and much lower production at Cortez, Turquoise Ridge, Bulyanhulu, and Kibali on a year-over-year basis. The decline in production at these assets was partially offset by higher production at Hemlo, North Mara, and its shared Carlin Complex.
Barrick Gold – Quarterly Gold Production (Company Filings, Author’s Chart)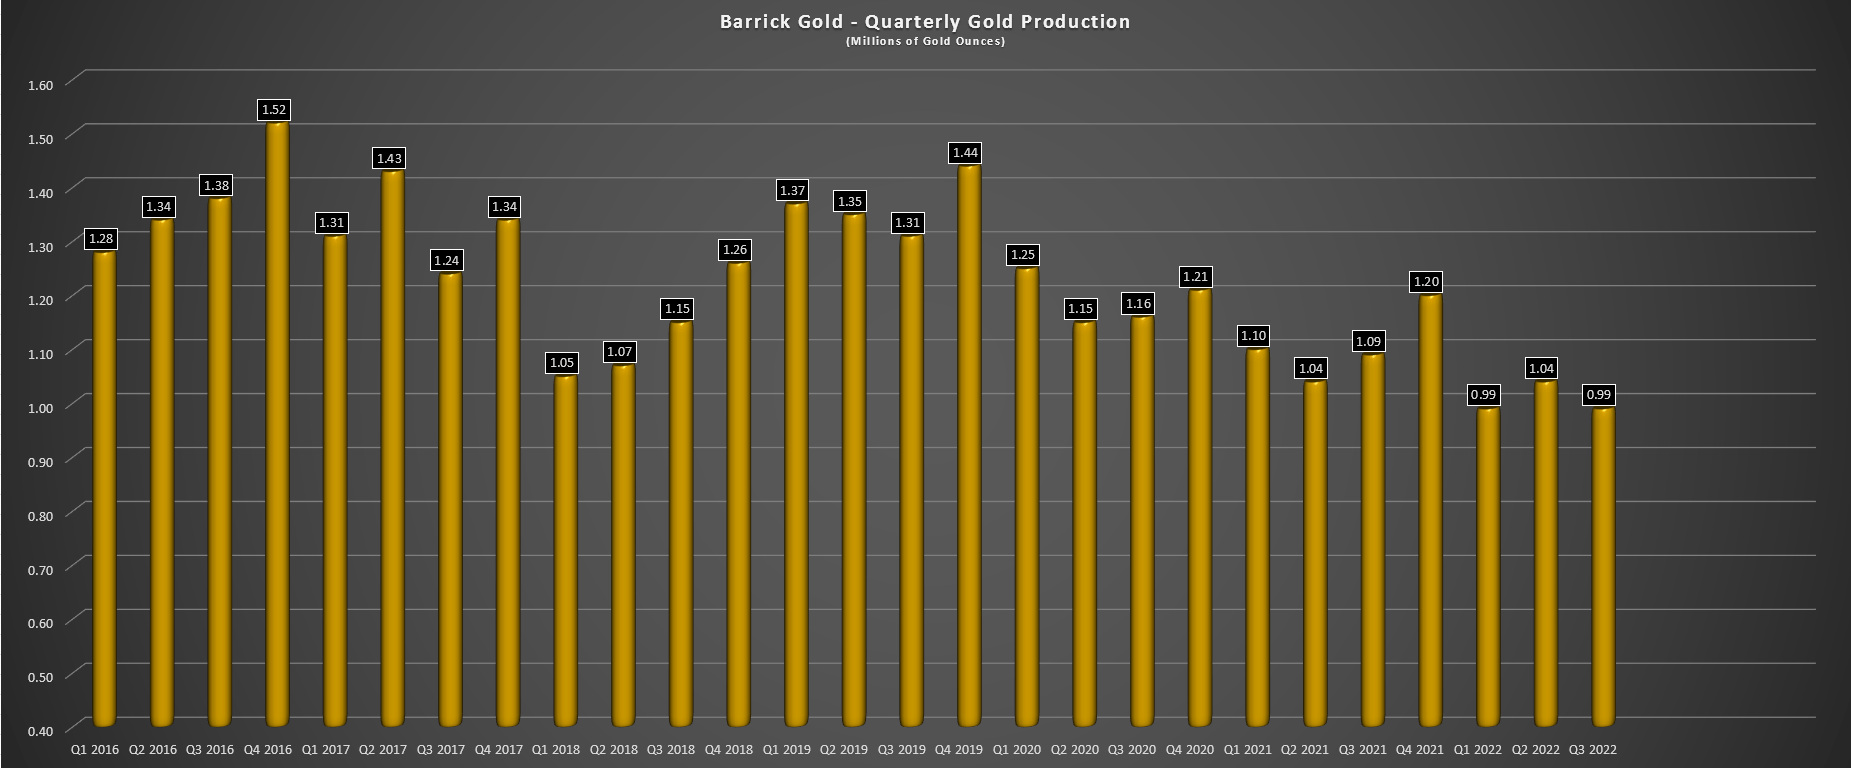
While this trend lower in gold production may look disappointing, it’s important to note that production will increase sharply in Q4, and Q3 is likely to be near a trough production level for Barrick. One asset that has impacted production is Porgera, which is expected to come back online in 2024. Meanwhile, the company should also see a minor contribution from Goldrush (Cortez Complex) in Q4 2023, higher production from its PV Expansion, and higher production at Turquoise Ridge stemming from an upgraded underground fleet and shorter haul distances/improved ventilation with the completion of its third shaft. Looking ahead to Q4 2022, Cortez will benefit from higher oxide grades at Crossroads.
Barrick – Quarterly Copper Production (Company Filings, Author’s Chart)
Looking at copper production, we saw a sharp increase year-over-year, helped by a strong quarter out of Lumwana (82 million pounds produced in Q3). Unfortunately, this was partially offset by higher unit costs due to a higher strip ratio at Lumwana and higher input costs at Zaldivar. When combined with a lower realized copper price due to the impacts of provisional pricing and the recent downtrend in copper prices, this will impact sales and margins on this side of the business. That said, these copper prices are not sustainable long-term in the trend toward electrification we’re seeing, and I see any margin compression here as temporary. Besides, margins are still up sharply on a three-year basis. Let’s take a look at the costs and margins for the gold business:
Costs & Margins
There’s no denying that costs have increased substantially this year for the gold sector, which is the case for many producers in the materials sector (XLB). This is related to inflationary pressures and supply chain headwinds, with higher fuel, cyanide, cement, and steel prices and higher labor costs. The higher costs have been exacerbated by a tight labor market which has driven up contractor costs. Finally, in some cases, producers had to catch up on sustaining capital and exploration after a difficult two years from March 2020 to March 2022, when the goal was to keep operations running smoothly, so many miners were behind due to having difficulty securing labor (COVID-19 exclusions), or simply trying to avoid having crowded sites during a pandemic.
If we combine these rising costs and spiking costs in some cases with a less productive Q1 due to a spike in COVID-19 cases (Omicron), a tight labor market, and a lower gold price, this has been a very unusual year for the industry from a margin standpoint. In fact, one could call this a kitchen-sink year, with nearly everything thrown at these producers, which has led to abnormal margin compression when combined with a lower gold price. The good news for Barrick is that it can run its business even at a $1,250/oz gold price, meaning it has no issue weathering this storm. This is not the case for some producers, like Great Panther (OTC:GPLDF), which is being de-listed, and others with $1,775/oz + all-in costs, like Argonaut (OTCPK:ARNGF) and Iamgold (IAG), that are struggling immensely.
Barrick Gold – Quarterly AISC & AISC Margins (Company Filings, Author’s Chart & Estimates)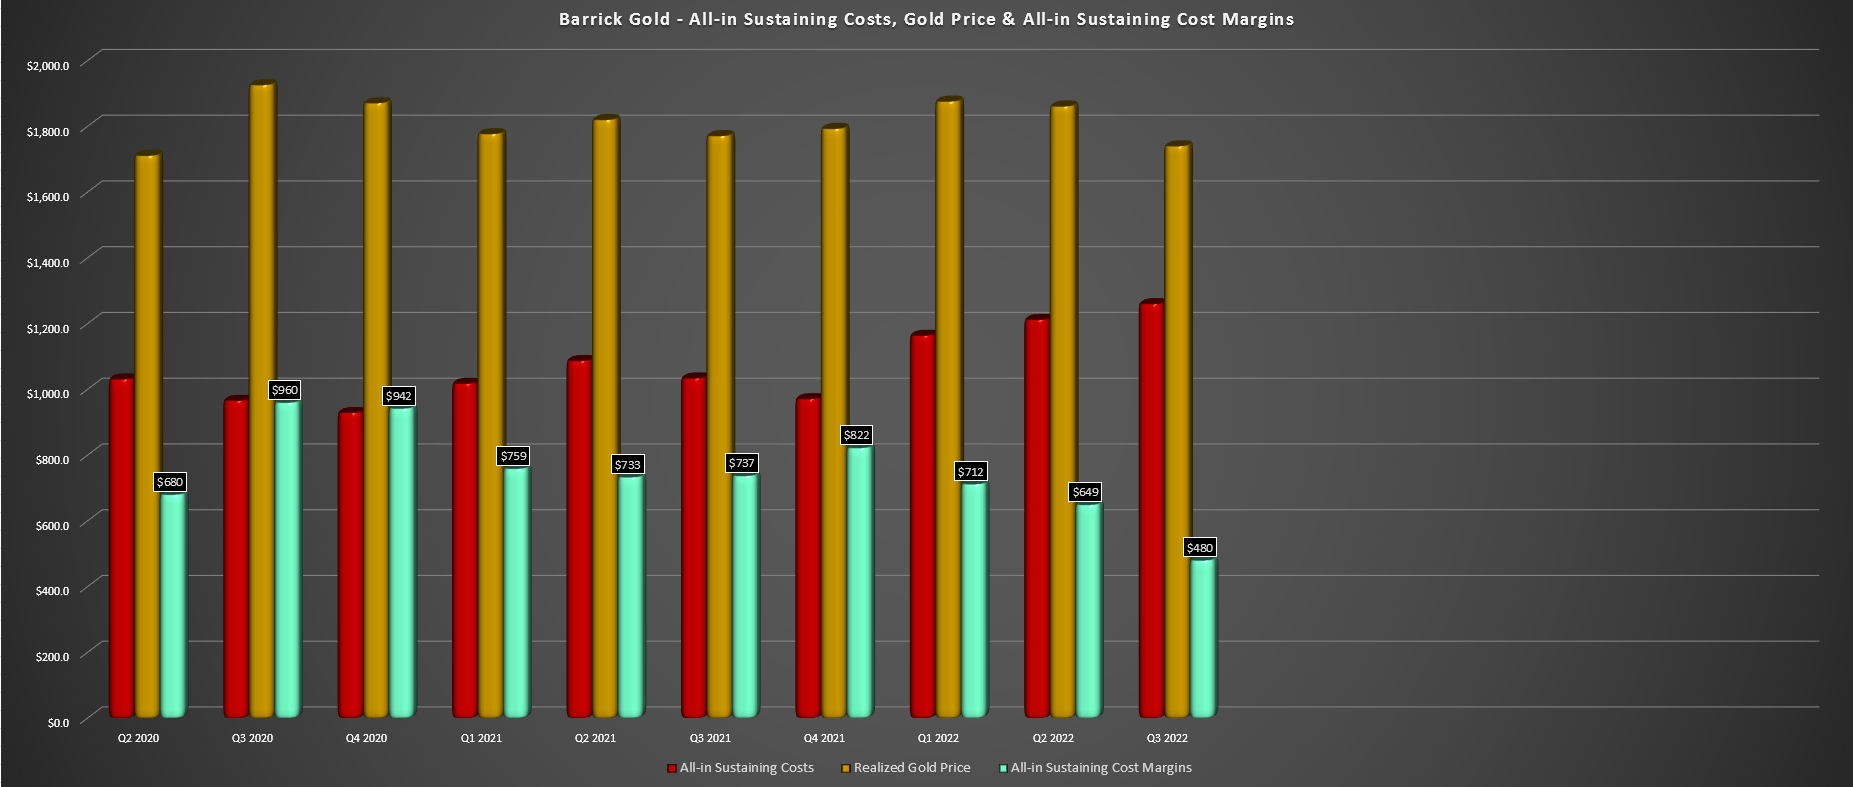
Unfortunately, while Barrick is extremely profitable even at $1,650/oz gold prices, it is seeing margin compression, and we will probably see additional margin compression in Q3. This is based on the weaker gold price, which is likely to come in below $1,750/oz, and all-in sustaining costs [AISC], which should come in at $1,255/oz or higher. Using these assumptions, Barrick’s AISC could dip to $480/oz in Q3 2022, down over 30% year-over-year and more than 25% sequentially. However, I don’t see much value in placing too much weight on quarterly results, especially during a kitchen-sink year and a year of elevated sustaining capital expenditures.
If one peruses social media, there’s no shortage of whining about the gold producers as a whole, nor is there a shortage of Monday Morning Quarterbacks pointing out that costs are rising for Barrick. This is to be expected during a bear market when most investors are frustrated. Still, there’s little value in rear-view mirror analysis or superficial analysis focusing solely on the cost increases without looking at the bigger picture. One key reason these costs are rising at a seemingly alarming rate is that Barrick’s sustaining capital has soared this year and is likely to exceed the top end of guidance ($1.35 billion – $1.55 billion).
Barrick Gold – All-in Sustaining Costs & Attributable Mine-Site Sustaining Capital & Forward Estimates (Company Filings, Author’s Chart & Estimates)
The chart above highlights this (pink bars), which is related to waste stripping at Lumwana and Cortez and infrastructure/equipment related to Cortez Pits and tailings dam construction. At the company’s flagship operation, the shared Carlin Complex, higher sustaining capital is related to the Gold Quarry Roaster’s expansion and the Goldstrike autoclave’s conversion to a CIL circuit. These are not insignificant items and dramatically impact AISC, especially when stripping must be completed with much higher fuel prices than anticipated. Meanwhile, production is lower in FY2022, exacerbating the increase in unit costs.
If $1.60+ billion in annual sustaining capital was the new normal and production had peaked in 2022, and Barrick had a weak pipeline, some of the recent bearish analysis on the stock might make sense. However, this isn’t the case at all. In fact, annual attributable mine-site sustaining capital should dip below $1.37 billion in FY2023 and fall even further to below $1.15 billion in FY2024, a 30% decline from FY2022 to FY2024 levels. At the same time, production is likely to increase to more than 4.7 million ounces in 2024, benefiting from higher production at Cortez (Goldrush), Turquoise Ridge, and Pueblo Viejo. So, not only should FY2022 mark peak costs for Barrick, but it should also mark trough margins, even with the lower gold price.
Barrick Gold – Annual AISC & AISC Margins & Forward Estimates (Company Filings, Author’s Chart)
The chart above helps to illustrate this, which shows that all-in-sustaining costs are likely to decline from $1,195/oz (FY2022 estimates) to sub $1,000/oz in FY2024. Even assuming an average realized gold price of $1,745/oz in FY2023 and FY2024, this would result in a 24% increase in AISC margins from $610/oz (FY2022 estimates) to $760/oz or higher (FY2024 estimates). Given that the market is forward-looking, this makes the valuation disconnect for the stock intriguing, given that the prevailing sentiment from some recent analyses is that margins will continue to decline sharply, which is why the stock apparently must be avoided.
This is clearly not the case unless gold prices are set to crash further, and I would argue much of this negativity is baked into the stock already. Let’s take a closer look below:
Valuation
Based on an estimated ~1,756 million shares outstanding at year-end and a share price of US$14.20, Barrick now trades at a market cap of ~$24.9 billion and an enterprise value of $24.3 billion. This is a very attractive valuation for a company expected to generate $4.2 billion in operating cash flow next year, even at a $1,720/oz gold price assumption. Based on an estimated average share count of 1,745 million shares in FY2023 and $4.2 billion in operating cash flow, Barrick trades at just ~5.9x FY2023 cash flow estimates, a massive discount to its historical multiple of 10.3x cash flow. In my view, this significant discount is unjustified for four reasons:
- the gold price is at the upper end of its historical range
- it’s a much stronger and more disciplined company under CEO Mark Bristow
- it has industry-leading capital returns and a solid balance sheet
- it has a phenomenal development pipeline (Reko Diq, Goldrush/Fourmile)
Barrick Gold – Historical Cash Flow Multiple (FASTGraphs.com)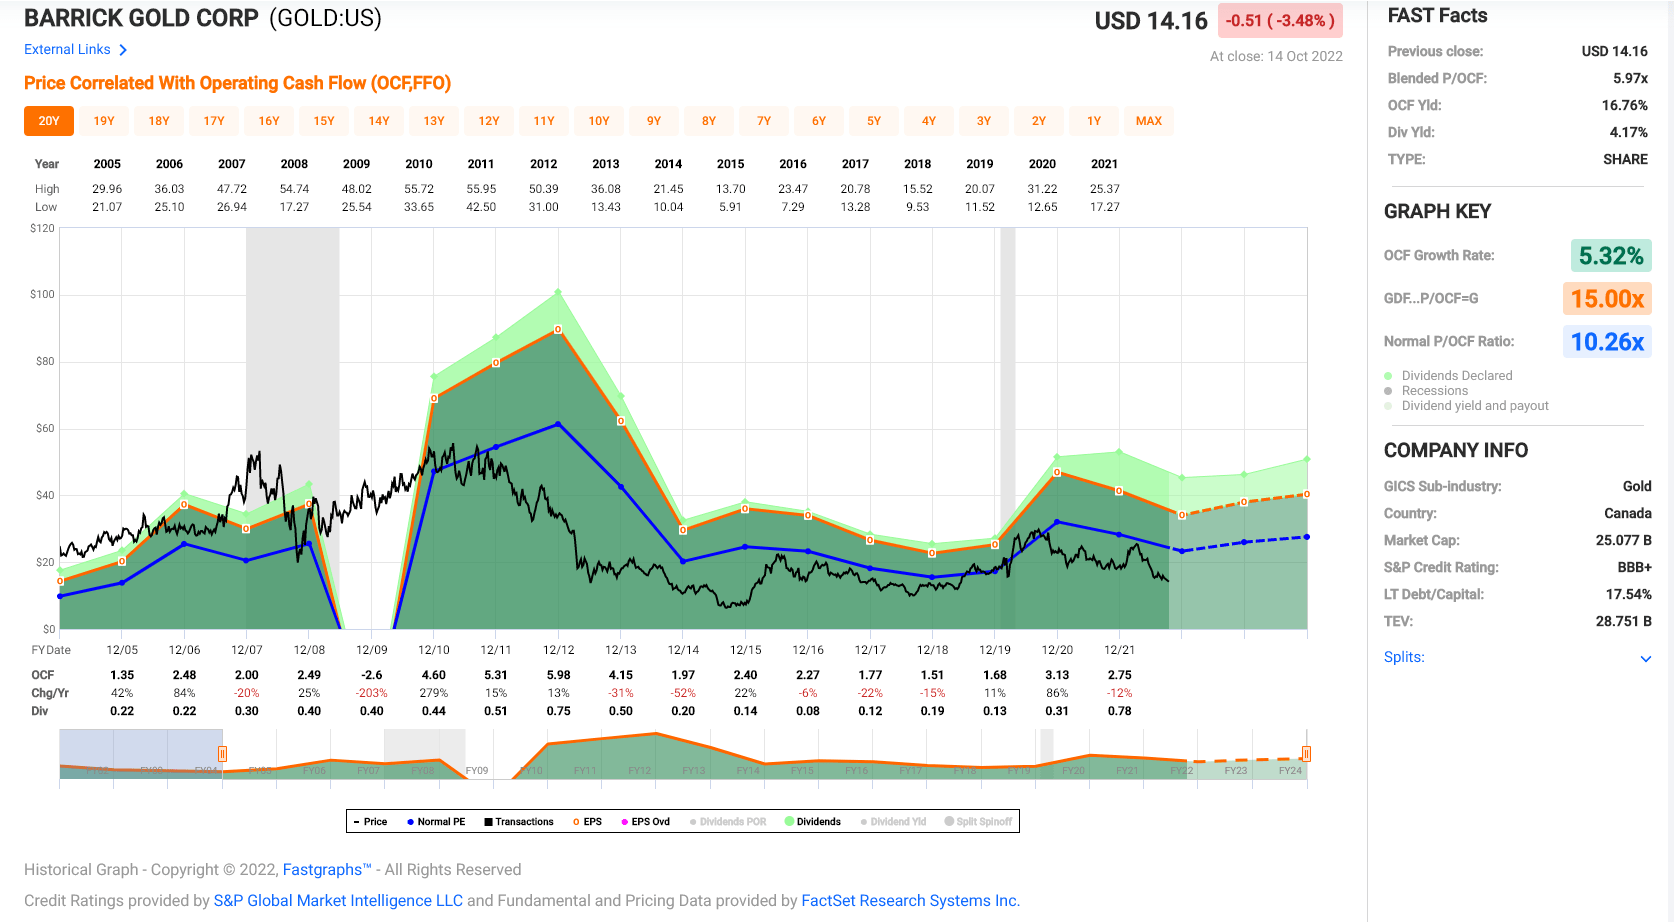
Even if we assume a more conservative multiple of 10.0x cash flow, I see a fair value for the stock of $24.00. However, this multiple on cash flow doesn’t consider projects in the pipeline that won’t contribute to FY2023 cash flow, with these assets better captured from a P/NAV standpoint. Based on an estimated net asset value of $34.4 billion, the stock trades at less than 0.80x P/NAV, also a massive discount when it’s typically traded at a 20% premium to its net asset value. Even assuming a conservative multiple of 1.20x translates to a fair value just shy of $24.00 per share. So, no matter how you slice it, Barrick has more than a 60% upside to fair value, and this upside assumes that $1,750/oz gold prices persist.
Given that the gold price has typically performed its best on a forward 6-month and 12-month return when we have extreme pessimism measured by sentiment (H2 2015, H2 2018, and H2 2022), I believe now is the time to be optimistic about higher gold prices. At the same time, the US Dollar (UUP), which has pinned gold to the mat temporarily, is stretched to the upside, with sentiment rarely being more bullish in the past five years. So, while Barrick should generate at least $2.40 in operating cash flow per share next year, I see a significant upside to this figure if gold prices rebound and further growth in FY2024 as production increases to 4.7+ million ounces (FY2022 estimates: ~4.26 million ounces).
Gold Daily Sentiment (Daily Sentiment Index Data, Trade-Futures.com, Author’s Chart)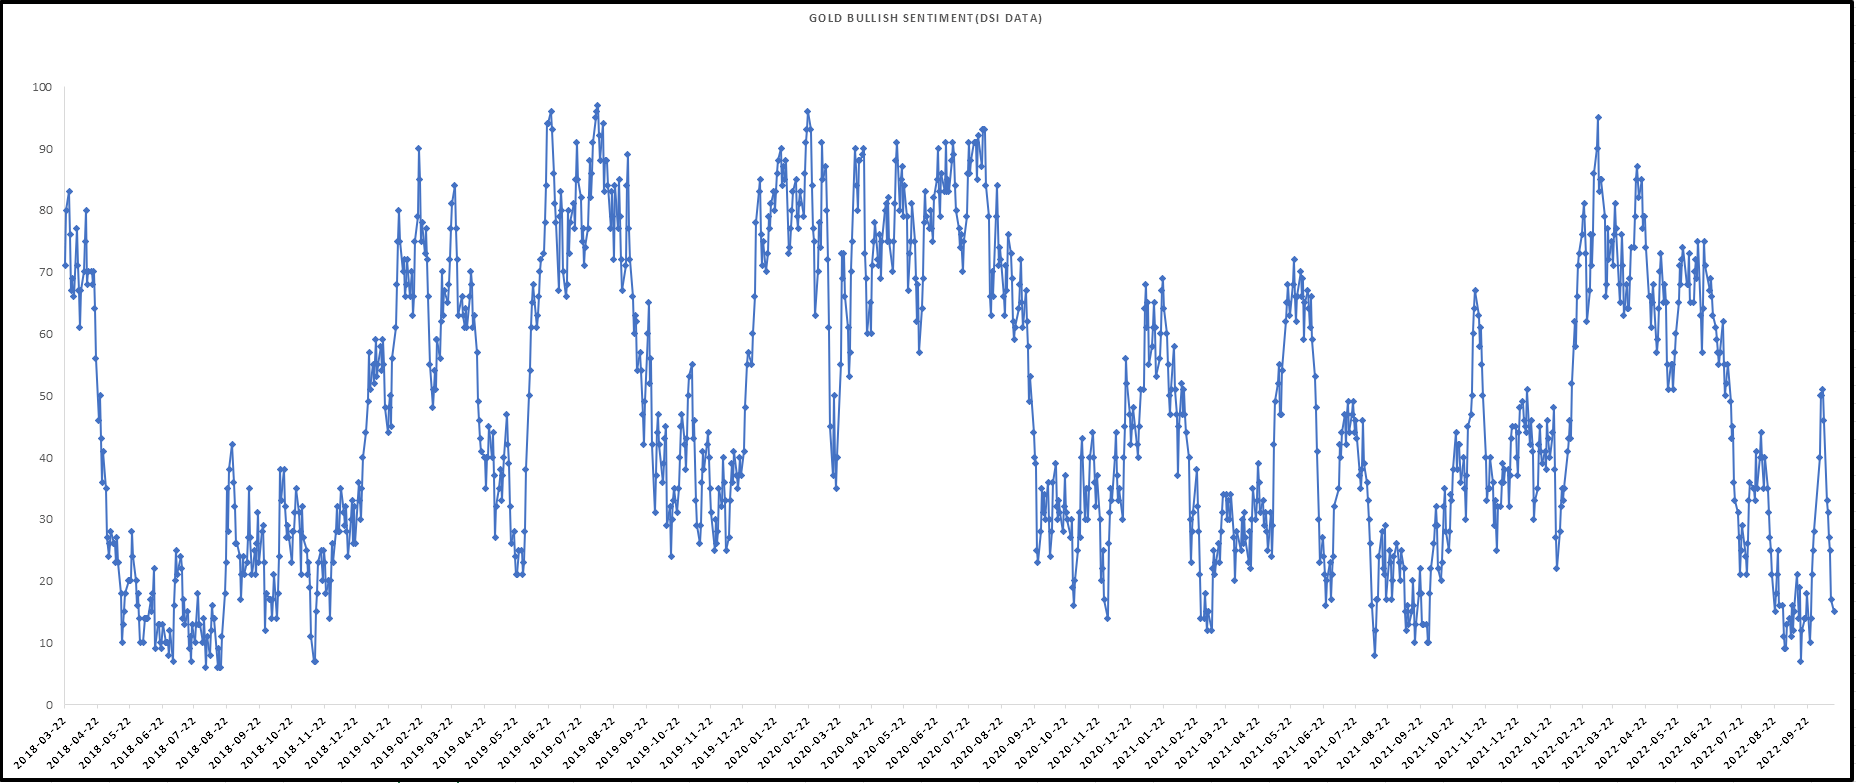
More important than any of these valuation metrics and the gold price outlook is that Barrick is hated, and the best time to buy gold miners is when they’re extremely out of favor. The difference in this cycle is that Barrick is paying a nearly 6.0% dividend yield based on its current framework while returning over 1.0% to shareholders this year with opportunistic buybacks. It also has very strong leadership and has teamed up at its Nevada operations to allow for significant synergies. Hence, investors are being paid to wait for this turnaround with a much stronger company.
Barrick Gold – Net Debt, Free Cash Flow & Dividends Per Share (Company Filings, Author’s Chart)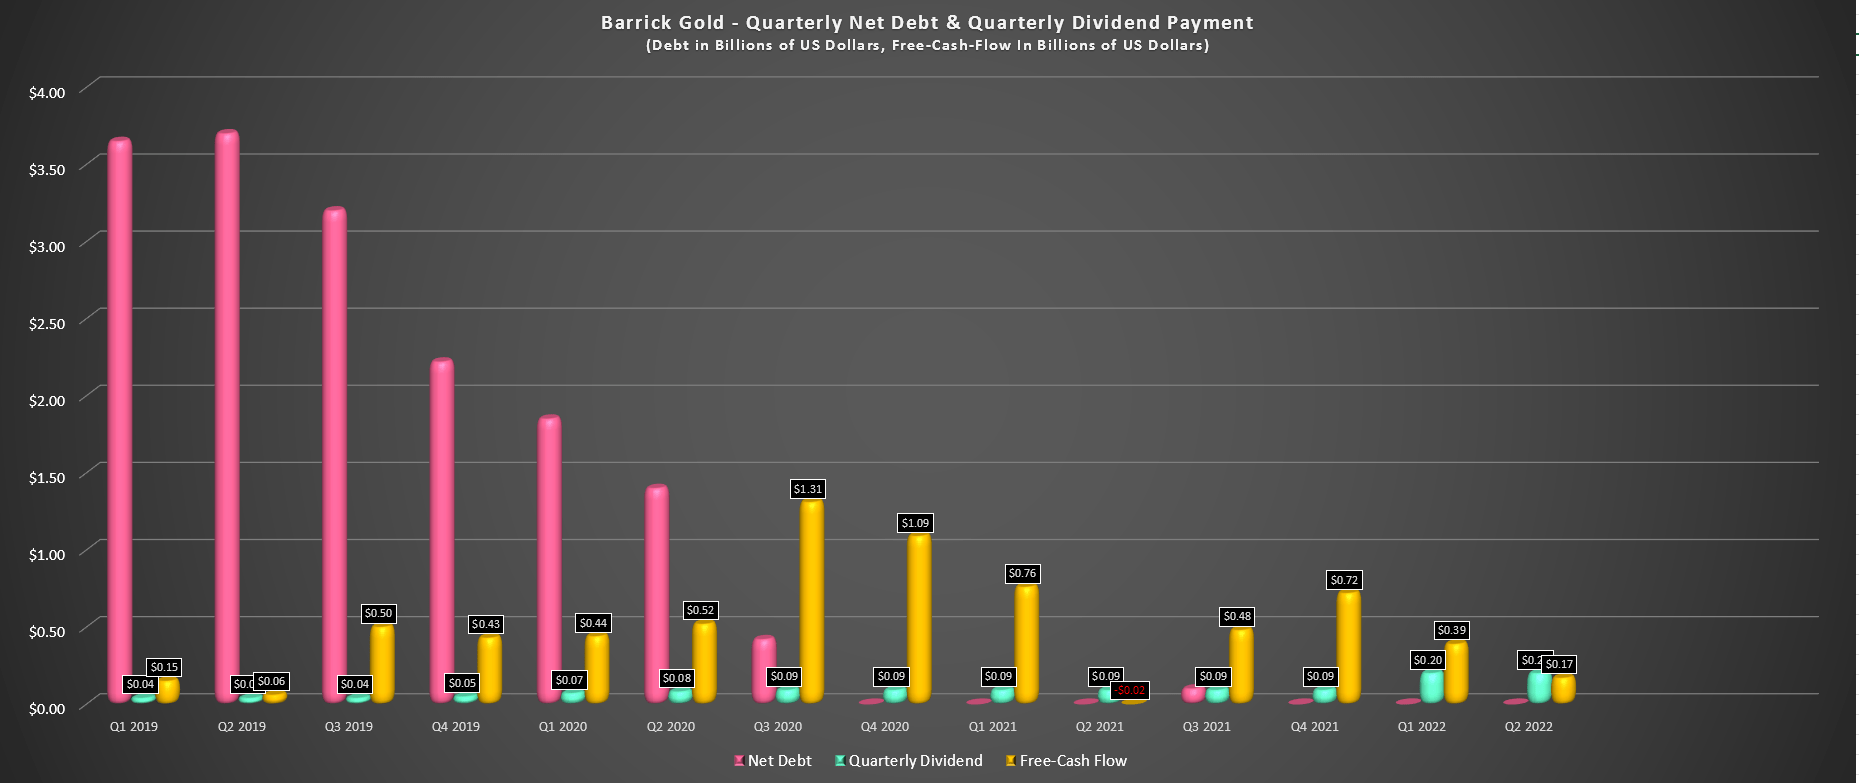
There are no guarantees when it comes to investing, but buying great businesses that are paying high yields when they’re hated is not a bad way to allocate one’s capital.
Summary
Barrick has had a tough year in line with the rest of the Gold Miners Index. However, the combination of lower production and elevated sustaining capital has made the business look much less profitable than it actually is, especially for those doing rear-view mirror and/or superficial analysis. For investors willing to look forward, this is a business that could see a $200/oz drop in costs over the next two years with the benefit of much higher production, reduced impact from spiking commodity prices, and a sharp decline in sustaining capital after a peak year in 2022. So, at ~0.80x P/NAV and ~5.7x FY2023 cash flow, this pullback has offered a fire sale on the stock, which is exactly the time investors should be open-minded to start new positions.
Be the first to comment