

shapecharge
The market is up 4% in the last two days, which should not surprise long-term investors. 80% of the best daily gains come within 2 weeks of the worst daily losses.
FactSet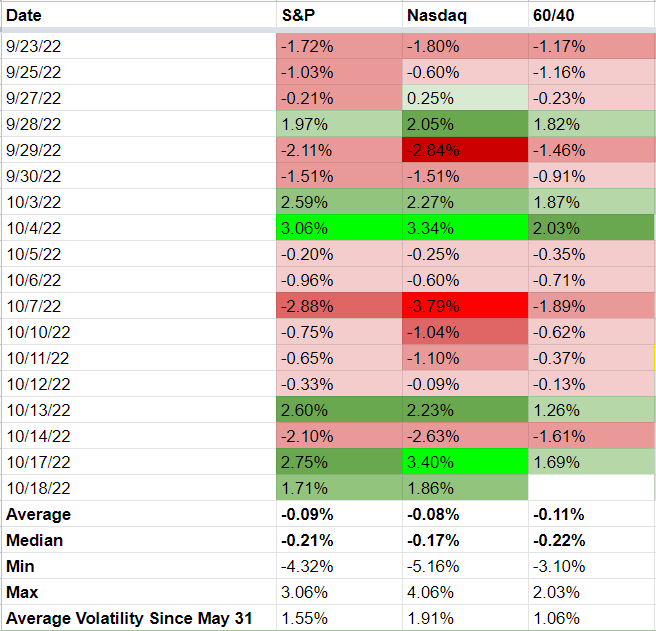
Since May 31st alone, we’ve seen the market rise soar by 3% in a day, and crash 4.3%. The Nasdaq has risen as much as 4% in a day and fallen as much as 5.2%.
Naturally, after a 9.5 month sell off that has seen the S&P fall as much as -27.5%, investors want to know if this rally is the start of the next bull market, or just the 7th bear market rally.
Mike Wilson, Chief Investment Officer for Morgan Stanley, just updated his company’s model and here’s what he thinks.
- inflation has likely peaked
- bond yields are likely close to or at peak (and set to start falling soon)
- Q3 earnings are likely to be strong
- Q4 is when 2023 guidance will suck
- the historical post-election/year end rally is likely to be strong
- up to 18% (4,150 on the S&P)
- this will be the 7th out of 8 or 9 bear market rallies before we truly bottom
- at 3,000 to 3,200 on the S&P 500
- potentially in five to eight months.
Thus far in 2022, Mr. Wilson and the team at Morgan Stanley have been some of the most accurate economists and analysts on Wall Street, but this is just the base-case for a wide range of possible outcomes.
Morgan Stanley isn’t trying to time the market and neither should you. Why?
Charlie Bilello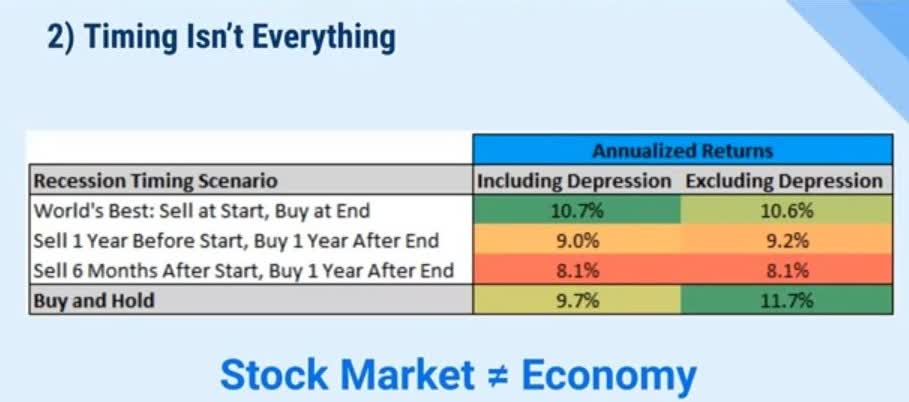
Because, even if you knew the exact start and end dates for every recession since 1929, if you exclude the Great Depression, you would have been better off buying and holding the stock market.
And that assumes perfect economic timing, which no one can do.
Here’s what you risk if you try to time the market.
Bank of America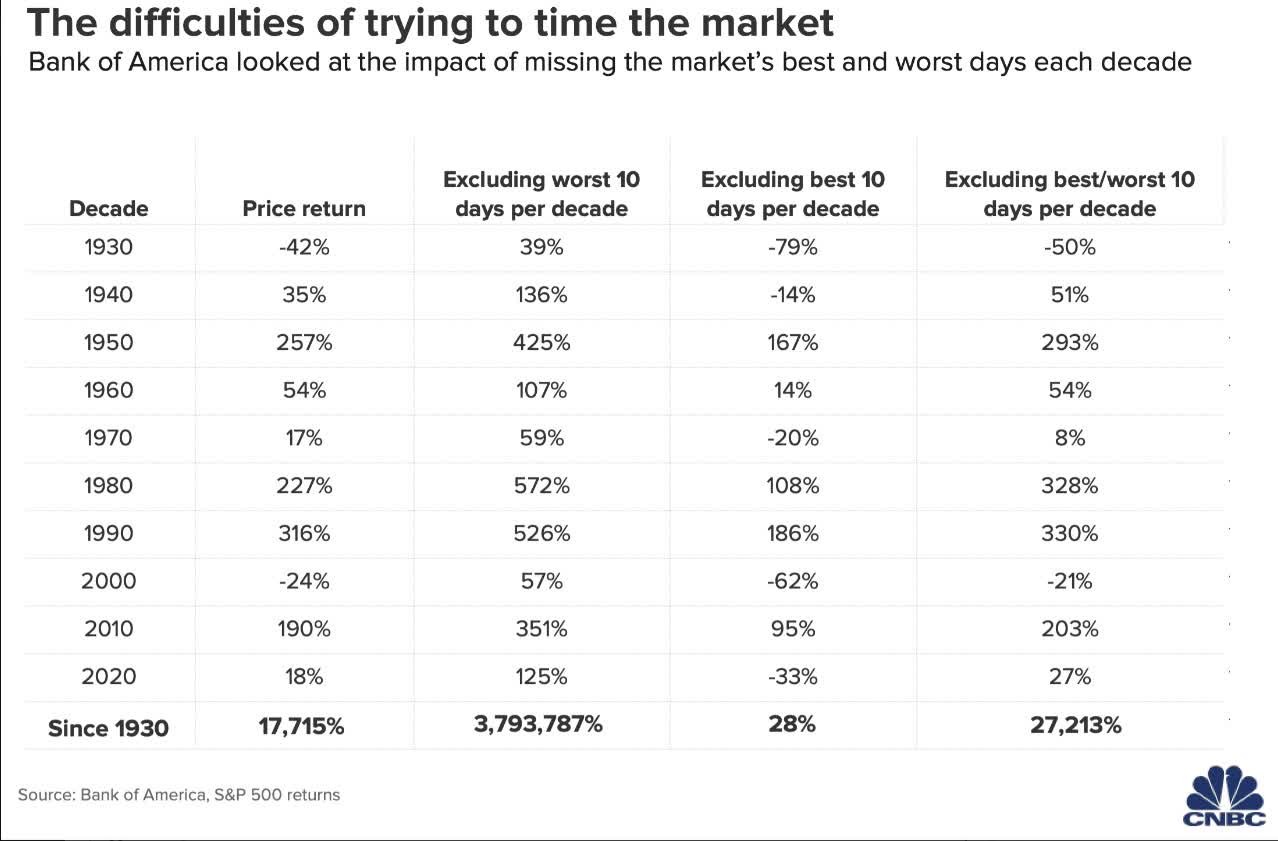
Miss just the 10 best single daily gains of each DECADE and you risk missing out 99.84% of the market’s long-term gains.
Adjusting for inflation, that means risking a 94% loss over almost a century in which the market has minted countless millionaires.
JPMorgan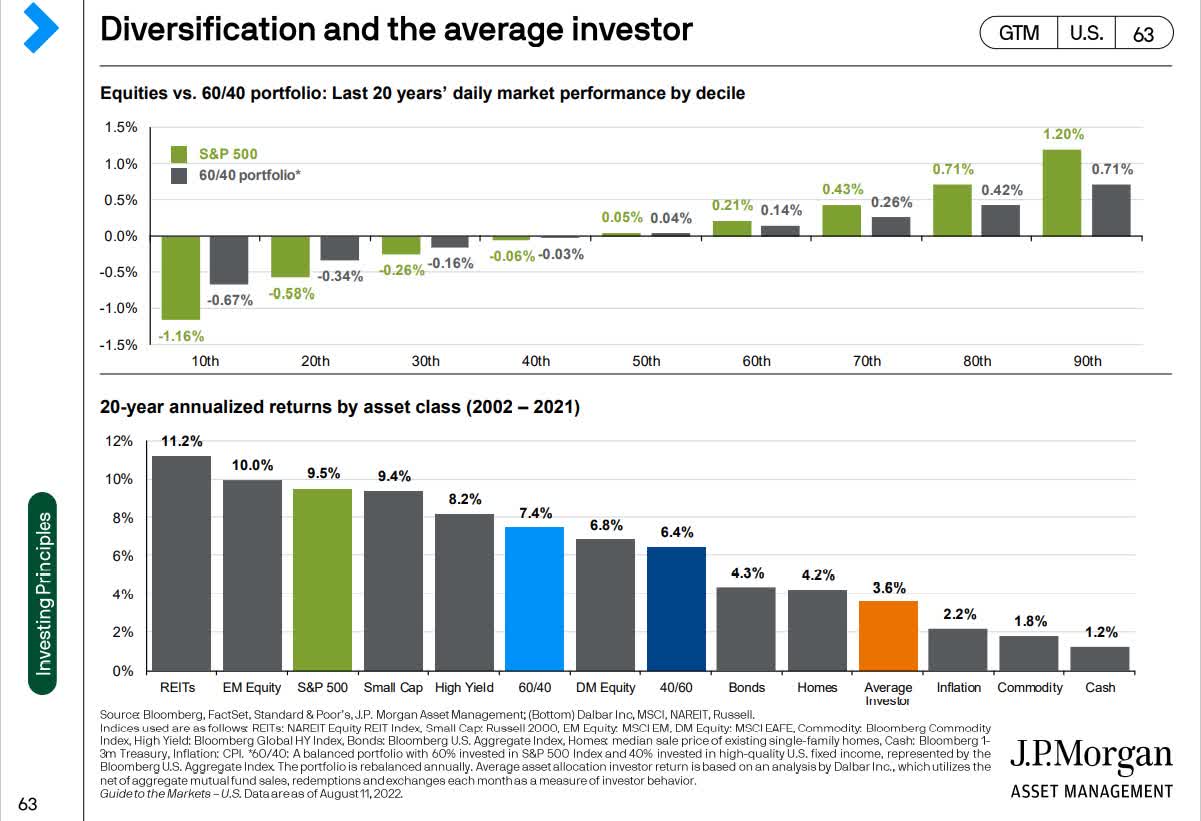
This is what market timing has gotten the average investor for the last 20 years. They underperformed the market and even a 40/60 stock/bond portfolio by a wide margin.
Dalbar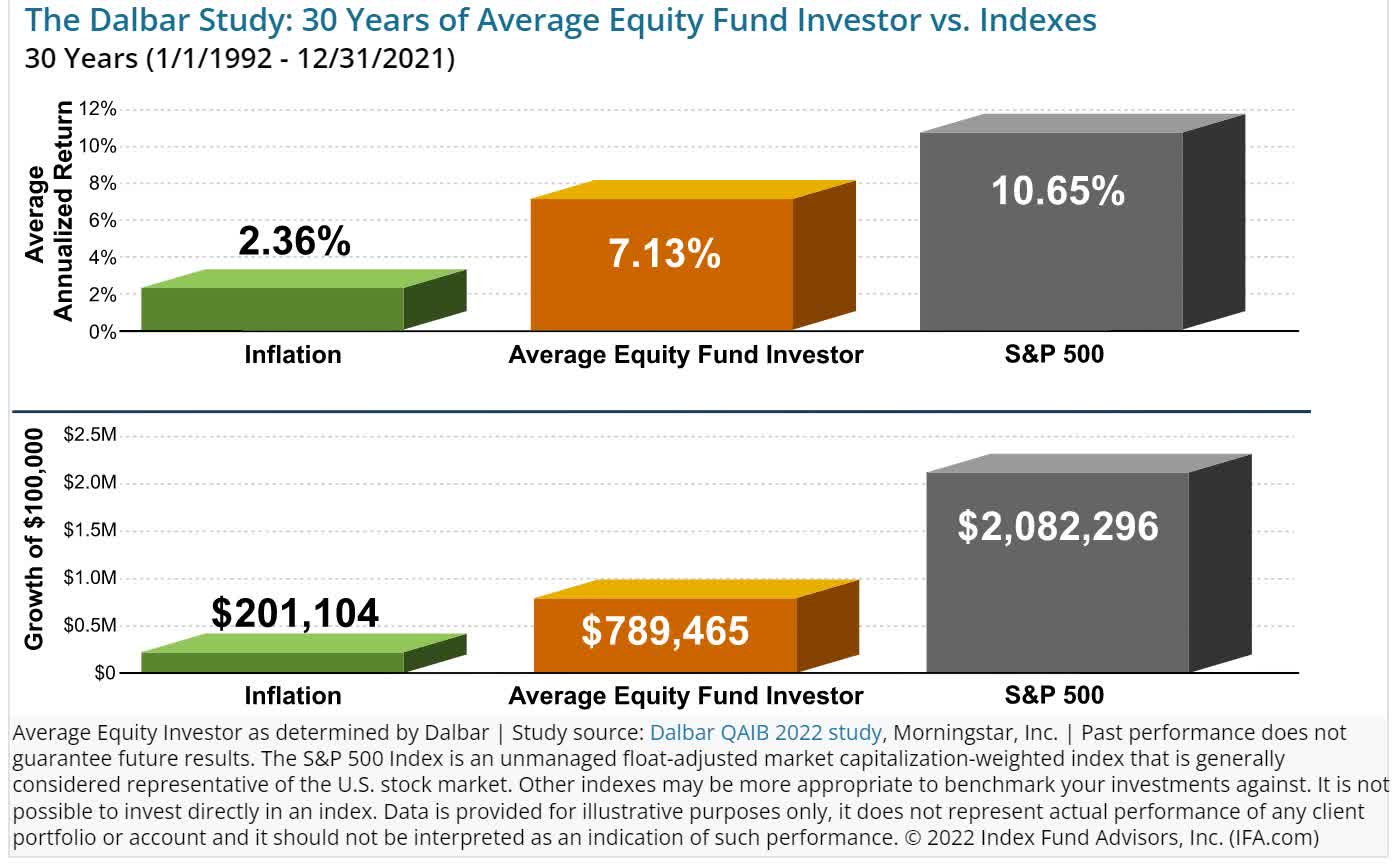
Over the last 30 years, the average investor has underperformed a bit less, but still left $1.3 million on the table for every $100,000 invested.
And guess what? Not only is market timing impossible for 98% of people, but it’s not necessary.
Ben Carlson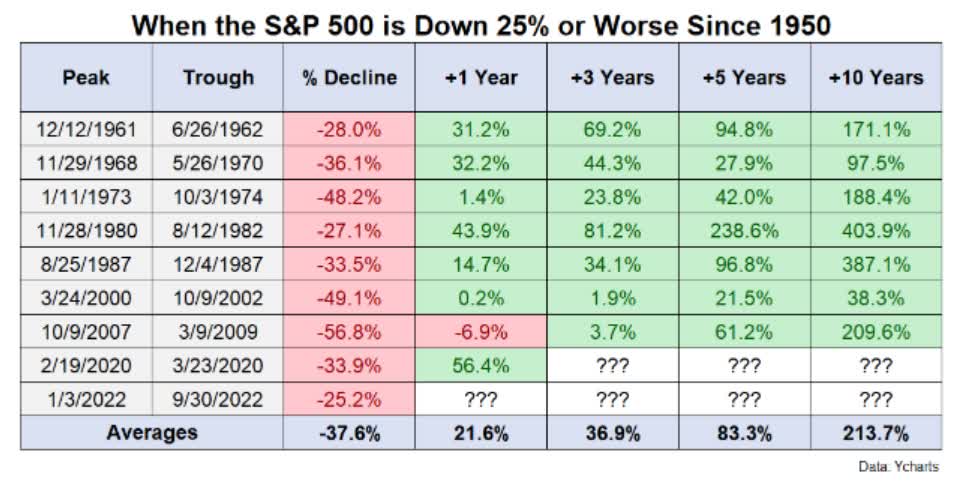
If you buy stocks when the market hits -25% you will make a lot of money, it’s just a matter of time and patience. Do stocks usually fall more in the coming weeks and month? Yes, and it doesn’t matter to your retirement.
If you ignore the short-term, when luck is 25X as powerful as fundamentals, and focus on the long-term, when fundamentals are 33X as powerful as luck, you will get rich.
- time in the market makes you rich
- market timing puts your retirement in the ditch.
Today I wanted to highlight seven of my favorite high-yield blue-chips. The ones I’m buying in this bear market, and you might want to consider buying as well.
Plan Your Buys And Buy Your Plan
We created the Dividend Kings Correction planning tool for these reasons:
- so members can see what I’m buying in every correction in real time
- including how much of each company
- so you can create your own correction plan and build the optimal portfolio for your needs.
Dividend Kings Correction Planning Tool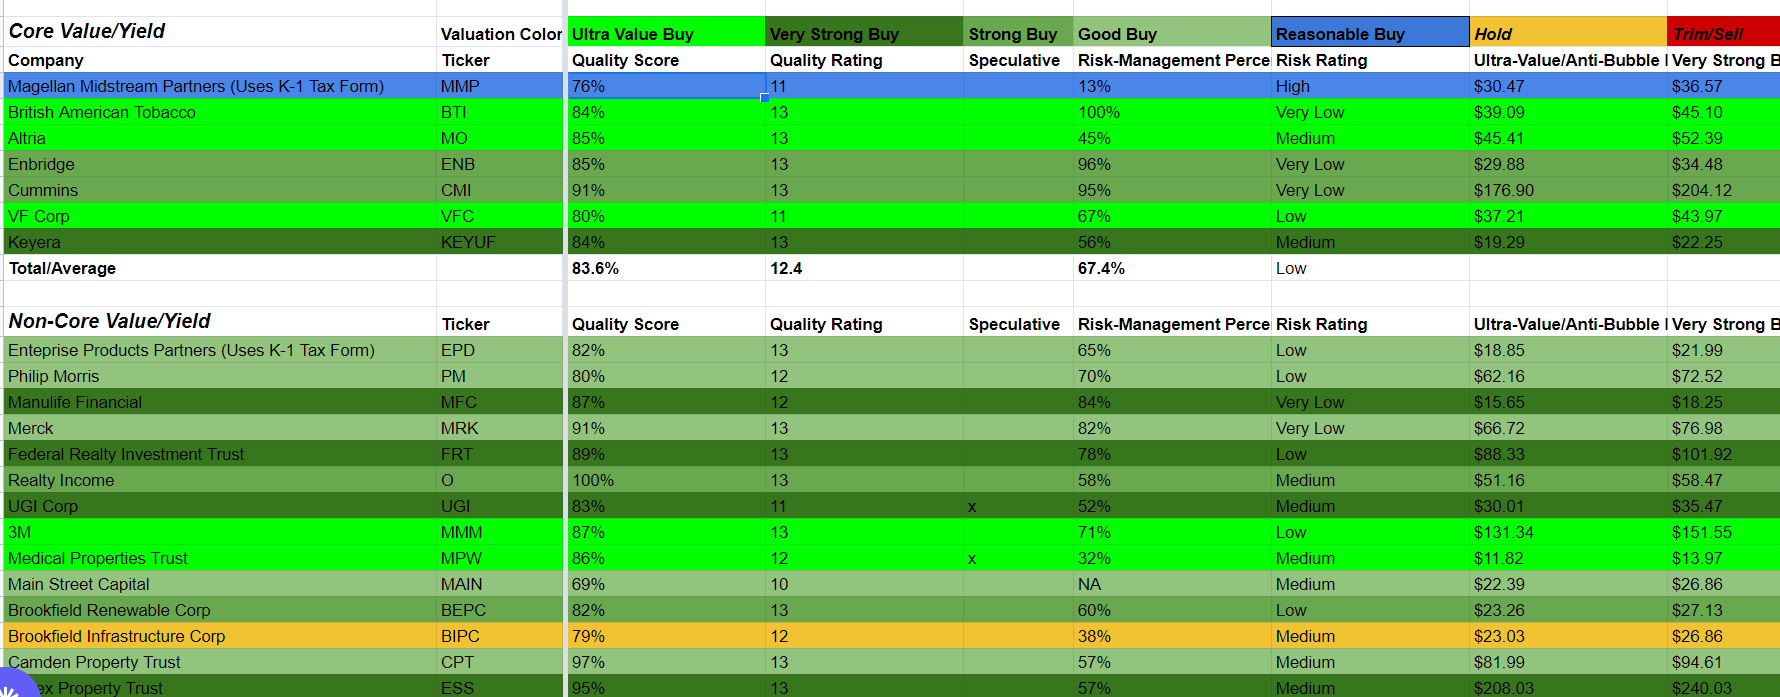
Five time in this bear market I have pulled the trigger on my correction plan, and sent out email notifications to members about what I was buying.
- core holding: my top priority companies
- non-core: what I buy when I have the extra savings.
I invest half my correction savings into high-yield blue chips and the other half into growth stocks, including hyper-dividend growers like LOW, MA, and QCOM:
- high-yield + hyper-growth = maximum income growth and retirement income
- about 25% CAGR dividend growth in my case for my correction planning list
- on top of almost 5% yield.
Five times, including when Russia invaded Ukraine, I didn’t have to think about what to do, I just had to follow my plan.
Dividend Kings Correction Planning Tool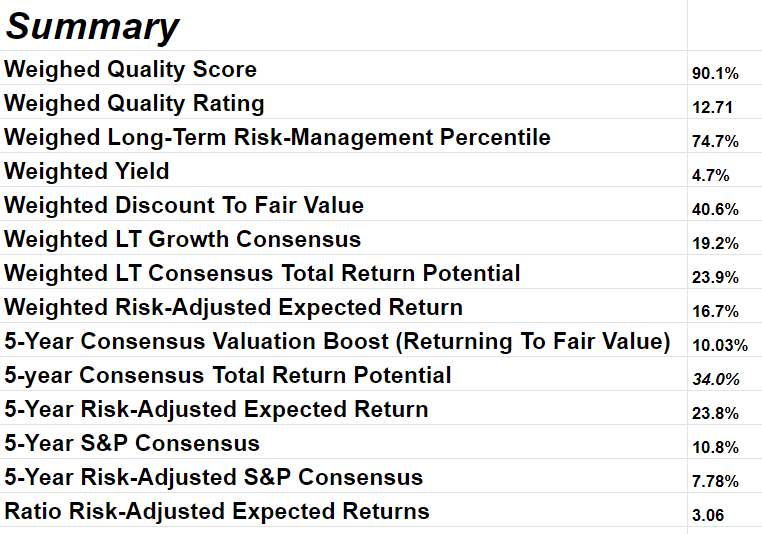
When the market is panicking, the last thing you want to do is think about what to do. With the right plan, personalized for your needs, you can act decisively and with confidence. And that’s how you can profit from every single market downturn, whatever the cause.
That’s how I put all my correction savings to work, and today I wanted to share my 7 top high-yield blue-chip bargains for this bear market.
These are my core 7 high-yield blue-chips that I trust the most to help me, and you, to retire in safety and splendor.
7 High-Yield Blue-Chip Bargains I’m Buying And So Should You
I’ve linked to articles providing a detailed explanation of each company’s investment thesis, growth outlook and risk profile.
(Source: Dividend Kings Zen Research Terminal)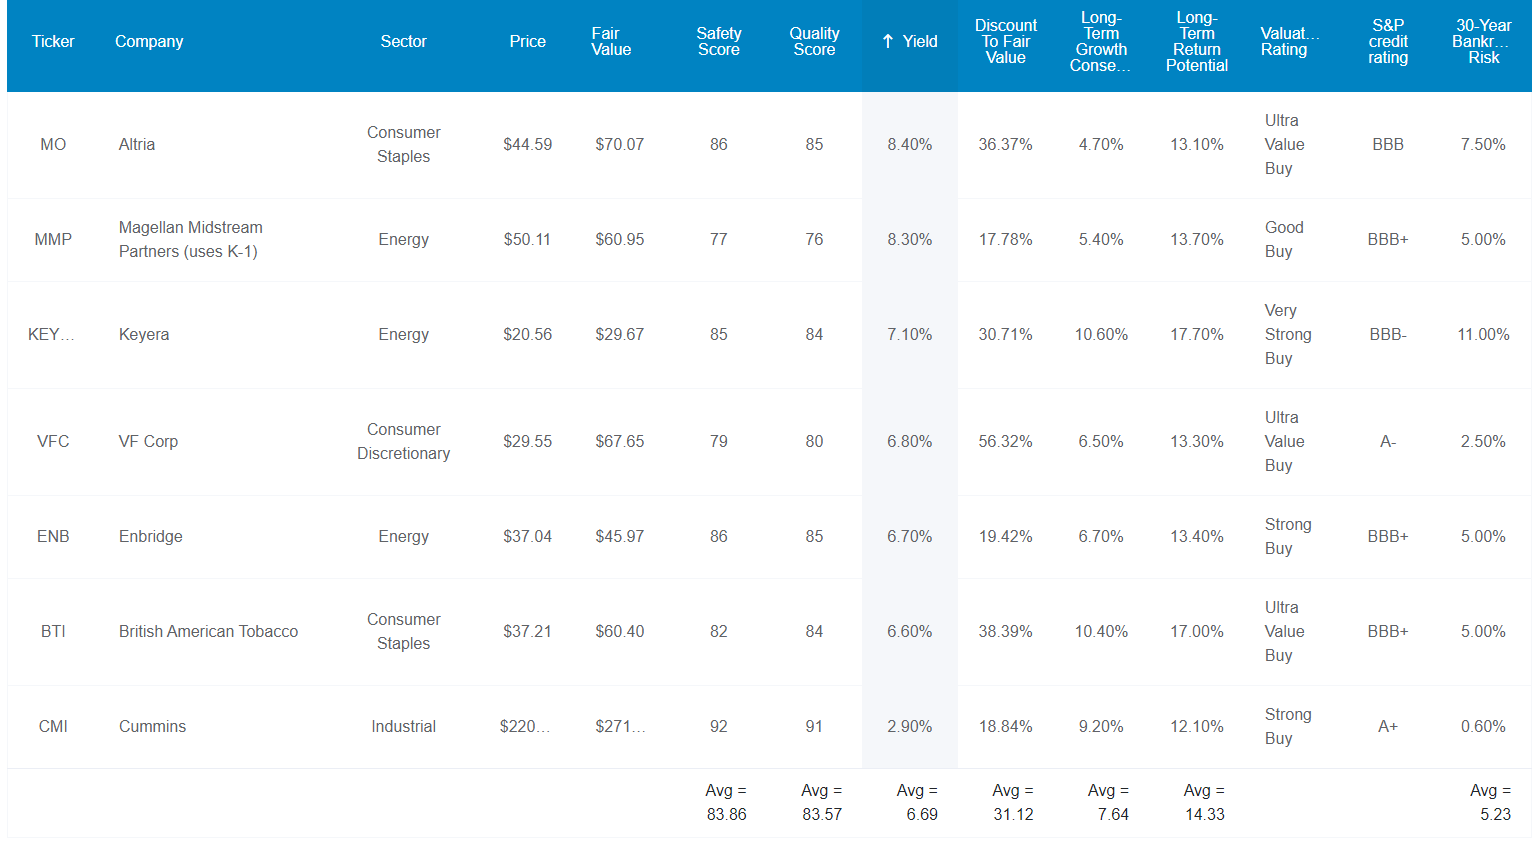
Here they are in order of highest to lowest yield.
- Altria (MO)
- Magellan Midstream Partners (MMP) – uses a K1 tax form
- Keyera (OTCPK:KEYUF)
- VF Corp (VFC)
- Enbridge (ENB)
- British American Tobacco (BTI)
- Cummins (CMI)
Tax Implications
- KEYUF and ENB are Canadian corporations (no K1, qualified dividends)
- 15% dividend tax withholding in TAXABLE ACCOUNTS ONLY
- none in retirement accounts
- tax credit available to fully recoup the withholding in taxable accounts
FAST Graphs Up Front
Altria 2024 Consensus Total Return Potential
(Source: FAST Graphs, FactSet)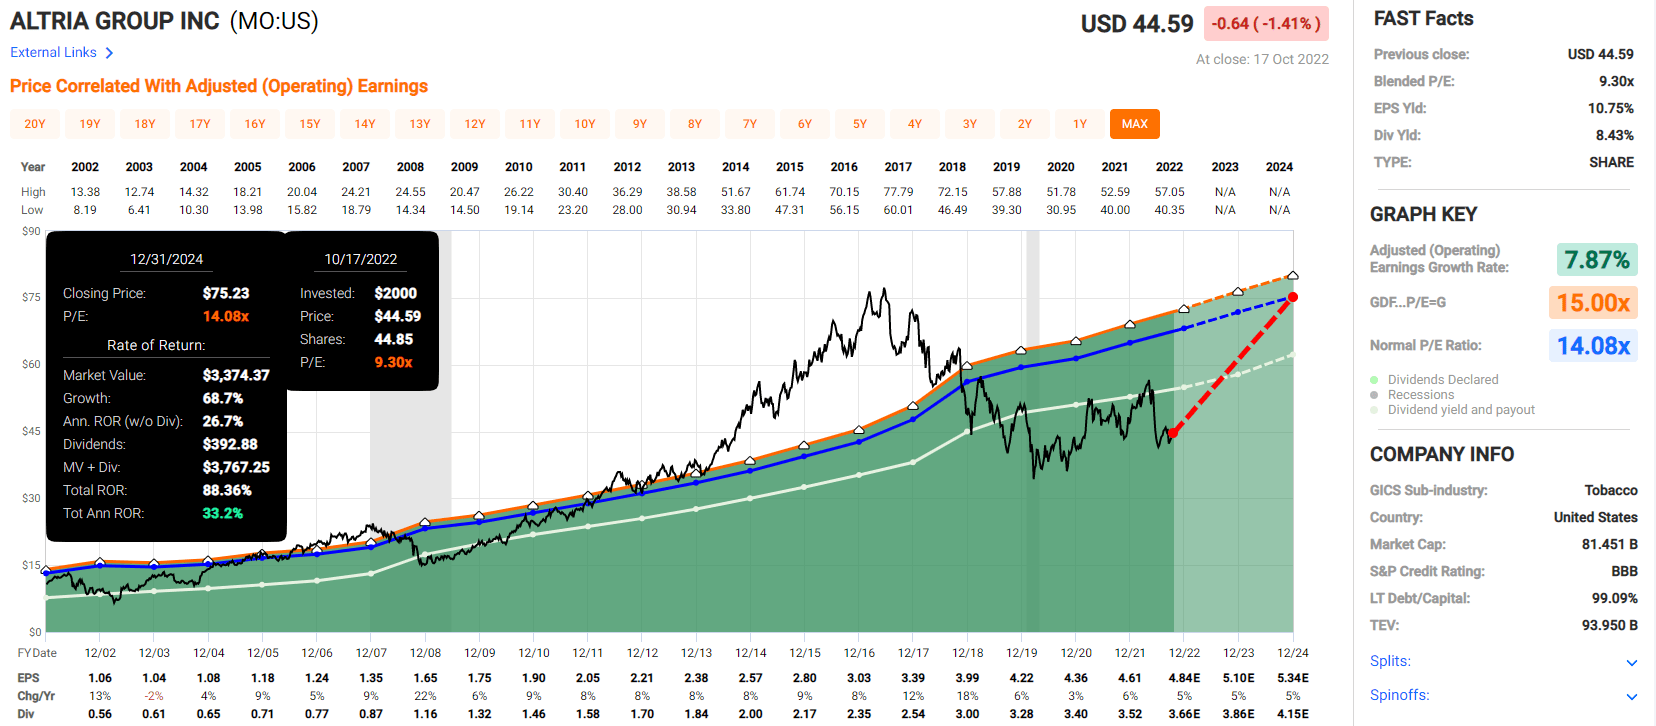
Magellan 2024 Consensus Total Return Potential
(Source: FAST Graphs, FactSet)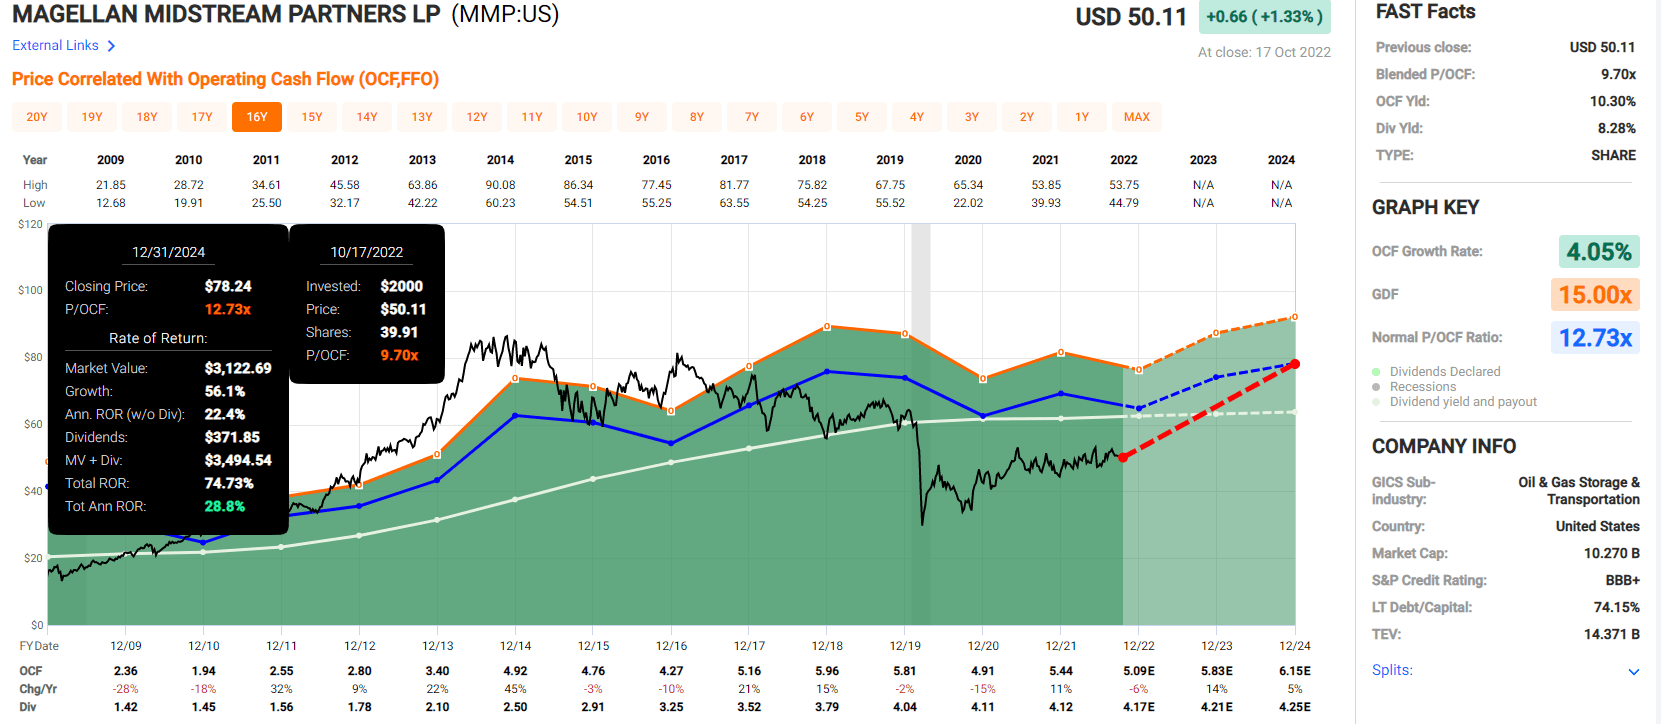
Keyera 2024 Consensus Total Return Potential
(Source: FAST Graphs, FactSet)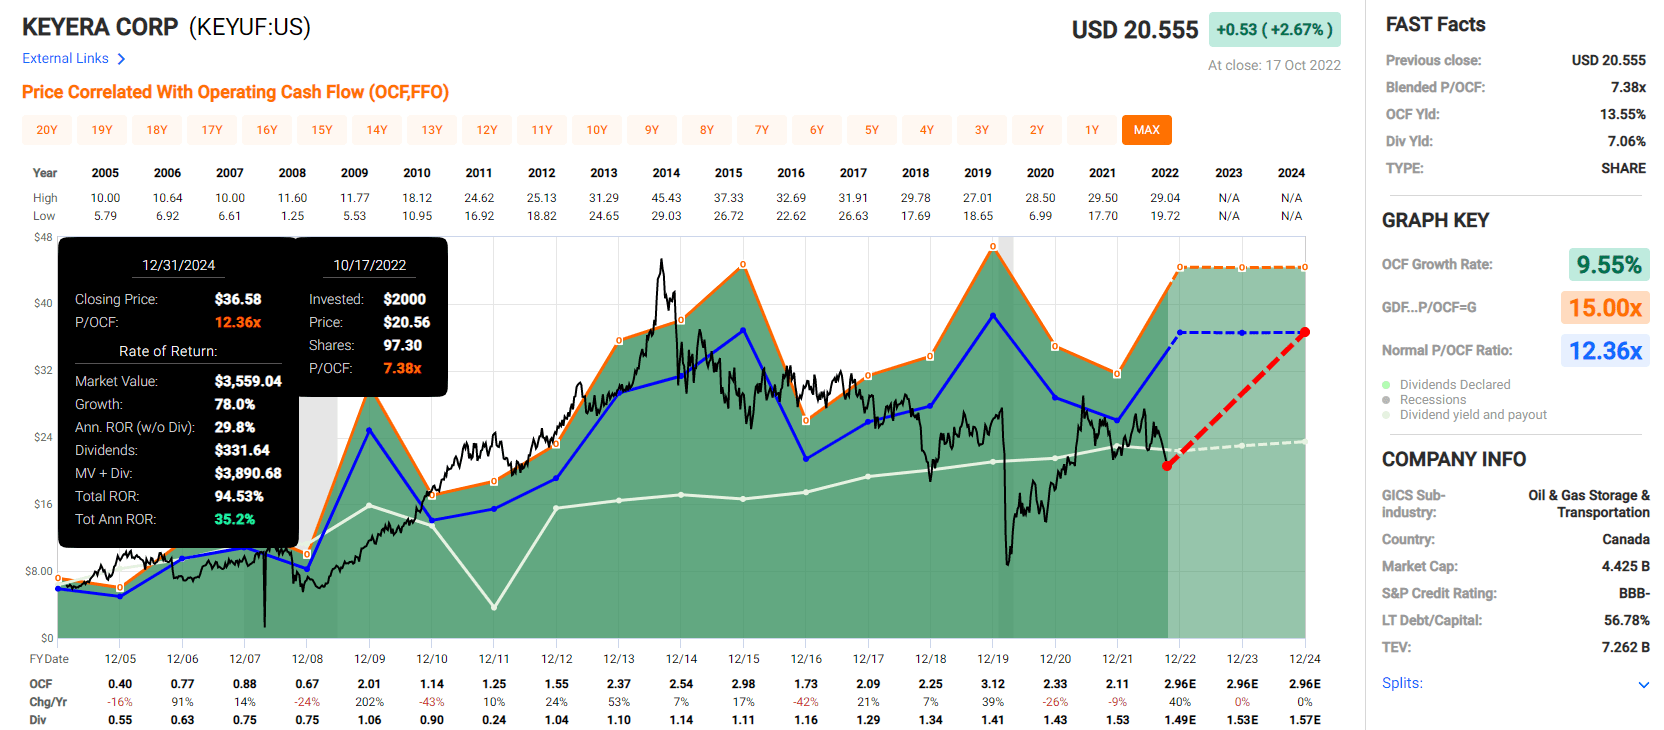
VF Corp 2024 Consensus Total Return Potential
(Source: FAST Graphs, FactSet)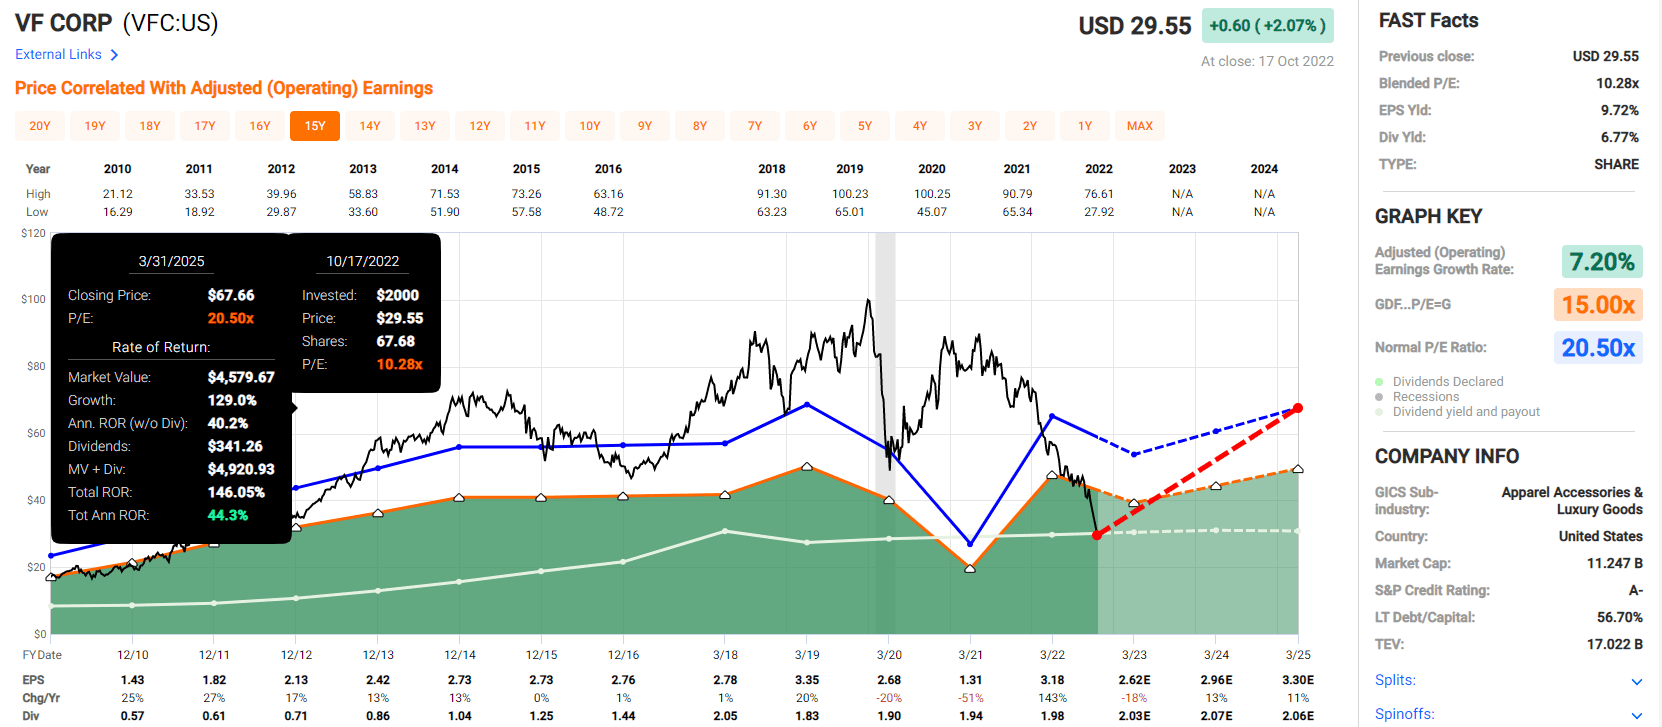
Enbridge 2024 Consensus Total Return Potential
(Source: FAST Graphs, FactSet)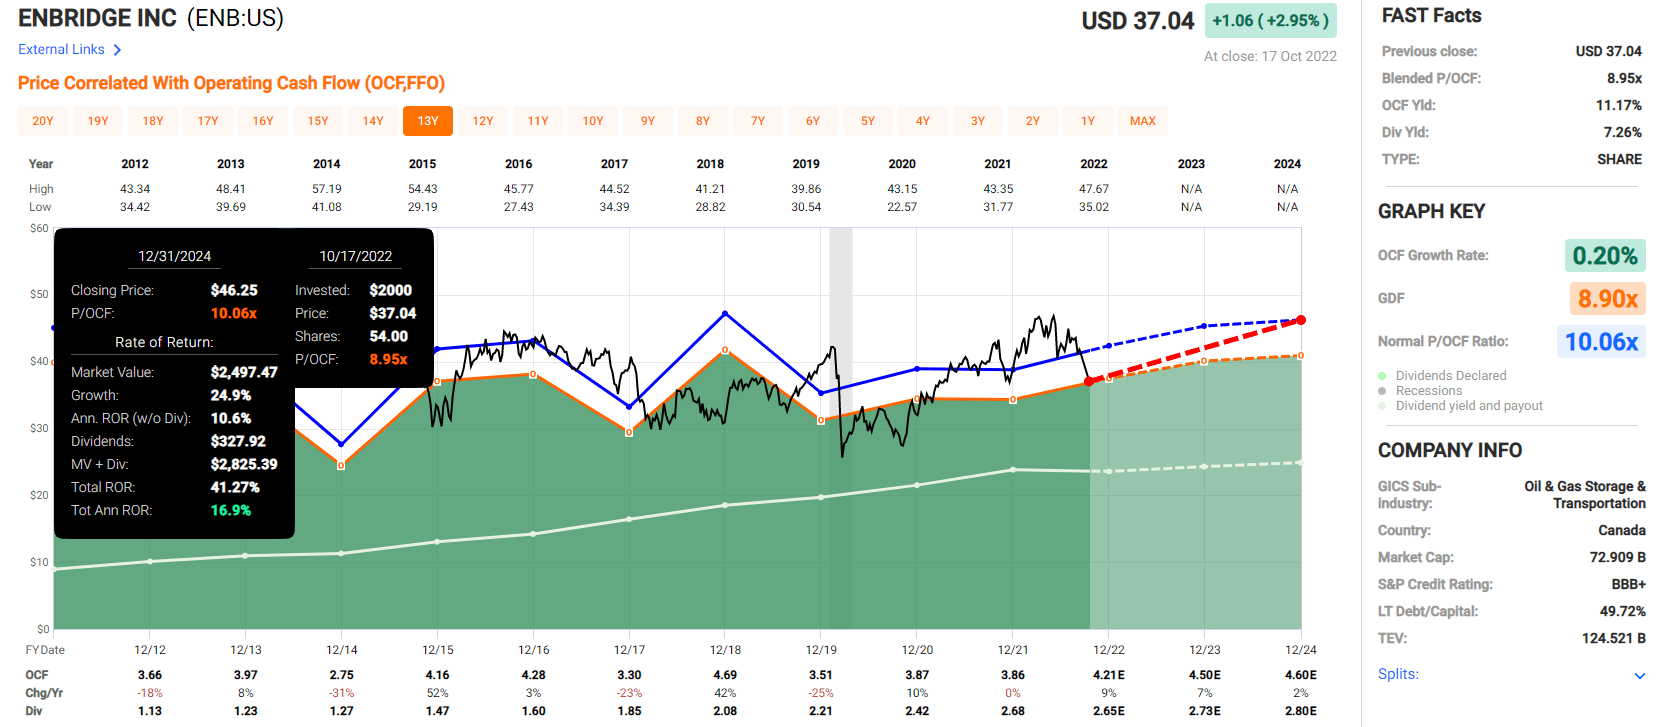
British American 2024 Consensus Total Return Potential
(Source: FAST Graphs, FactSet)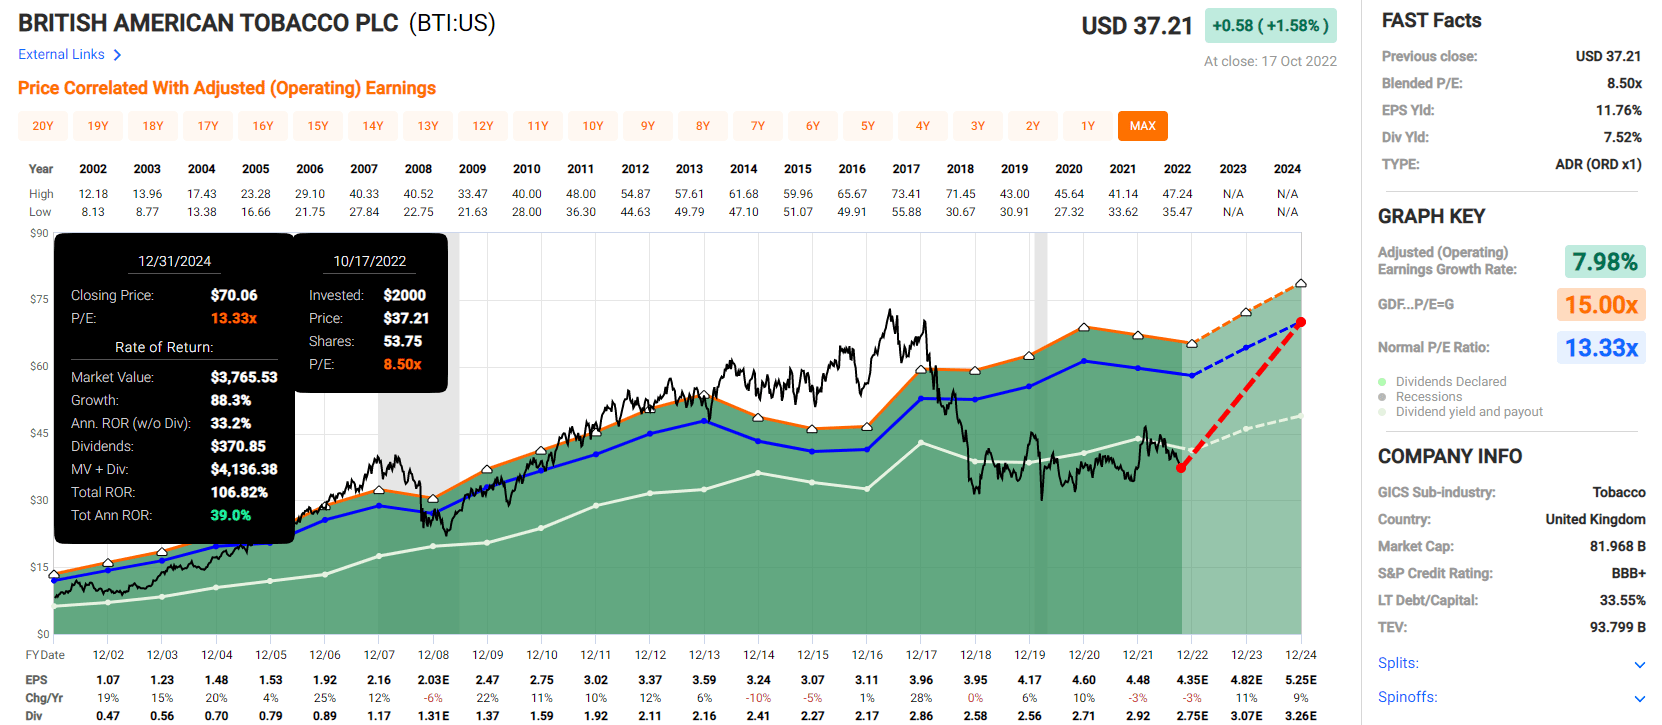
Cummins 2024 Consensus Total Return Potential
(Source: FAST Graphs, FactSet)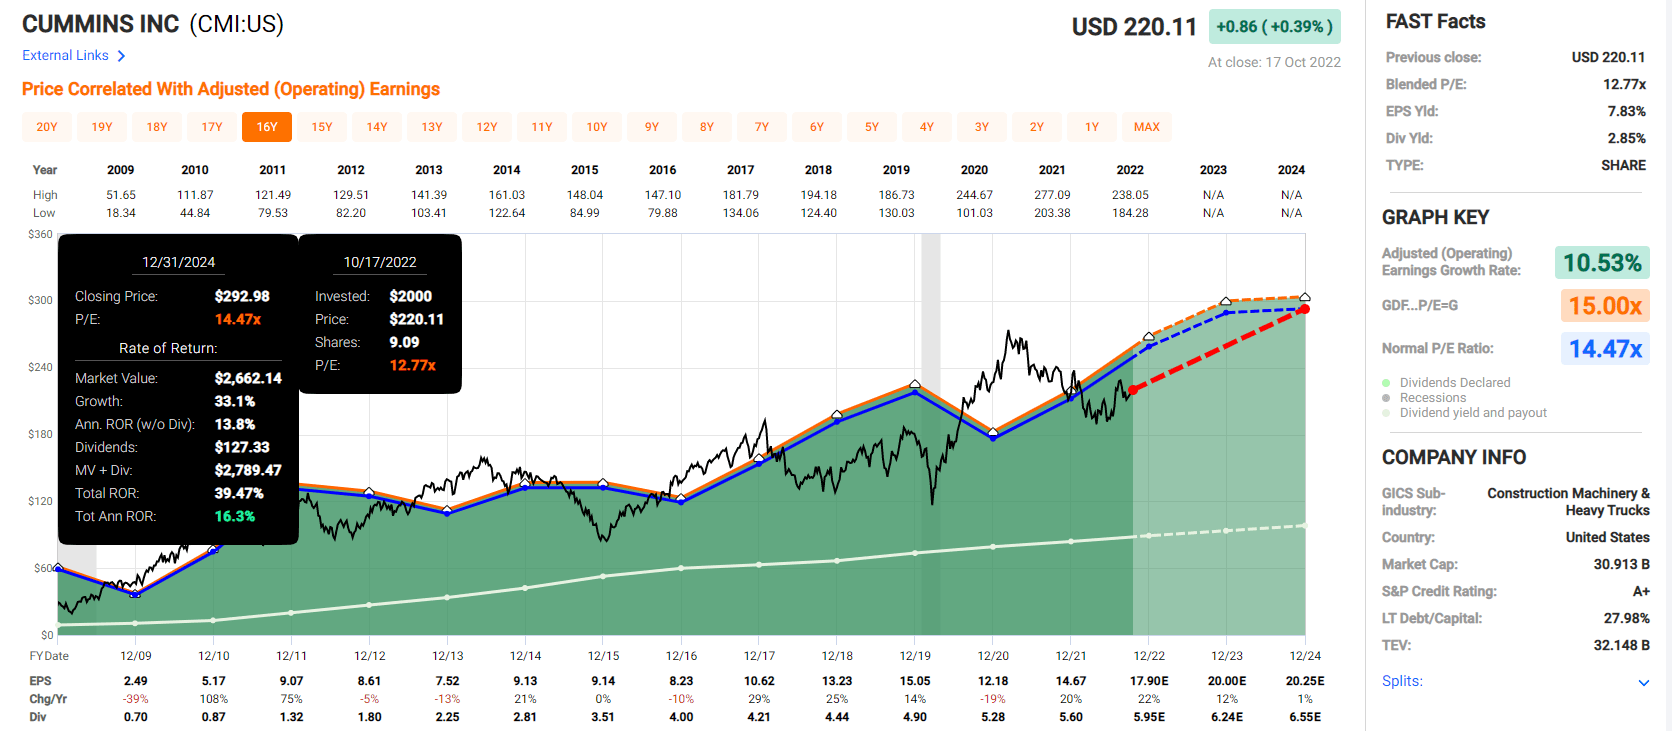
Average 2024 consensus return potential: 30.4% CAGR.
Average 2024 consensus return potential: 82%.
Now compare that to the S&P 500.
S&P 500 2024 Consensus Total Return Potential
(Source: FAST Graphs, FactSet)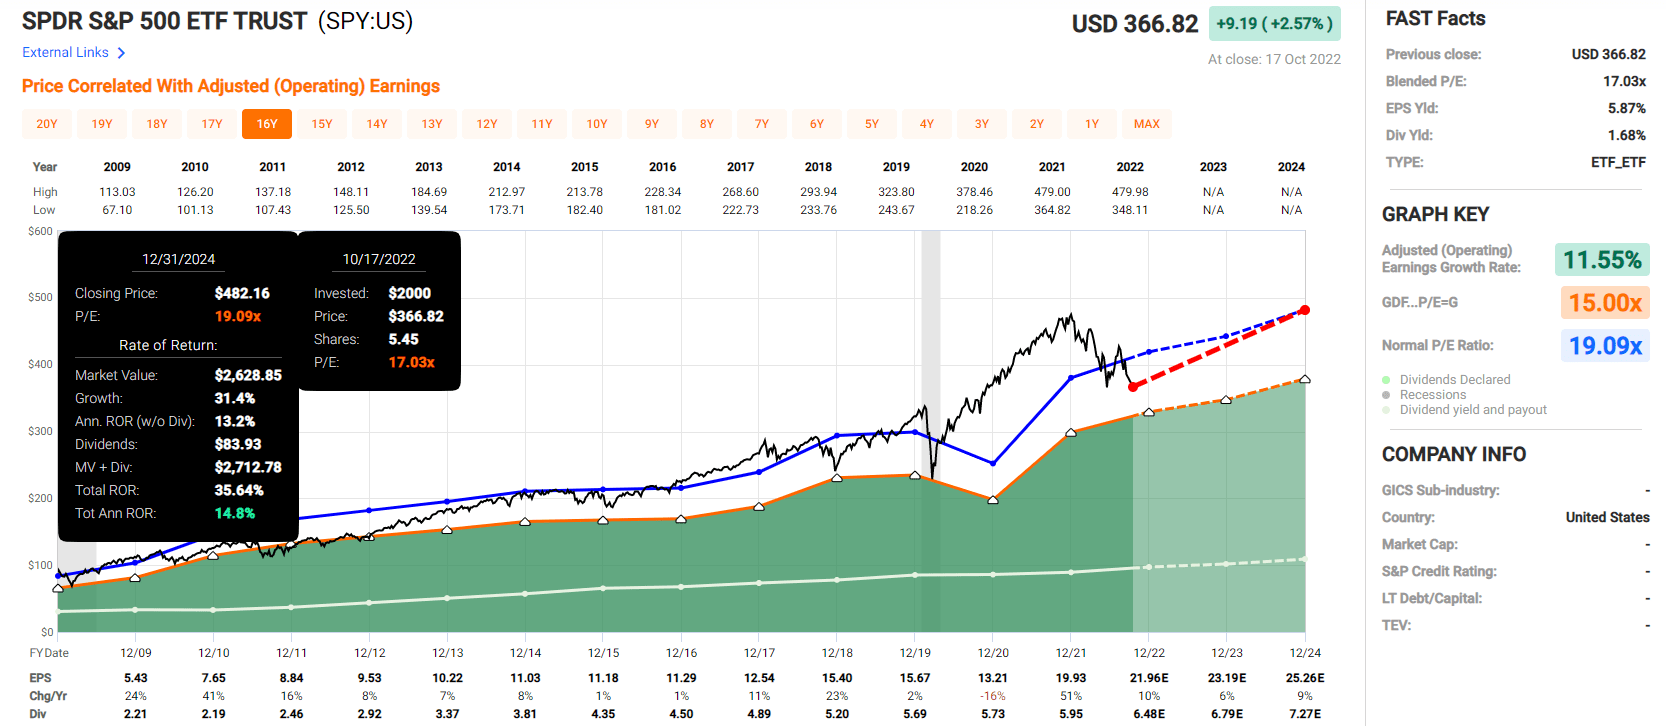
Analysts expect 15% annual returns from the market through 2024, a 36% total return.
- my core high-yield blue-chips offer 2.5X the market’s consensus return potential
But I’m not trying to score a quick 82% return, Buffett-like 30% annually, for just a few years.
My goal is life-changing income and wealth that I can use to fund my charitable trust in the coming years and decades.
- I have a 90-year plan to end global extreme poverty
- funded by blue-chip dividends.
Why I Trust These High-Yield Blue-Chips And So Can You
Dividend Kings Zen Research Terminal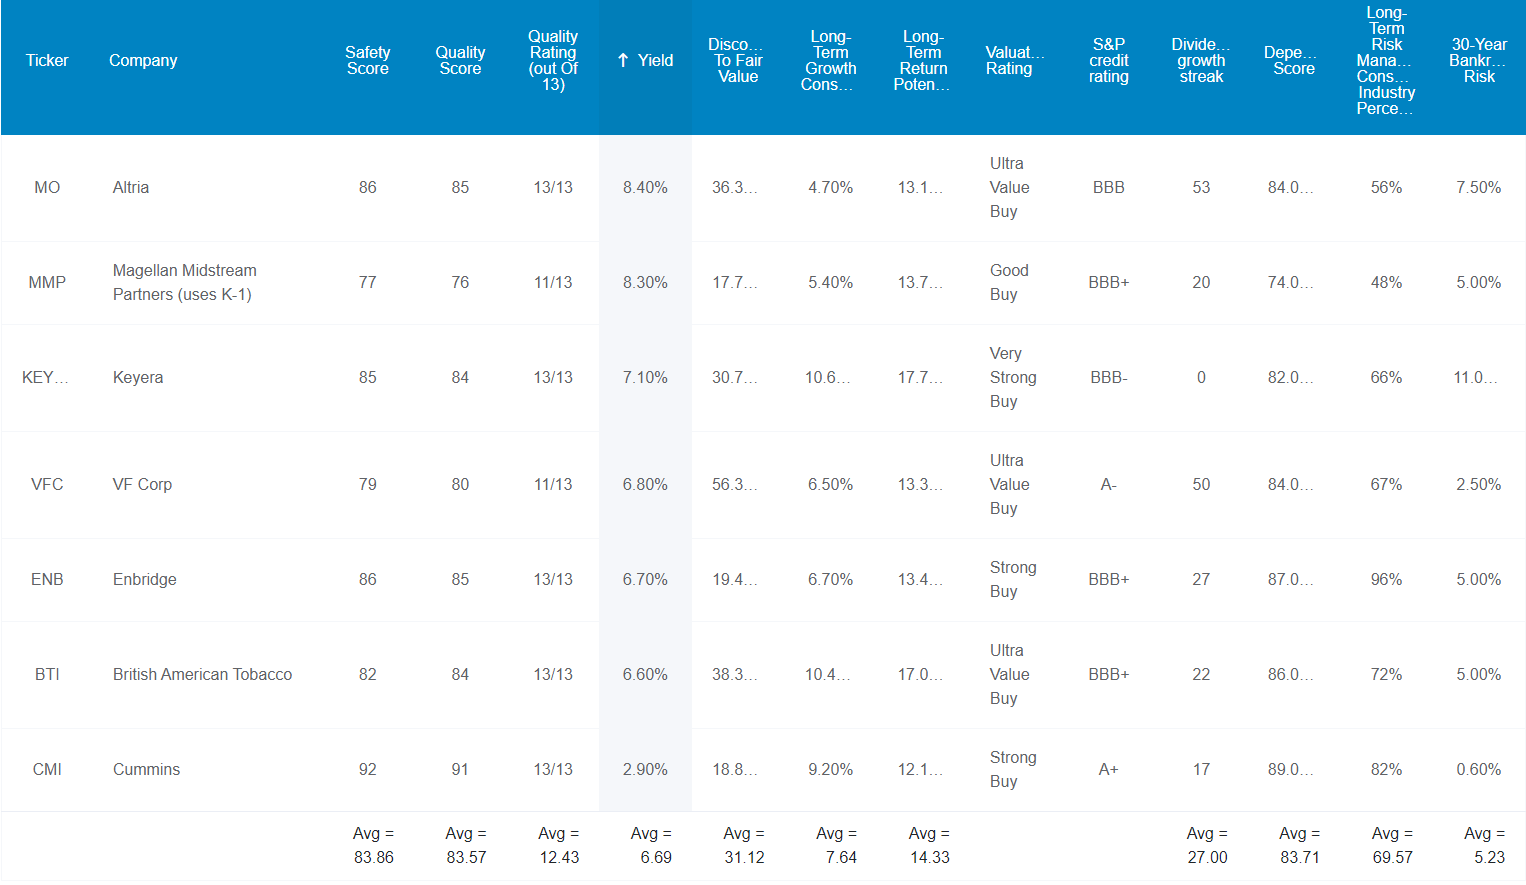
These aren’t just high-yield blue-chips they are 12.4/13 Super SWANs, on par with the quality of the dividend aristocrats. How can we tell? By comparing their fundamentals against those bluest of blue-chips.
Fundamentals Compared To Dividend Aristocrats
| Metric | Dividend Aristocrats | My 7 Core High-Yield Blue-Chips |
Compared To Aristocrats |
| Quality | 87% | 84% | 97% |
| Safety | 90% | 84% | 93% |
| Average Recession Dividend Cut Risk | 0.5% | 0.5% | 100% |
| Severe Recession Dividend Cut Risk | 1.50% | 1.85% | 123% |
| Dependability | 84% | 84% | 100% |
| Dividend Growth Streak (Years) | 44.8 | 27.0 | 60% |
| Long-Term Risk Management Industry Percentile | 67%, Above-Average, Low Risk | 70% Good, Low Risk | 104% |
| Average Credit Rating | A- Stable | BBB+ Stable | NA |
| Average Bankruptcy Risk | 3.04% | 5.23% | 172% |
| Average Return On Capital | 105% | 177% | 169% |
| Average ROC Industry Percentile | 83% | 88% | 106% |
| 13-Year Median ROC | 89% | 169% | 190% |
| Forward PE | 18.5 | 9.5 | 51% |
| Discount To Fair Value | 9% | 31% | 344% |
| DK Rating | Reasonable Buy | Very Strong Buy | NA |
| Yield | 2.7% | 6.7% | 248% |
| LT Growth Consensus | 8.6% | 7.6% | 89% |
| Total Return Potential | 11.3% | 14.3% | 127% |
| Risk-Adjusted Expected Return | 7.7% | 9.6% | 125% |
| Inflation & Risk-Adjusted Expected Return | 5.5% | 7.3% | 135% |
| Conservative Years To Double | 13.2 | 9.8 | 74% |
| Average | 132% |
(Source: Dividend Kings Zen Research Terminal)
Factoring in valuation these 7 core high-yield blue-chips are 32% better than the dividend aristocrats.
Ben Graham considered a 20+ year dividend growth streak an important sign of excellent quality. These high-yield blue-chips have an average dividend growth streak of 27 years.
- every year since 1995
- through four recessions
- six bear markets
- two economic crises
- and three market crashes.
Their average risk of a dividend cut in a historically average recession (what’s coming in 2023 most likely) is 0.5%.
Their average risk of a cut in a severe Pandemic or Great Recession level downturn is approximately 1.85%.
Joel Greenblatt considers return on capital or ROC his gold standard proxy for quality and moatiness.
- ROC = annual pre-tax profit/the cost of running the business
- S&P 500 ROC is 14.6%.
The Aristocrats average 105% ROC, 7X better than the S&P 500.
My core high-yield blue-chips average 177% ROC, or 12X better than the S&P 500 and 69% better than the dividend aristocrats.
Their ROC is in the 88th percentile, wide moat, and their 13-year median ROC is 169%, confirming a wide and stable moat.
S&P estimates an average 30-year bankruptcy risk of 5%, a BBB+ stable credit rating.
And S&P’s global risk-management rating is 70th percentile among 8,000 rated companies.
DK uses S&P Global’s global long-term risk-management ratings for our risk rating.
- S&P has spent over 20 years perfecting their risk model
- which is based on over 30 major risk categories, over 130 sub categories, and 1,000 individual metrics
- this risk rating has been included in every credit rating for decades.
For pipelines, these are just some of the biggest categories of risk management S&P considers in its risk ratings:
- crisis and risk management
- green energy transition plans
- operational efficiency
- occupational health and safety records
- labor relations
- labor retention and training
- corporate governance
- community relations
- codes of business conduct/scandals.
These High-Yield Blue-Chips’ Long-Term Risk Management Is The 167th Best In The Master List (67 Percentile)
| Classification | Average Consensus LT Risk-Management Industry Percentile |
Risk-Management Rating |
| British American Tobacco (BTI) tied for #1 Risk Management In The Master List | 100 | Exceptional |
| S&P Global (SPGI) Tied for #1 | 100 | Exceptional |
| Foreign Dividend Stocks | 76 |
Good |
| Strong ESG Stocks | 73 |
Good |
| My 7 Core High-Yield Blue-Chips | 70 | Good |
| Ultra SWANs | 70 | Good |
| Low Volatility Stocks | 68 | Above-Average |
| Dividend Aristocrats | 67 | Above-Average |
| Dividend Kings | 63 | Above-Average |
| Master List average | 62 | Above-Average |
| Hyper-Growth stocks | 61 | Above-Average |
| Monthly Dividend Stocks | 60 | Above-Average |
| Dividend Champions | 57 | Average bordering on above-average |
(Source: DK Research Terminal)
These high-yield blue chips’ risk-management consensus is in the top 33% of the world’s highest quality companies and similar to that of such other blue chips as:
- Kimberly-Clark (KMB): Ultra SWAN dividend king
- 3M (MMM): Ultra SWAN dividend king
- T. Rowe Price (TROW): Ultra SWAN dividend aristocrat
- Novo Nordisk (NVO): Ultra SWAN global aristocrat
- Stanley Black & Decker (SWK): Super SWAN dividend king.
The bottom line is that all companies have risks, and these high-yield blue-chips are good, at managing theirs.
How We Monitor Their Risk Profiles
- 141 analysts
- four credit rating agencies
- 145 experts who collectively know this business better than anyone other than management
- and the bond market for real-time fundamental risk updates
When the facts change, I change my mind. What do you do, sir?” – John Maynard Keynes
There are no sacred cows at iREIT or Dividend Kings. Wherever the fundamentals lead, we always follow. That’s the essence of disciplined financial science, the math behind retiring rich and staying rich in retirement.
OK, so now that you understand why I’m willing to invest half my correction savings into these seven blue-chips, let see why you might want to buy some today.
Wonderful Companies At Wonderful Prices
(Source: Dividend Kings Zen Research Terminal)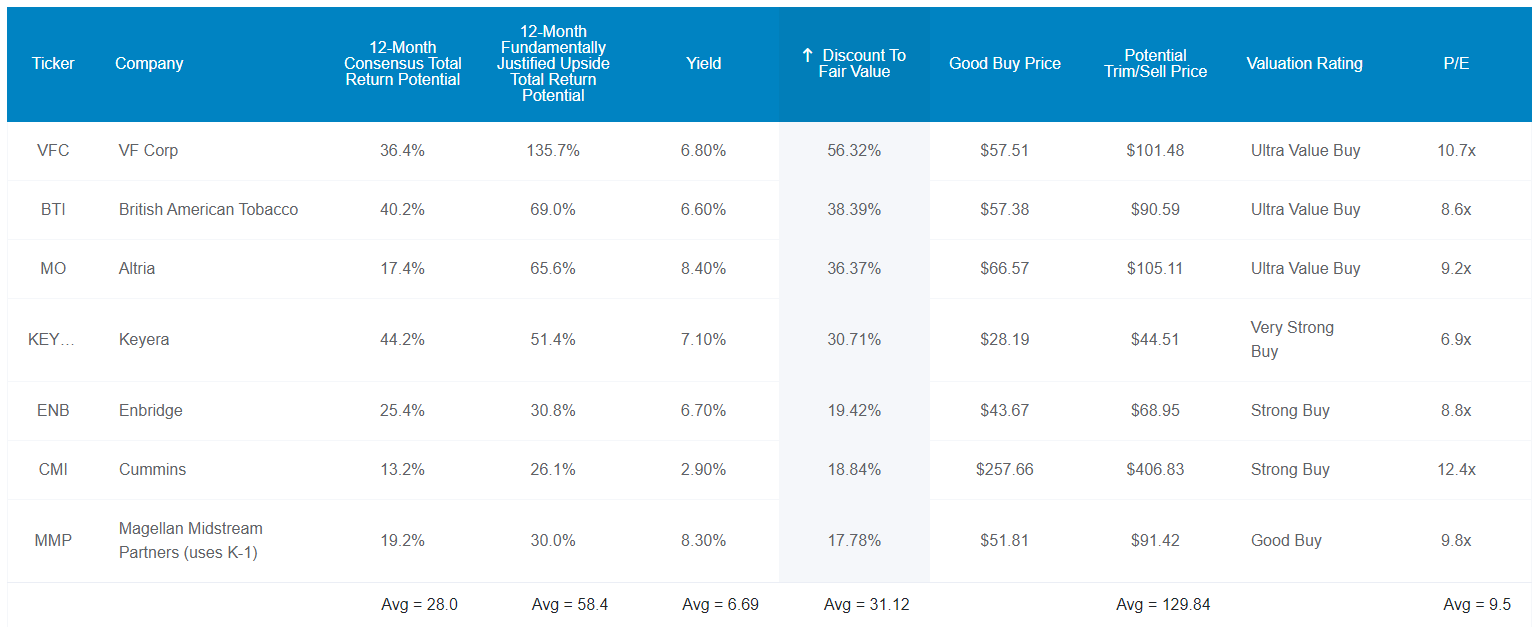
For context, the S&P trades at 15.7X forward earnings, a 7% historical discount.
The dividend aristocrats trade at 18.5X forward earnings, a 9% historical discount.
My core high-yield blue chips trade at 9.5X earnings and cash flow, a 31% historical discount.
- the S&P bottomed at 11.6X earnings on March 9th, 2009
- the last time the S&P traded at 9.5X earnings was the mid 1980s.
My core high-yield blue-chips trade at a valuation the S&P hasn’t seen in 40 years and will likely never see again.
That’s why analysts expect my core high-yield blue chips to deliver 28% total returns within 12 months.
Their fundamentally justified 12-month return potential is 58%.
- if they all grow as expected and return to historical mid-range market-determined fair value I’ll make 58% in a year
But my goal isn’t to make 28% in a year, or even 58%, or 82% in 2 years, though they are capable of that.
My goal is making 55X returns in the next 30 years.
How These High-Yield Blue-Chips Can Help You And I Retire In Safety And Splendor
(Source: Dividend Kings Zen Research Terminal)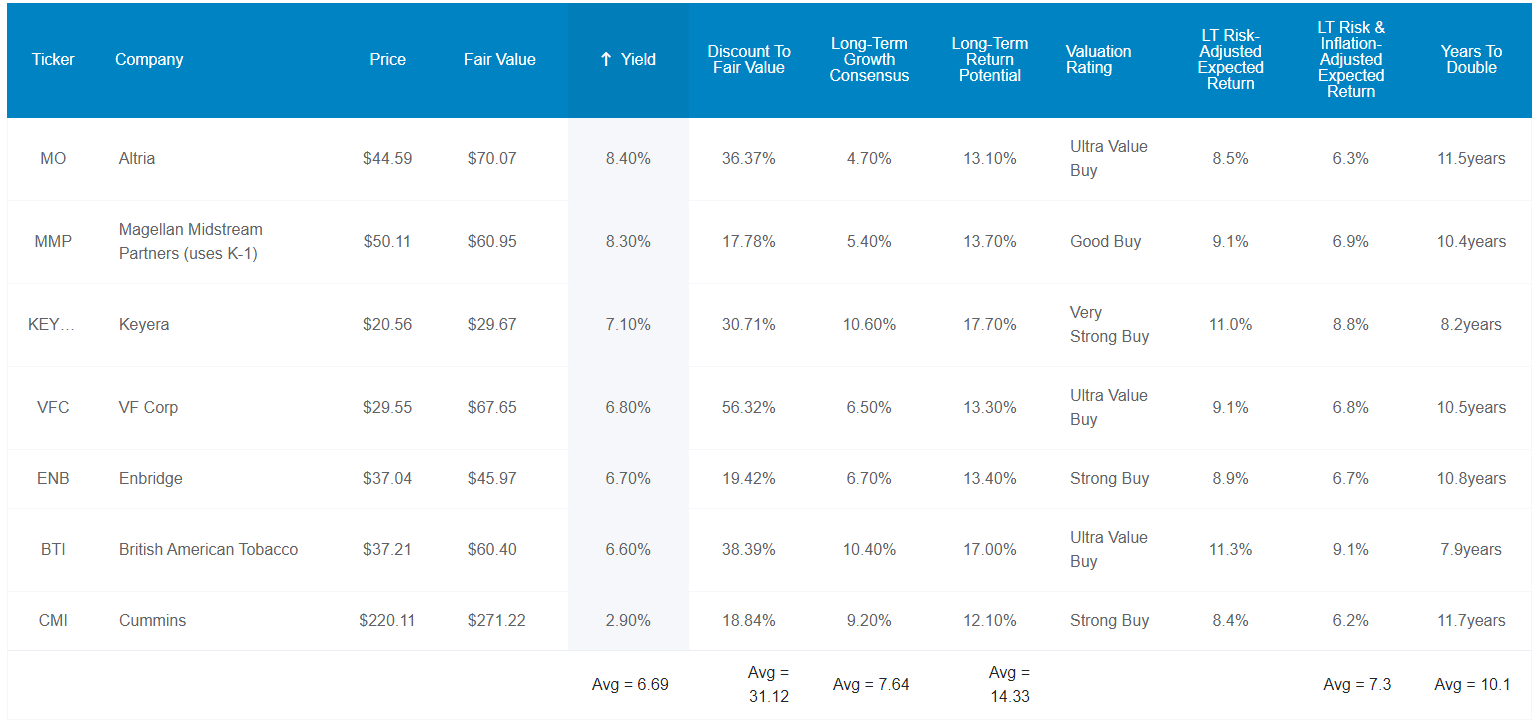
Not only am I buying some of the safest 6.7% yield on earth, but these are blue chips growing at 7.6% with 14.3% CAGR long-term return potential.
How great is that?
| Investment Strategy | Yield | LT Consensus Growth | LT Consensus Total Return Potential | Long-Term Risk-Adjusted Expected Return | Long-Term Inflation And Risk-Adjusted Expected Returns | Years To Double Your Inflation & Risk-Adjusted Wealth |
10-Year Inflation And Risk-Adjusted Expected Return |
| My 7 Core High-Yield Blue Chips | 6.7% | 7.6% | 14.3% | 10.0% | 7.7% | 9.3 | 2.11 |
| Safe Midstream | 6.1% | 6.4% | 12.5% | 8.8% | 6.5% | 11.1 | 1.87 |
| 10-Year US Treasury | 4.1% | 0.0% | 4.1% | 2.8% | 0.6% | 127.4 | 1.06 |
| REITs | 3.9% | 6.1% | 10.0% | 7.0% | 4.7% | 15.2 | 1.59 |
| Schwab US Dividend Equity ETF | 3.8% | 8.50% | 12.3% | 8.6% | 6.3% | 11.4 | 1.85 |
| Dividend Aristocrats | 2.8% | 8.7% | 11.5% | 8.1% | 5.8% | 12.5 | 1.75 |
| 60/40 Retirement Portfolio | 2.3% | 5.1% | 7.4% | 5.2% | 2.9% | 24.7 | 1.33 |
| S&P 500 | 1.8% | 8.5% | 10.3% | 7.2% | 4.9% | 14.6 | 1.62 |
| Nasdaq | 0.8% | 11.5% | 12.3% | 8.6% | 6.3% | 11.4 | 1.85 |
(Sources: DK Research Terminal, FactSet, Morningstar, Ycharts)
A higher safe yield than any other popular blue-chip income option.
And higher return potential than any popular fund or exchange-traded fund (“ETF”), including the Nasdaq.
Ultra-yield and Nasdaq beating returns? Now we’re cooking with gas.
Inflation-Adjusted Consensus Return Potential: $1,000 Initial Investment
| Time Frame (Years) | 8.0% CAGR Inflation-Adjusted S&P 500 Consensus | 9.2% Inflation-Adjusted Aristocrat Consensus | 12.0% CAGR Inflation-Adjusted My Core 7 High-Yield Blue-Chip Consensus | Difference Between Inflation-Adjusted My Core 7 High-Yield Blue-Chip Consensus And S&P Consensus |
| 5 | $1,468.65 | $1,553.50 | $1,764.70 | $296.06 |
| 10 | $2,156.93 | $2,413.37 | $3,114.18 | $957.25 |
| 15 | $3,167.77 | $3,749.18 | $5,495.60 | $2,327.83 |
| 20 | $4,652.33 | $5,824.36 | $9,698.10 | $5,045.77 |
| 25 | $6,832.64 | $9,048.16 | $17,114.27 | $10,281.63 |
| 30 (retirement time frame) | $10,034.74 | $14,056.34 | $30,201.61 | $20,166.87 |
| 35 | $14,737.50 | $21,836.56 | $53,296.88 | $38,559.37 |
| 40 | $21,644.21 | $33,923.16 | $94,053.17 | $72,408.96 |
| 45 | $31,787.72 | $52,699.72 | $165,975.93 | $134,188.21 |
| 50 | $46,684.97 | $81,869.16 | $292,898.26 | $246,213.30 |
| 55 | $68,563.78 | $127,183.97 | $516,878.51 | $448,314.73 |
| 60 (investing lifetime) | $100,696.06 | $197,580.66 | $912,137.18 | $811,441.12 |
| 100 (institutional time frame, foundations, multi-generational wealth) | $2,179,486.17 | $6,702,560.00 | $85,789,393.44 | $83,609,907.27 |
(Source: DK Research Terminal, FactSet)
For a retiree with 30 years, these high-yield blue-chips offer the potential for 30X inflation-adjusted returns.
Over and investing lifetime, they offer life-changing 912X return potential.
And for those who want to establish perpetual charitable trusts, over 100 years, you have world-changing wealth.
- literally 100 years and I can eliminate severe global poverty with blue-chip dividends
- assuming others haven’t already done it by then
| Time Frame (Years) | Ratio Inflation-Adjusted My Core 7 High-Yield Blue-Chip Consensus/Aristocrat Consensus | Ratio Inflation-Adjusted My Core 7 High-Yield Blue-Chip Consensus vs. S&P consensus |
| 5 | 1.14 | 1.20 |
| 10 | 1.29 | 1.44 |
| 15 | 1.47 | 1.73 |
| 20 | 1.67 | 2.08 |
| 25 | 1.89 | 2.50 |
| 30 | 2.15 | 3.01 |
| 35 | 2.44 | 3.62 |
| 40 | 2.77 | 4.35 |
| 45 | 3.15 | 5.22 |
| 50 | 3.58 | 6.27 |
| 55 | 4.06 | 7.54 |
| 60 | 4.62 | 9.06 |
| 100 | 12.80 | 39.36 |
(Source: DK Research Terminal, FactSet)
Over 30 years they could deliver 3X the real wealth and income of the S&P and over and investing lifetime, 9X.
On my time scale, it’s potentially 39X more wealth and charitable donations than the S&P and 13X more than the dividend aristocrats.
OK, this sounds wonderful, the math is very compelling. But what evidence is there that these seven high-yield blue-chips can actually deliver anything close to 14% long-term returns for decades?
Historical Returns Since 2003 (Equal Weighting Annual Rebalancing)
The future doesn’t repeat, but it often rhymes. – Mark Twain
In our case, “past performance is no guarantee of future results.”
Still, studies show that blue chips with relatively stable fundamentals offer predictable returns based on yield, growth, and valuation mean reversion over time.
Bank of America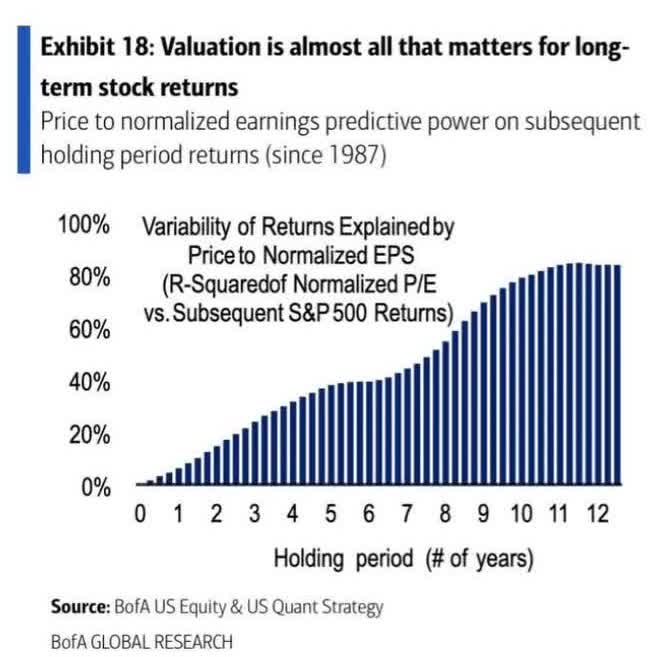
19 years is a time frame in which 91% of total returns are due to fundamentals, not luck.
(Source: Portfolio Visualizer Premium)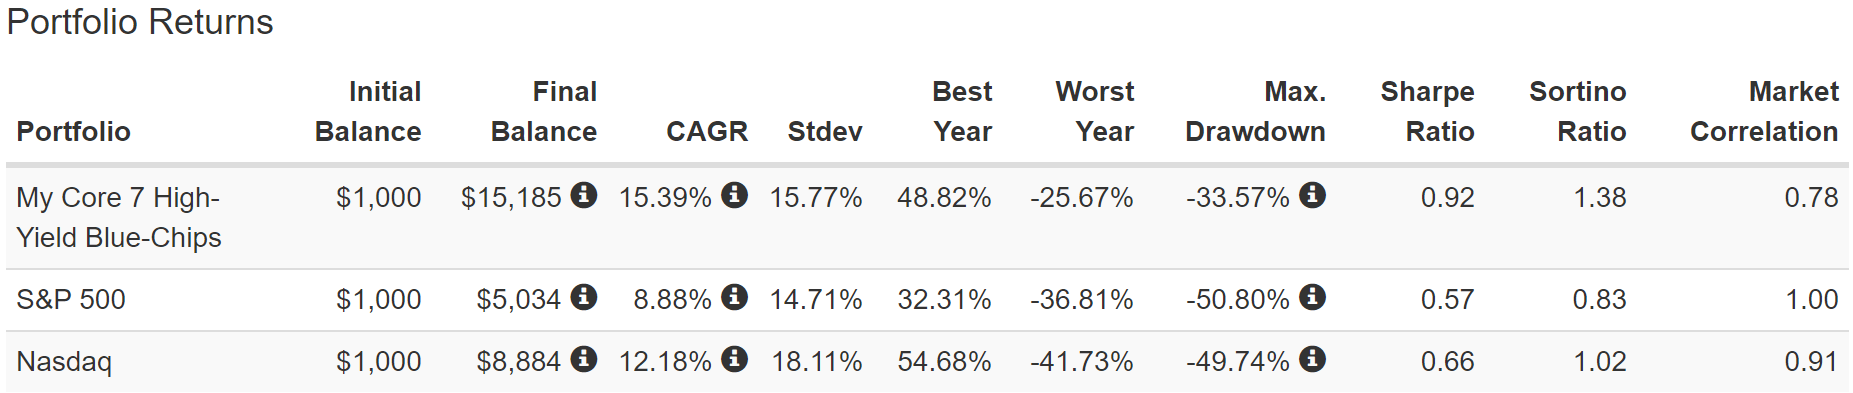
Can high-yield blue chips beat the S&P and Nasdaq over the long-term? Can they deliver 14% long-term returns? Yes they can and they’ve done it over the last two decades.
(Source: Portfolio Visualizer Premium)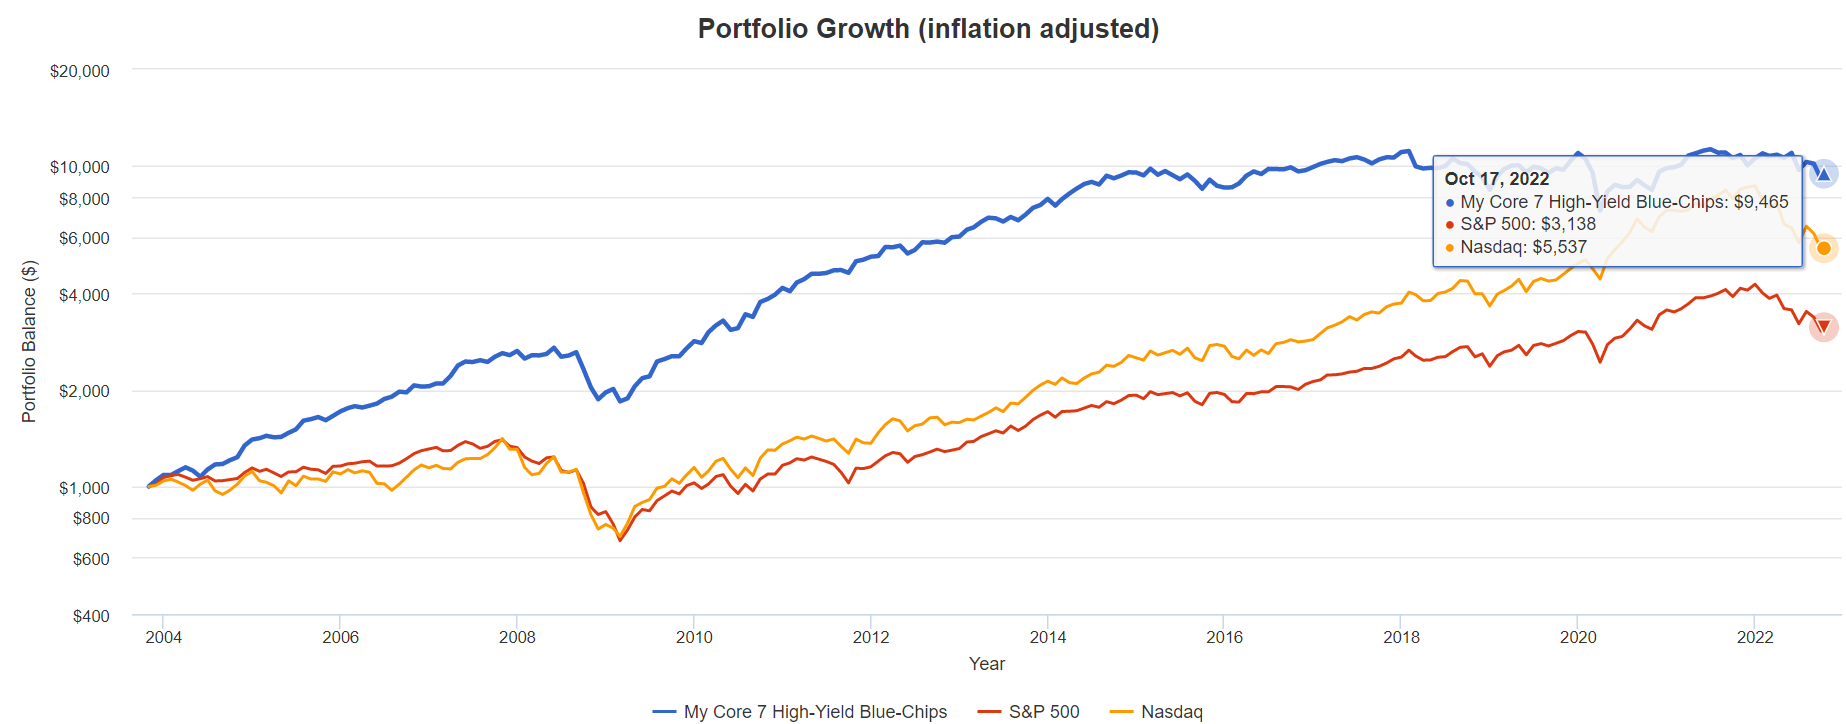
2X the inflation-adjusted returns of the Nasdaq and 3X the S&P 500.
(Source: Portfolio Visualizer Premium)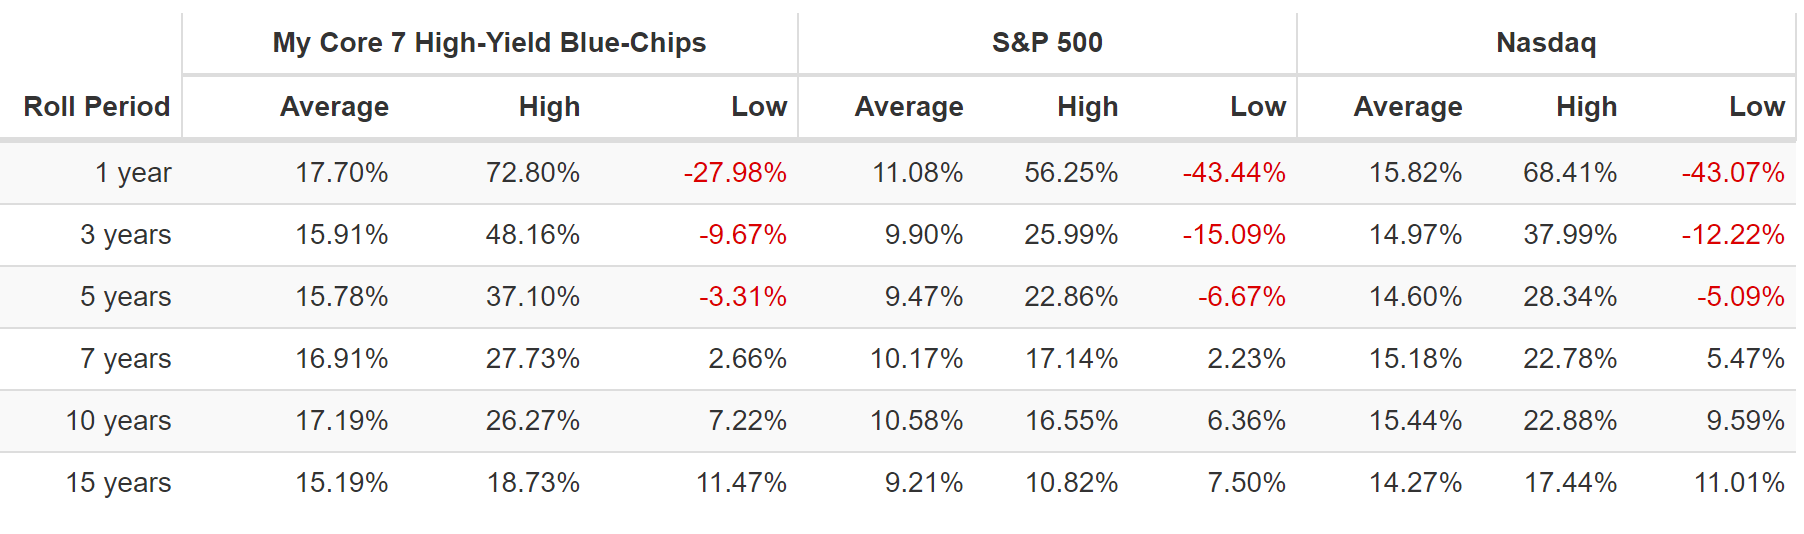
The average annual return is 18%, the average 10-year return is 17% and the average 15-year return is 15%.
And let’s not forget about the biggest reason to own high-yield blue-chips, the income!
Rich Retirement Income Dependability And Growth
2007 and 2008 were 3 MO Spin-offs ((Source: Portfolio Visualizer Premium))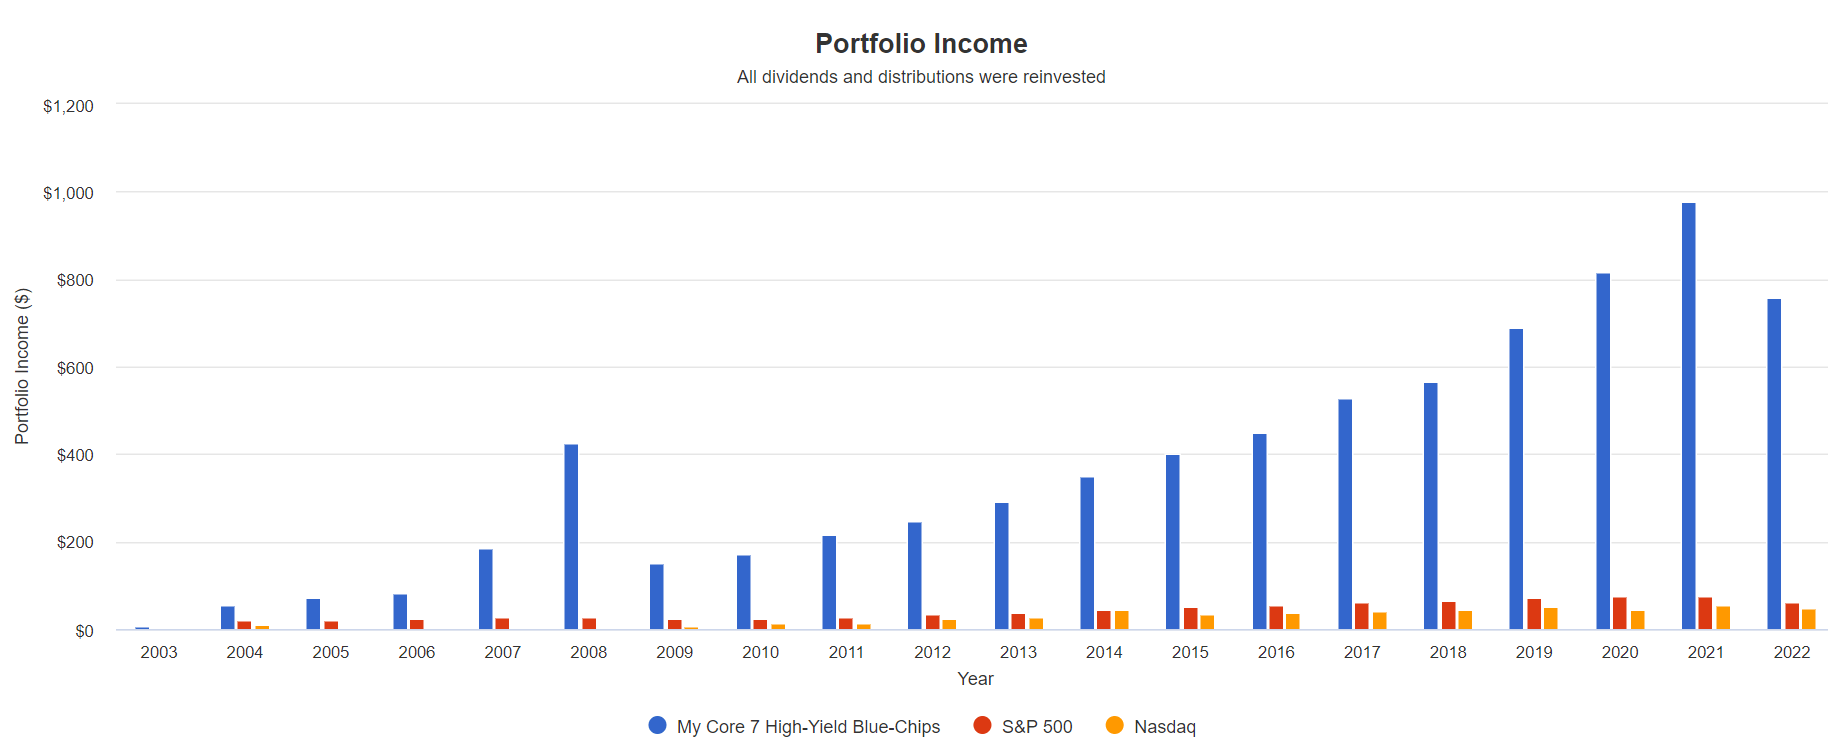
Cumulative Dividends Since 2004 Per $1,000 Initial Investment
| Metric | S&P 500 | Nasdaq | My 7 Core High-Yield Blue-Chips |
| Total Dividends | $855 | $533 | $7,679 |
| Total Inflation-Adjusted Dividends | $534.38 | $333.13 | $4,799.38 |
| Annualized Income Growth Rate | 7.9% | 10.4% | 17.4% |
| Total Income/Initial Investment % | 0.86 | 0.53 | 7.68 |
| Inflation-Adjusted Income/Initial Investment % | 0.53 | 0.33 | 4.80 |
| More Inflation-Adjusted Income Than S&P | NA | 0.62 | 8.98 |
| Starting Yield | 2.1% | 1.1% | 5.6% |
| Today’s Annual Dividend Return On Your Starting Investment (Yield On Cost) | 8.3% | 6.5% | 101.1% |
| 2022 Inflation-Adjusted Annual Dividend Return On Your Starting Investment (Inflation-Adjusted Yield On Cost) | 5.2% | 4.1% | 63.2% |
(Source: Portfolio Visualizer Premium)
17% annual income growth for nearly two decades, delivering 9X more inflation-adjusted income than the S&P 500.
5X your initial investment recouped in inflation-adjusted dividends.
And an inflation-adjusted yield on cost of 63%, 13X more than the S&P 500.
How To Turn These Core High-Yield Blue-Chips Into A Complete Ultra SWAN Retirement Portfolio
Investing in just seven companies so heavily weighted towards energy and tobacco isn’t prudent risk-management.
So here’s how to incorporate these high-yield Super SWANs into a complete retirement portfolio.
I call this the DK ZEUS strategy, which is based on decades of studies determining the optimal long-term recession resistant asset allocation for most blue-chip investors.
- 33% hedging assets are optimal according to Ritholtz Wealth Management’s studies and my own
- if you want to optimize long-term returns, starting yield and minimize volatility in bear markets
- let’s you sleep well at night in even the most extreme market crashes
- 33% to 66% smaller declines than the market
- 33% less annual volatility than the market
- superior long-term returns
- higher income.
ZEUS stands for Zen Extraordinary Ultra SWAN (Sleep Well At Night) and as you’ll see, it lives up to the name.
- 33% stock ETFs
- 33% hedging assets (bonds, cash, alternatives)
- 33% individual blue-chips.
In this case a ZEUS High-Yield Income Growth Portfolio might look like this:
- 16.7% SCHD or VYM (gold standard blue-chip high-yield ETFs)
- 16.7% QQQM or VIG (gold standard blue-chip dividend growth ETFs)
- 16.7% EDV or TLT (gold standard long duration US treasury ETFs)
- 16.7% DBMF, PQTAX, or AMFAX (4 or 5 star Morningstar rated managed futures ETFs)
- 33.33% these core high-yield blue-chips (4.8% each).
Now, instead, the concentration in midstream and tobacco is 15% and 10% each, respectively, a reasonable and prudent allocation.
| Metric | 60/40 | ZEUS High-Yield Income Growth | X Better Than 60/40 |
| Yield | 2.3% | 5.3% | 2.27 |
| Growth Consensus | 5.1% | 5.9% | 1.16 |
| LT Consensus Total Return Potential | 7.4% | 11.2% | 1.51 |
| Risk-Adjusted Expected Return | 5.2% | 7.8% | 1.51 |
| Safe Withdrawal Rate (Risk And Inflation-Adjusted Expected Returns) | 2.9% | 5.6% | 1.91 |
| Conservative Time To Double (Years) | 24.7 | 13.0 | 1.91 |
(Source: DK Research Terminal, FactSet)
A 5.3% yield that’s more than 2X the 60/40 and 11.2% CAGR long-term return potential that should beat the S&P 500 and run circles around a 60/40.
A safe 5.6% withdrawal rate that’s almost 2X better than a 60/40.
Inflation-Adjusted Consensus Return Potential: $510K Starting Investment (Averaged Retired Couple Savings At Age 65)
| Time Frame (Years) | 5.1% CAGR Inflation-Adjusted 60/40 | 8.9% Inflation-Adjusted ZEUS High-Yield Income Growth Consensus | Difference Between ZEUS High-Yield Income Growth Consensus and 60/40 Consensus |
| 5 | $654,320.24 | $782,181.78 | $127,861.53 |
| 10 | $839,480.35 | $1,199,624.18 | $360,143.83 |
| 15 | $1,077,037.23 | $1,839,851.33 | $762,814.09 |
| 20 | $1,381,818.17 | $2,821,761.14 | $1,439,942.98 |
| 25 | $1,772,846.27 | $4,327,706.17 | $2,554,859.90 |
| 30 | $2,274,527.85 | $6,637,358.65 | $4,362,830.80 |
| 35 | $2,918,175.72 | $10,179,648.99 | $7,261,473.28 |
| 40 | $3,743,963.62 | $15,612,423.43 | $11,868,459.81 |
| 45 | $4,803,433.69 | $23,944,613.96 | $19,141,180.26 |
| 50 | $6,162,713.53 | $36,723,609.25 | $30,560,895.72 |
| 55 | $7,906,643.56 | $56,322,623.49 | $48,415,979.93 |
| 60 | $10,144,072.43 | $86,381,430.95 | $76,237,358.52 |
| 100 | $74,468,702.13 | $2,644,359,757.57 | $2,569,891,055.44 |
(Source: DK Research Terminal, FactSet)
For the average retired couple ZEUS could deliver an extra $4.4 million in inflation-adjusted wealth over a standard retirement.
For anyone planning a charitable trust like myself? Over time it could deliver over $2.5 billion in extra inflation-adjusted wealth and charitable donations.
- I plan to donate billions to charity in the coming decades
| Time Frame (Years) |
Ratio ZEUS High-Yield Income Growth Consensus Vs 60/40 Consensus |
| 5 | 1.20 |
| 10 | 1.43 |
| 15 | 1.71 |
| 20 | 2.04 |
| 25 | 2.44 |
| 30 | 2.92 |
| 35 | 3.49 |
| 40 | 4.17 |
| 45 | 4.98 |
| 50 | 5.96 |
| 55 | 7.12 |
| 60 | 8.52 |
| 100 | 35.51 |
(Source: DK Research Terminal, FactSet)
For the average retired couple, potentially 3X more inflation-adjusted wealth.
For my charitable foundation, 36X more inflation-adjusted charitable donations.
Historical Returns Since June 2019 (SCHD, QQQ, DBMF, EDV, My Core 7 High-Yield Blue-Chips)
(Source: Portfolio Visualizer Premium)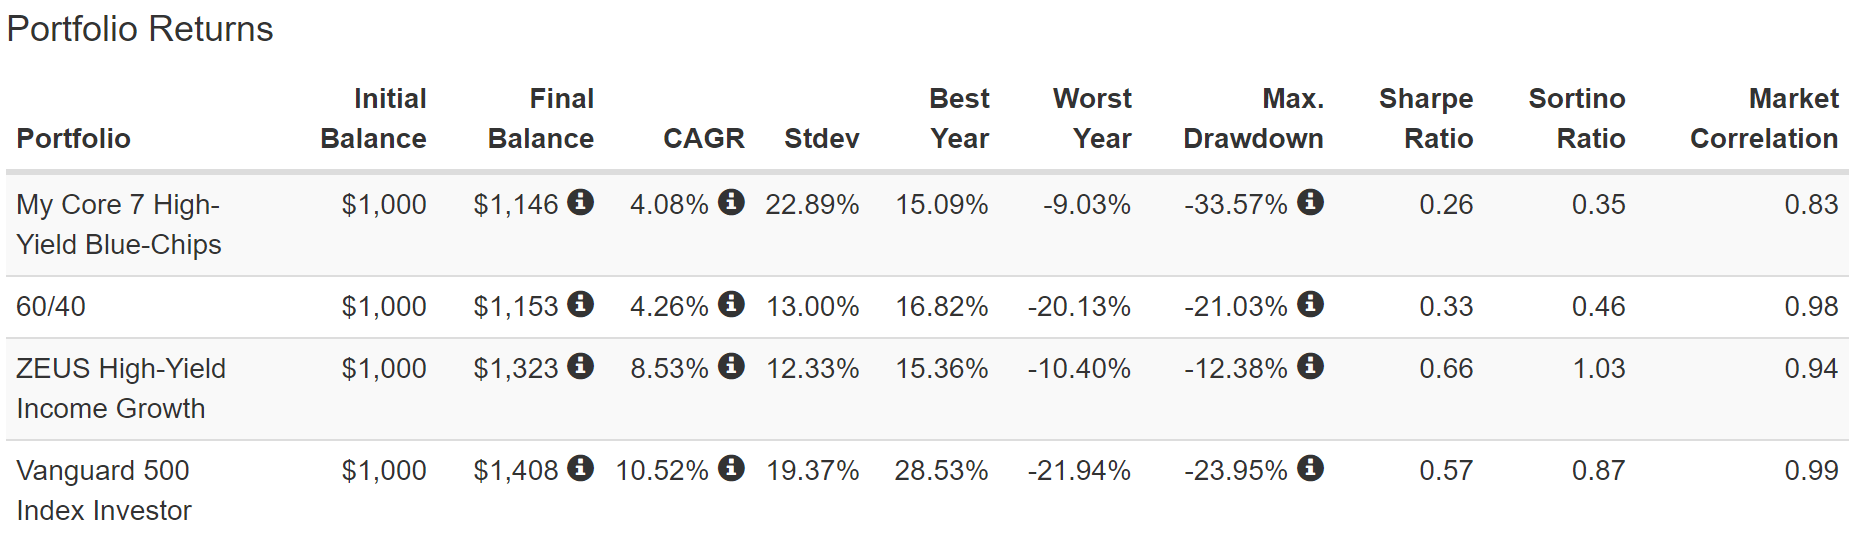
2X the returns of a 60/40? Check.
Lower volatility than a 60/40? Check.
Market like returns? Check.
33% less volatility than the S&P 500? Check.
Peak decline of 12%, 50% less than the S&P 500.
More than 2x the negative-volatility-adjusted total returns (Sortino ratio) of a 60/40.
(Source: Portfolio Visualizer Premium)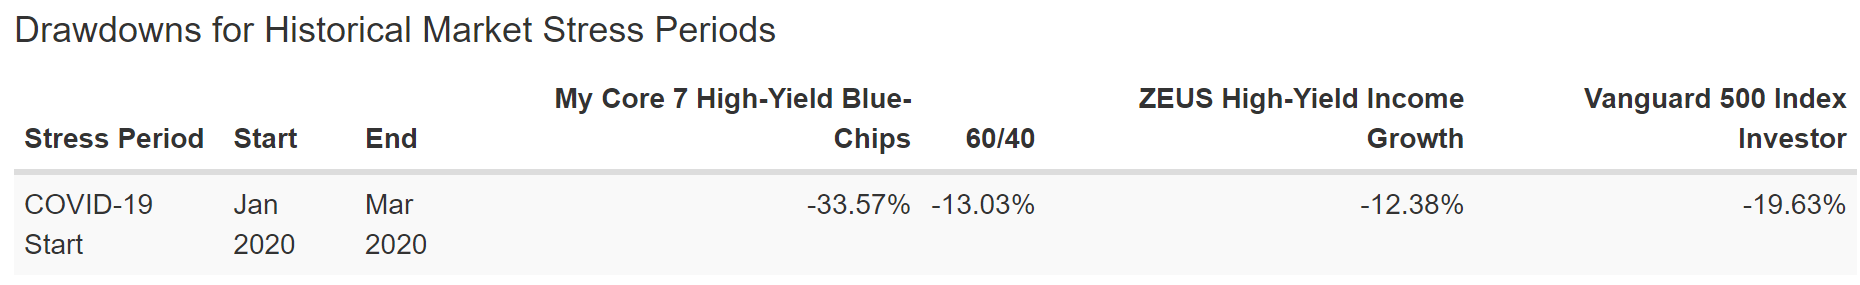
Half the decline of the market during the Pandemic, and 66% less decline than the blue-chips alone.
(Source: Portfolio Visualizer Premium)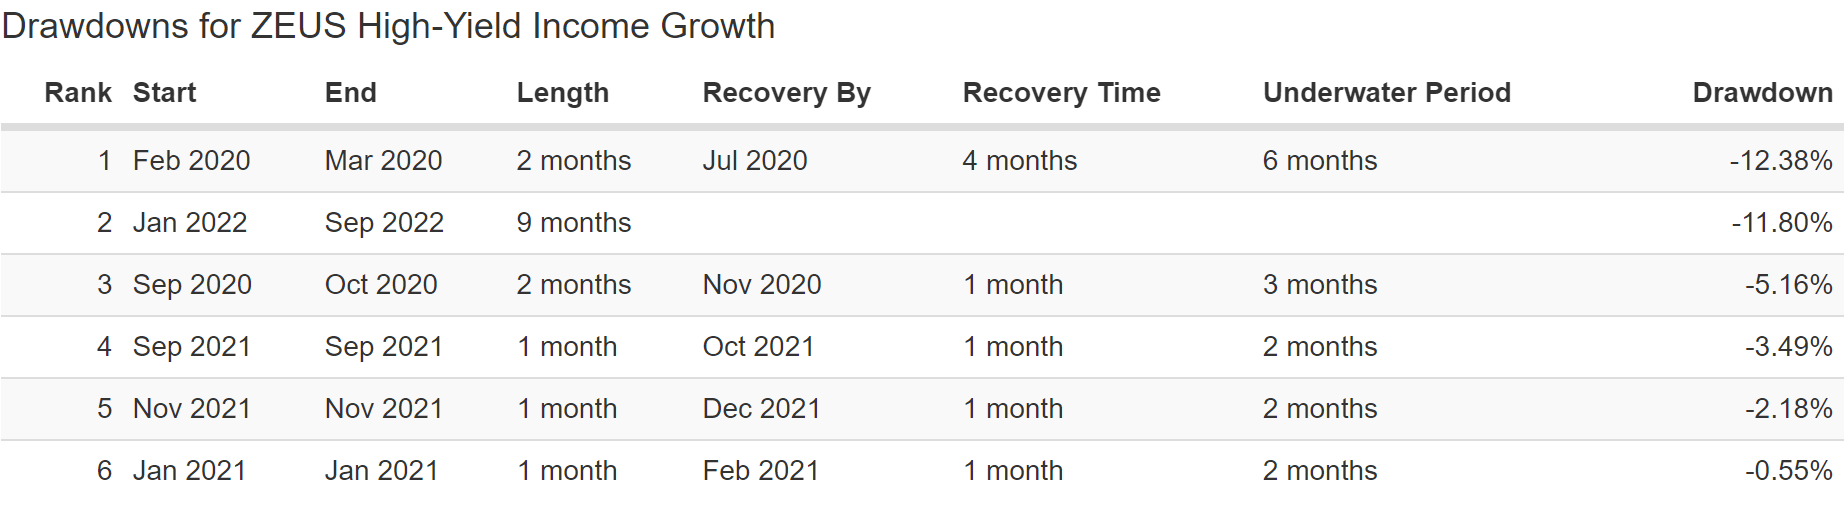
A peak decline of 12% in this bear market compared to:
- Nasdaq -35%
- S&P: -28%
- 60/40: -22%
- My core 7 High-Yield Blue-Chips: -16%.
(Source: Portfolio Visualizer Premium)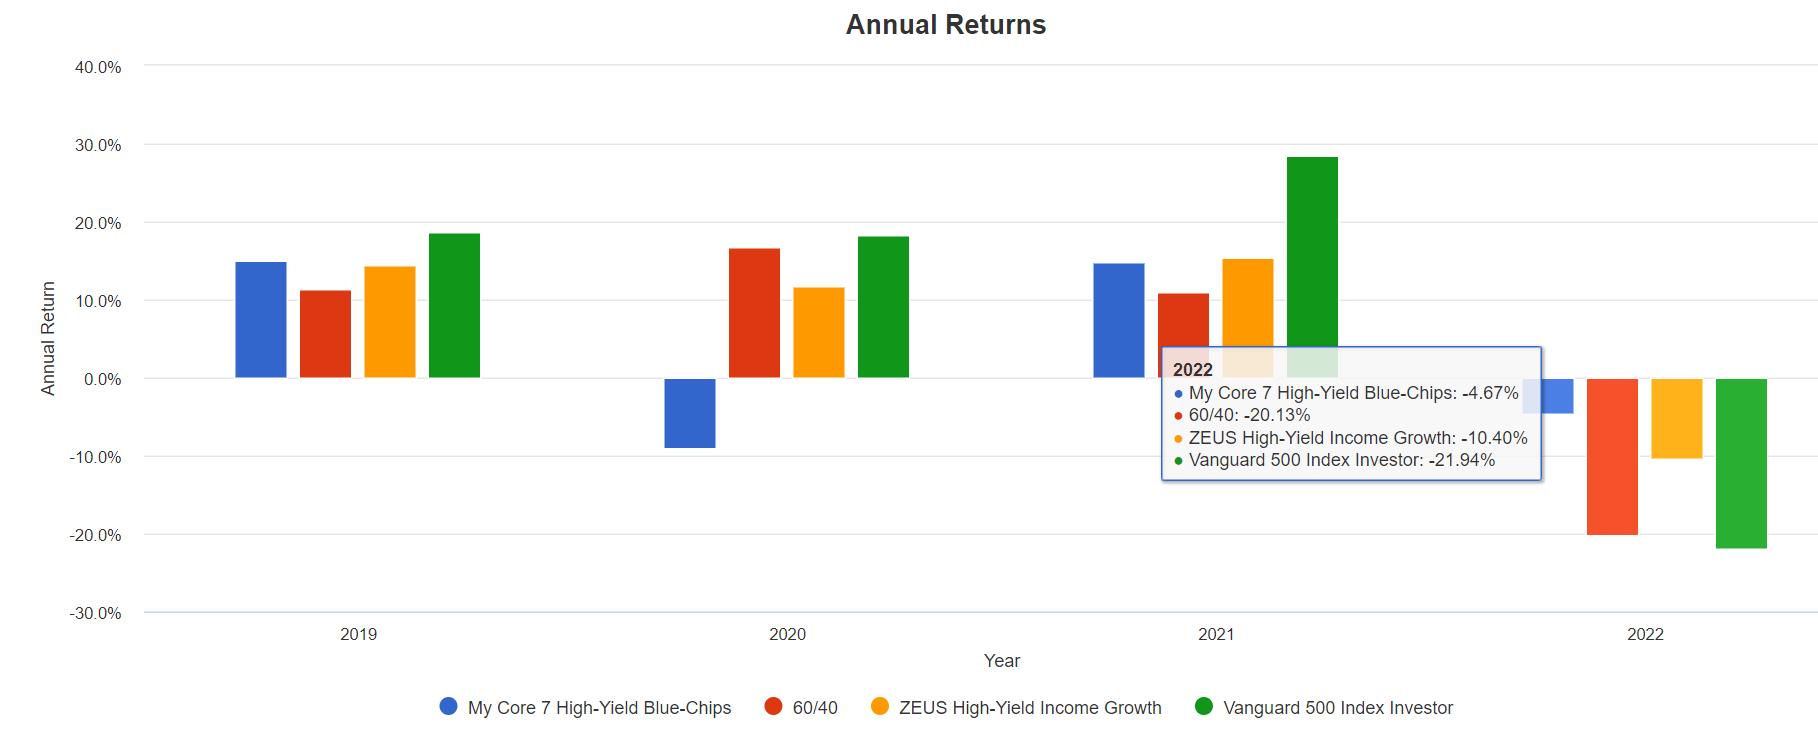
Here are ZEUS’s annual returns:
- Back half of 2019: 14.5% return vs 11.3% 60/40
- 2020: 11.8% vs. 16.8% 60/40
- 2021: 15.4% vs. 11.0% 60/40
- 2022 YTD: -10.4% vs -21.9% 60/40.
Silky smooth ride through one of the most extreme and volatile markets in history.
- like rolling over market potholes in a Rolls Royce.
ZEUS In The 2022 Stagflation Bear Market
(Source: Portfolio Visualizer Premium)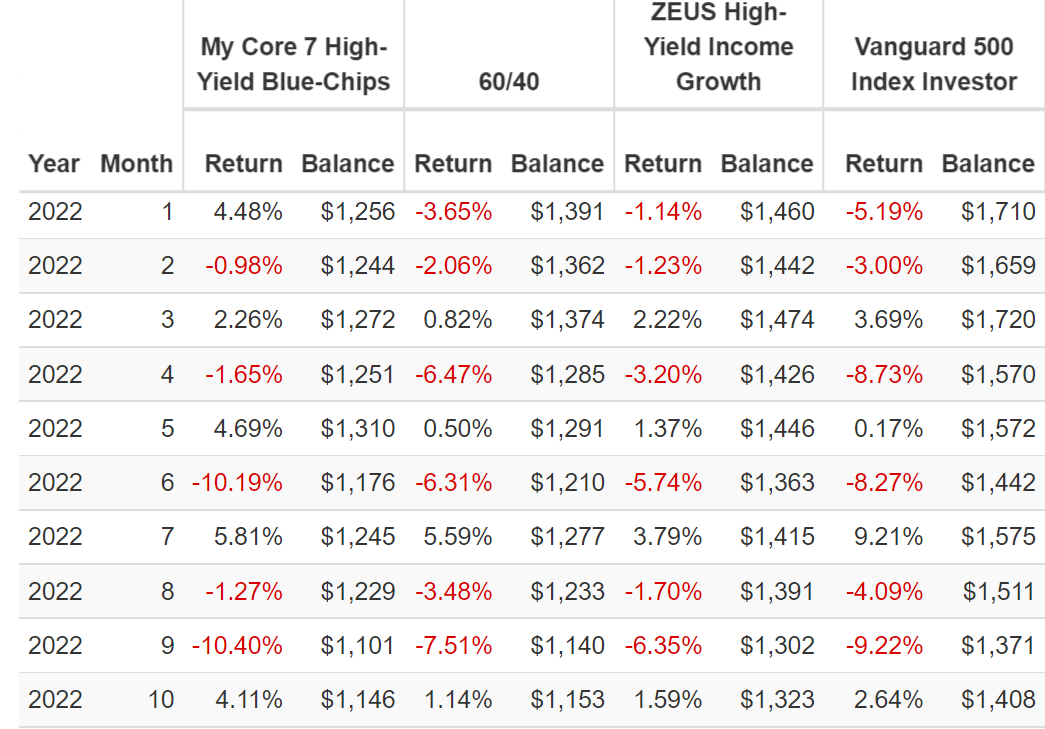
In 2022 we’ve had three market monthly crashes of 8+%.
A 60/40 hasn’t done much better.
ZEUS has beaten the S&P in every down month this year (6/6)
ZEUS had beaten a 60/40 in every down month this year (6/6).
Including falling 6% in September when the S&P fell 9% and the 60/40 8%.
Historical Returns Since January 2014 (SCHD, QQQ, PQTAX, EDV, My Core 7 High-Yield Blue-Chips)
(Source: Portfolio Visualizer Premium)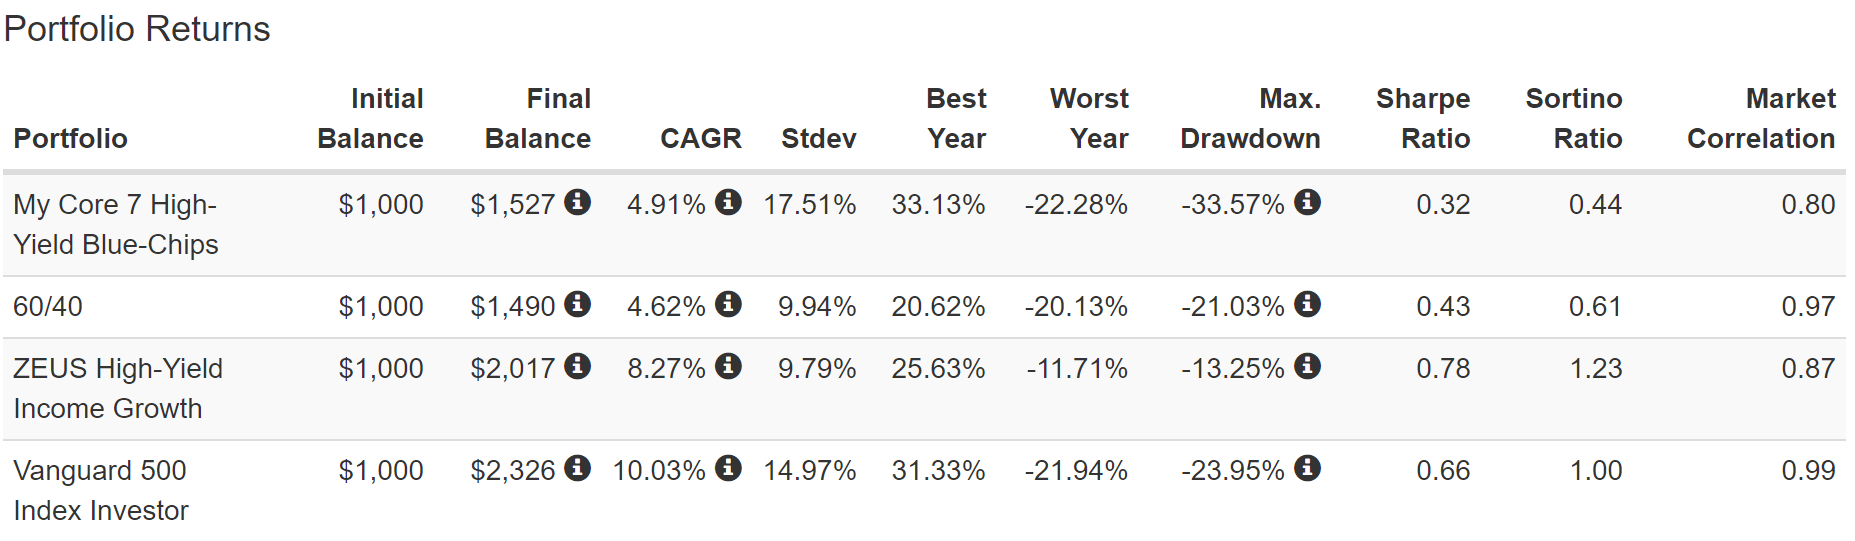
2X the returns of a 60/40 with equal annual volatility and a peak decline half that of the S&P 500.
2X the negative-volatility-adjusted returns of a 60/40 and 23% better than the S&P 500.
(Source: Portfolio Visualizer Premium)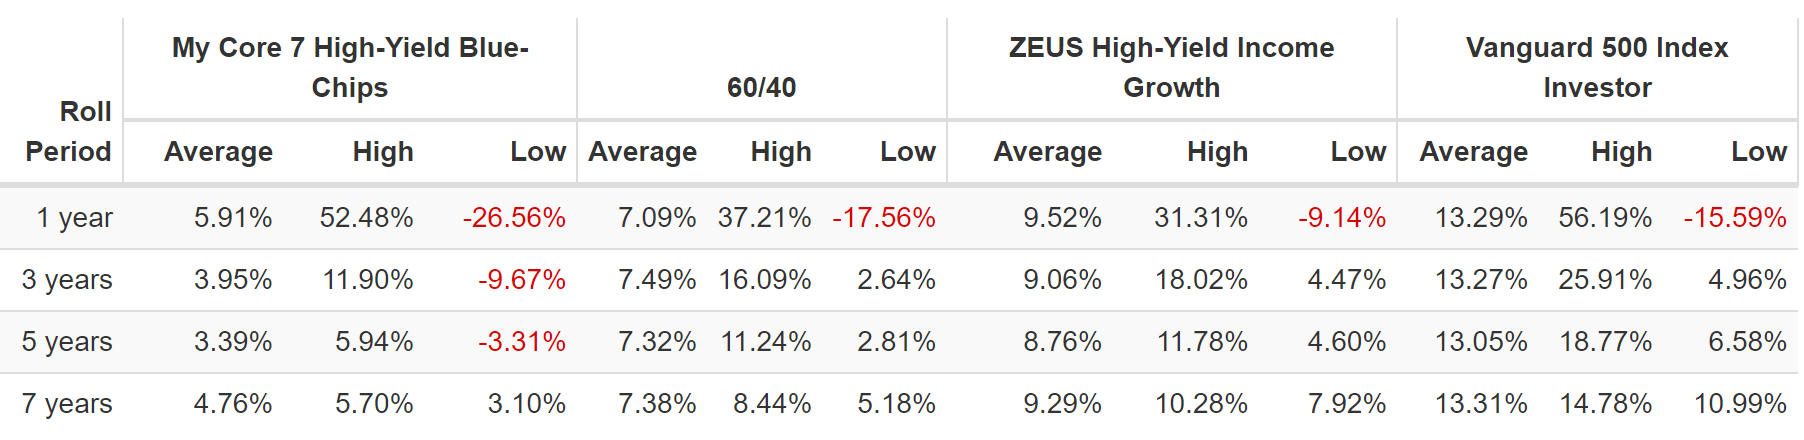
Silky smooth 9% to 9.5% annual returns.
(Source: Portfolio Visualizer Premium)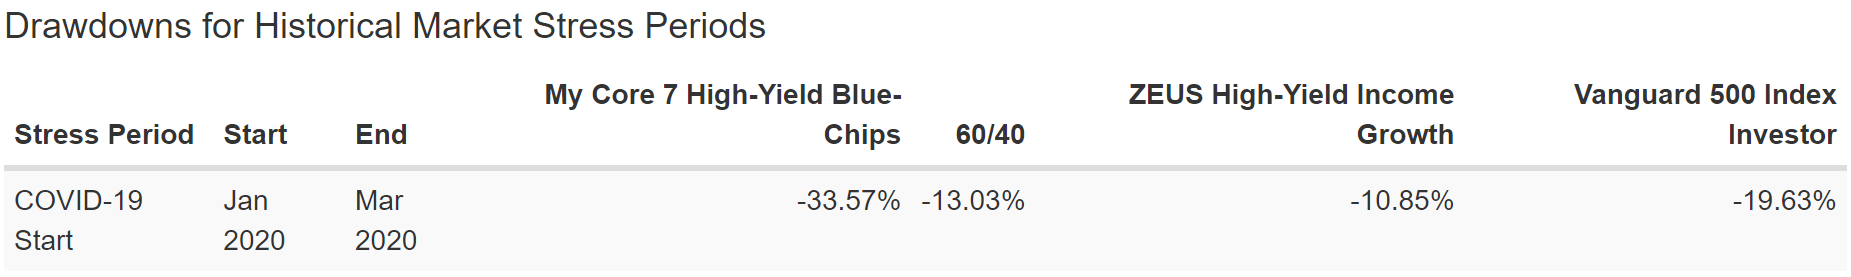
Still half the decline of the market during the pandemic, and 66% less than the blue-chips on their own.
(Source: Portfolio Visualizer Premium)
Just three corrections in eight years and no bear markets.
Now that’s sleeping well at night. And so is this.
ZEUS In The 2018 Bear Market
(Source: Portfolio Visualizer Premium)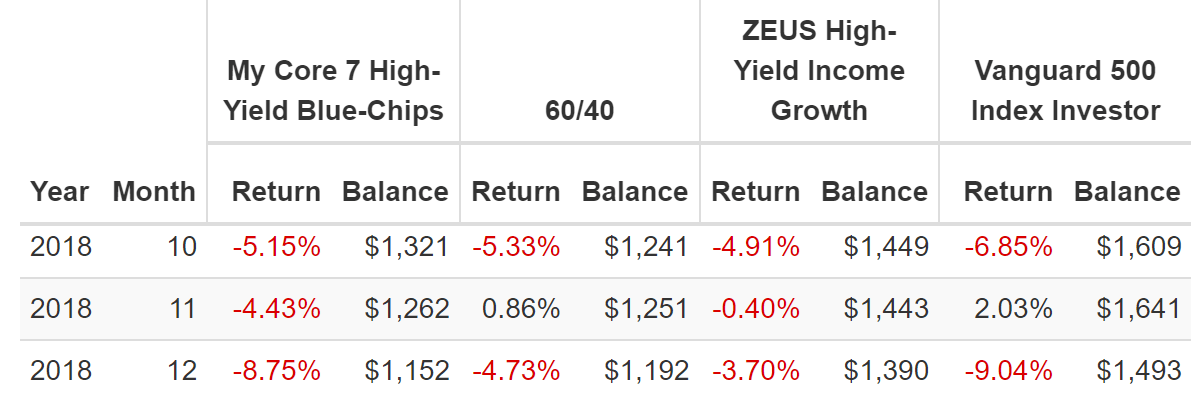
In December 2018 the market hit -21% intraday, including a 17% three week plunge. A 9% decline in December for the market and less than 4% for ZEUS.
Historical Returns Since August 2010 (VYM, QQQ, AMFAX, EDV, My Core 7 High-Yield Blue-Chips)
(Source: Portfolio Visualizer Premium)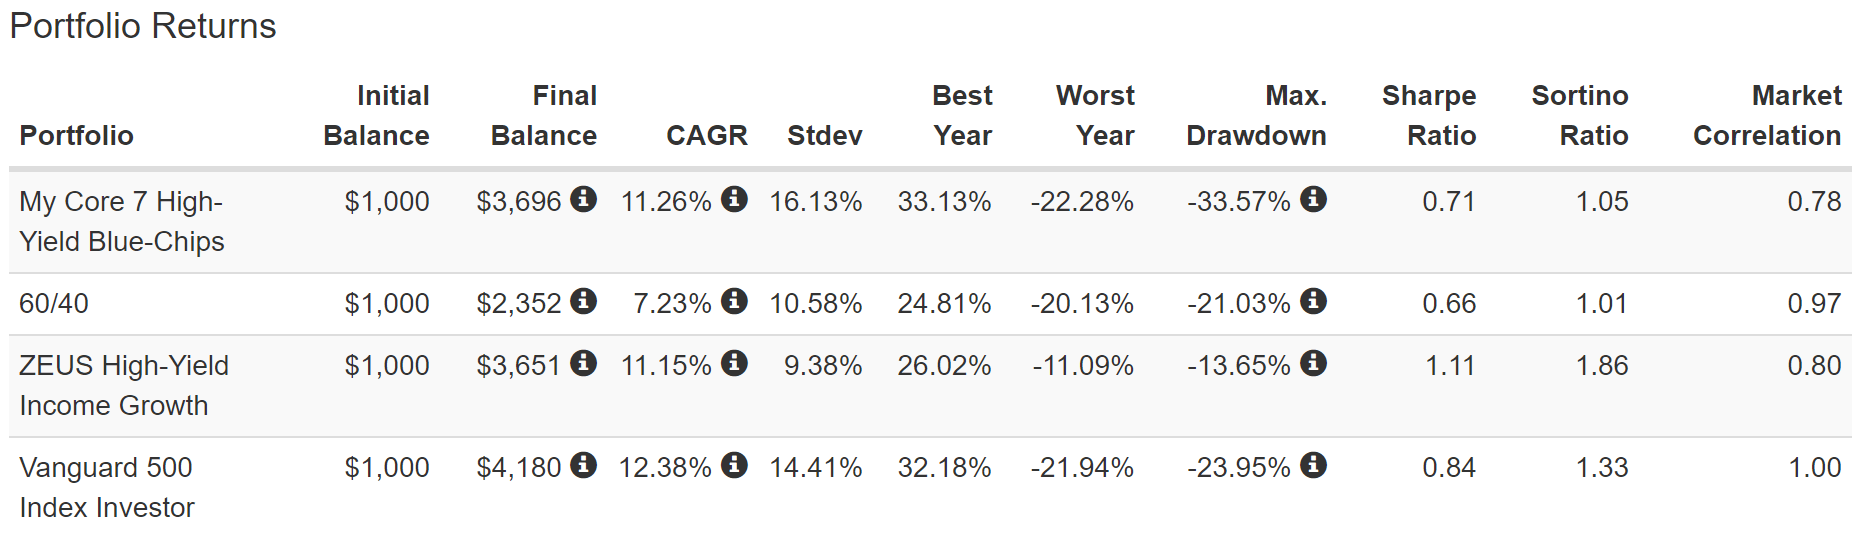
Same returns as the blue-chips on their own, but with 33% less annual volatility and a peak decline of just 14%.
Market matching returns but with a lot less volatility and 40% better negative-volatility-adjusted returns than the S&P.
85% better negative-volatility-adjusted returns than a 60/40 and with 55% higher annual returns.
(Source: Portfolio Visualizer Premium)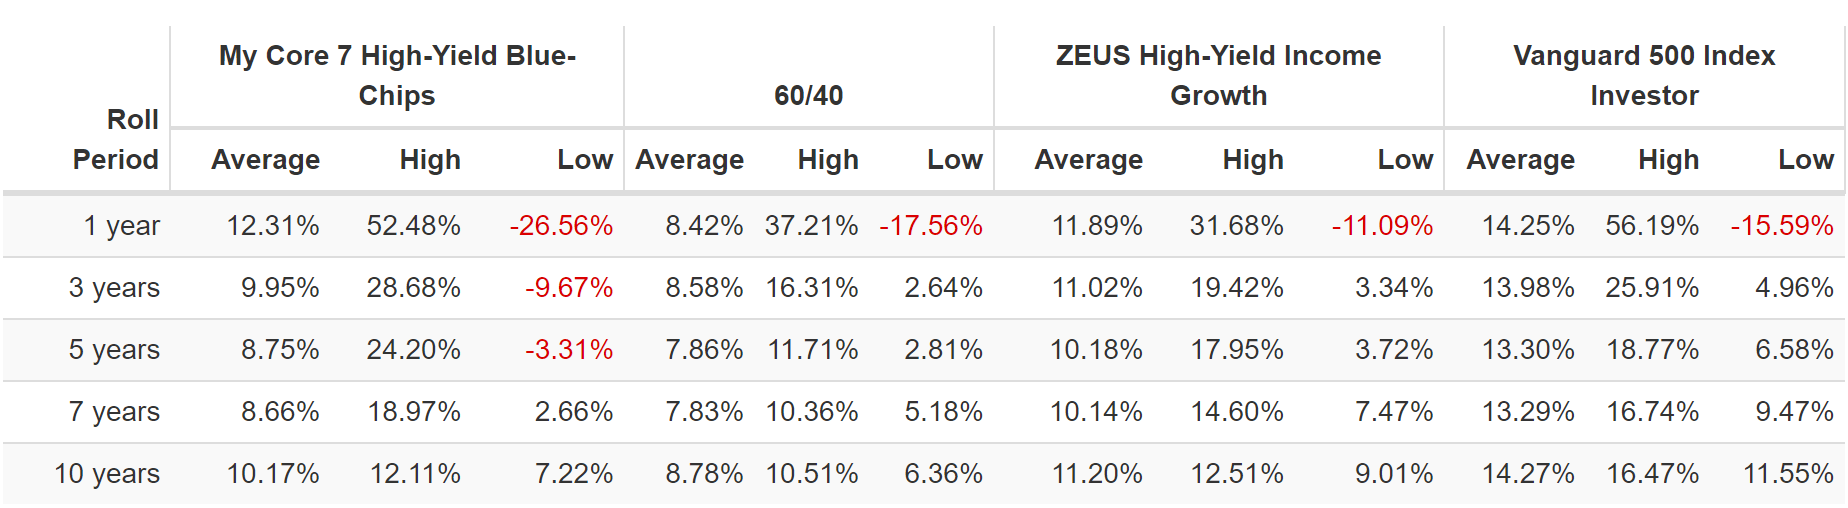
Silky smooth 10% to 12% annual returns that run circles around a 60/40 and almost match the red hot S&P 500 during one of the hottest bull markets in U.S. history.
(Source: Portfolio Visualizer Premium)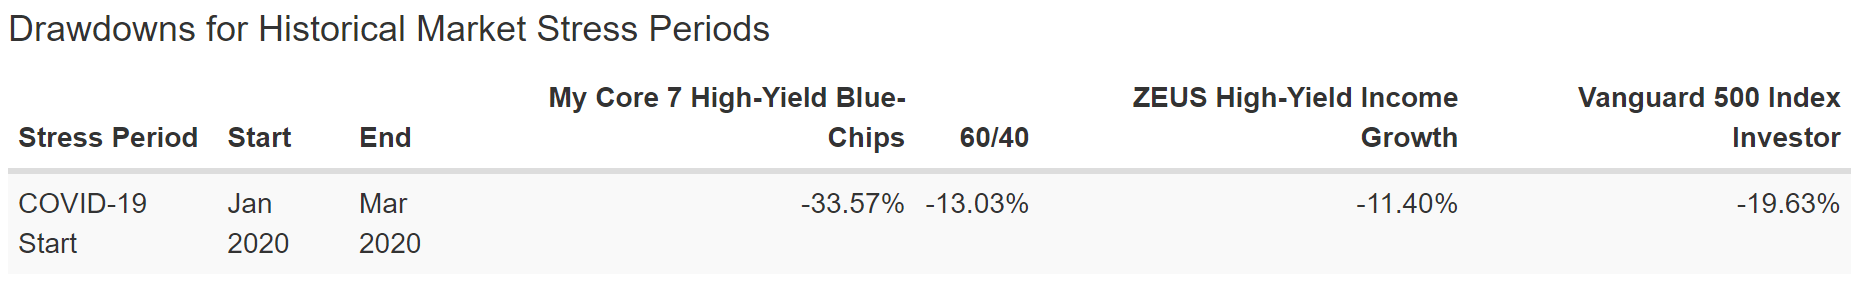
Still half the decline in the Pandemic, even with 33% of the portfolio substituted with other ETFs.
- 90% of returns are driven by asset allocation
- that’s why the total return and volatility profiles are almost identical for every version of this ZEUS portfolio.
(Source: Portfolio Visualizer Premium)
That’s sleeping well at night, and so is this.
ZEUS In The 2011 Bear Market
(Source: Portfolio Visualizer Premium)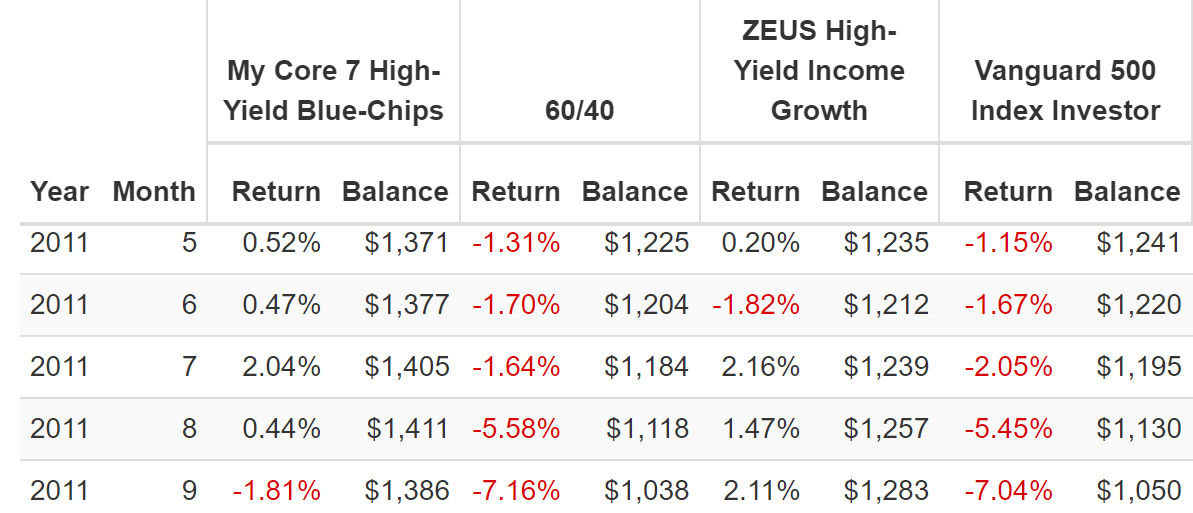
The S&P fell 22% during the 2011 bear market, while ZEUS went up 4%.
- floating over a major market pothole in a hovercraft.
Historical Returns Since March 2007 (VYM, QQQ, RYMTX, TLT, My Core 7 High-Yield Blue-Chips)
(Source: Portfolio Visualizer Premium)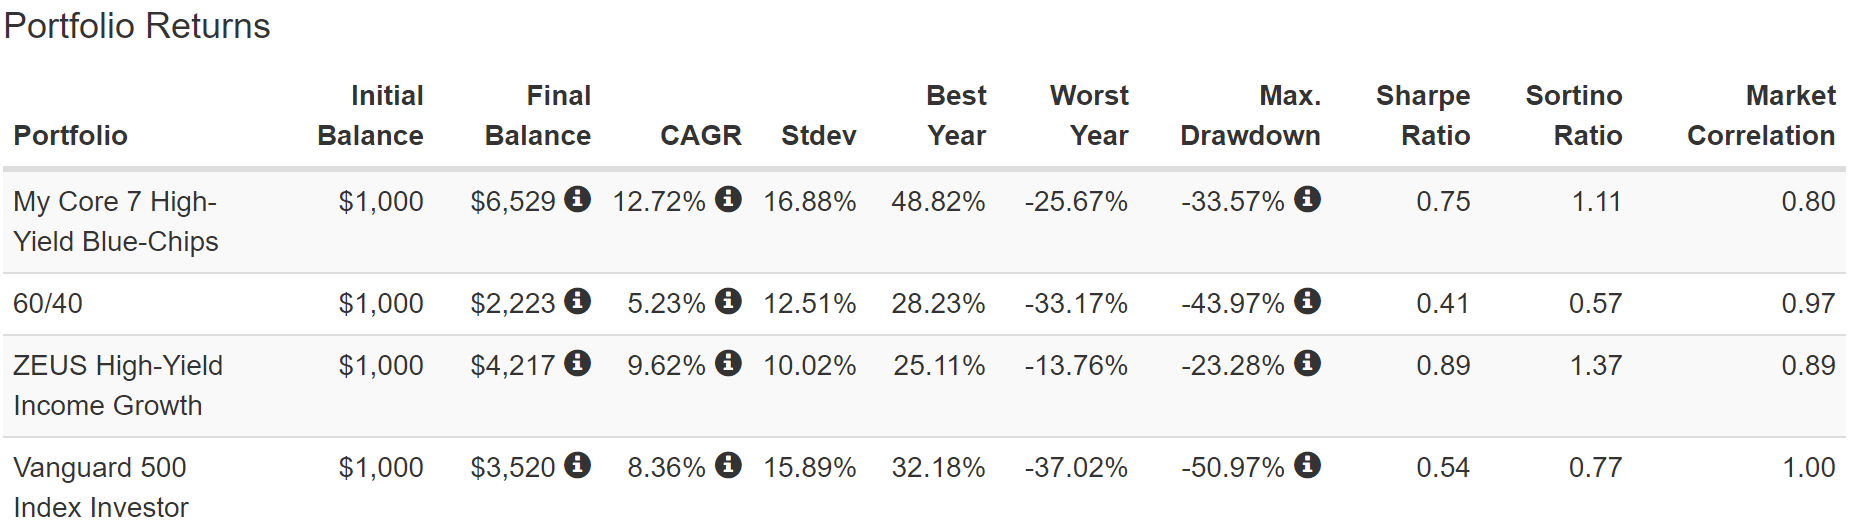
RYMTX is a 2-star rated managed futures fund that I think NO ONE SHOULD EVER BUY. RYMTX is the oldest managed futures fund, and I am using it here to show the returns of the overall ZEUS strategy during the Great Recession.
- the 2nd biggest market crash in U.S. history
- the ultimate trial-by-fire for any sleep-well-at-night portfolio.
2X the 60/40? Check.
Market-beating returns? Check.
33% less annual volatility than the S&P? Check.
50% smaller decline than the S&P during the 2nd biggest market crash in US history? Check.
Almost 3X the Sortino of the 60/40 and better than the high-yield blue-chips on their own.
(Source: Portfolio Visualizer Premium)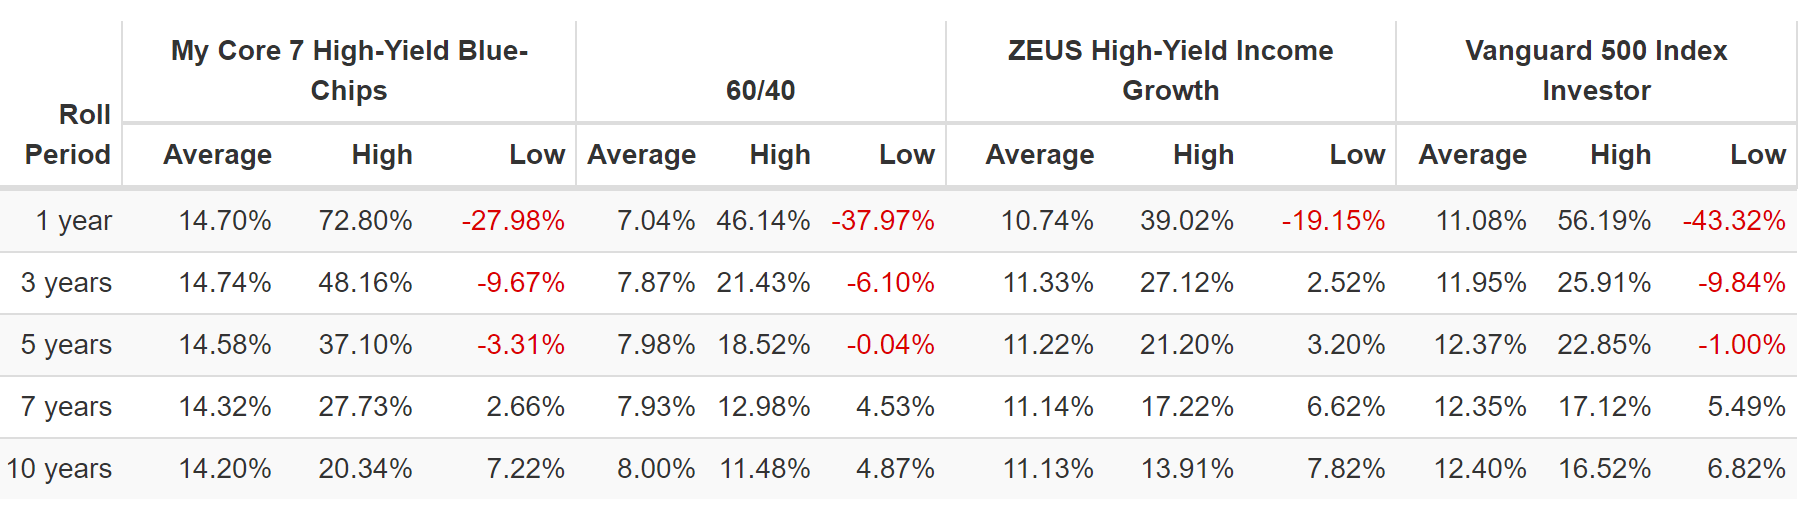
14% annual returns for my core high-yield blue-chips, just like analysts expect in the future.
11% annual returns for ZEUS, just like analysts expect in the future.
7% to 8% annual returns for the 60/40, just like analysts expect in the future.
But never a 3-year period where ZEUS was underwater.
- S&P, 60/40 and the high-yield blue-chips can’t say the same
- the power of diversification and uncorrelated assets at work.
(Source: Portfolio Visualizer Premium)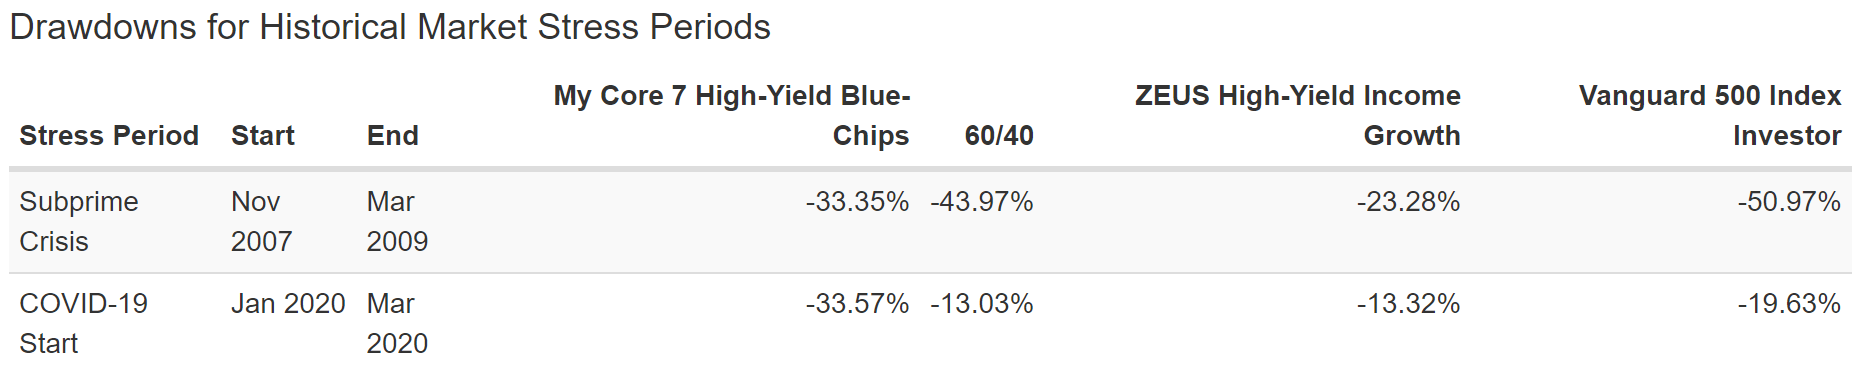
50% smaller decline than the S&P in the Great Recession and Pandemic and 2018 bear market.
(Source: Portfolio Visualizer Premium)
What about 2011’s bear market?
- this ZEUS iteration went up 0.5% while the market fell 22%.
It’s also down half as much in the 2022 bear market.
And now let’s take a closer look at the ultimate stress test, the Great Recession.
ZEUS In The Great Recession
(Source: Portfolio Visualizer Premium)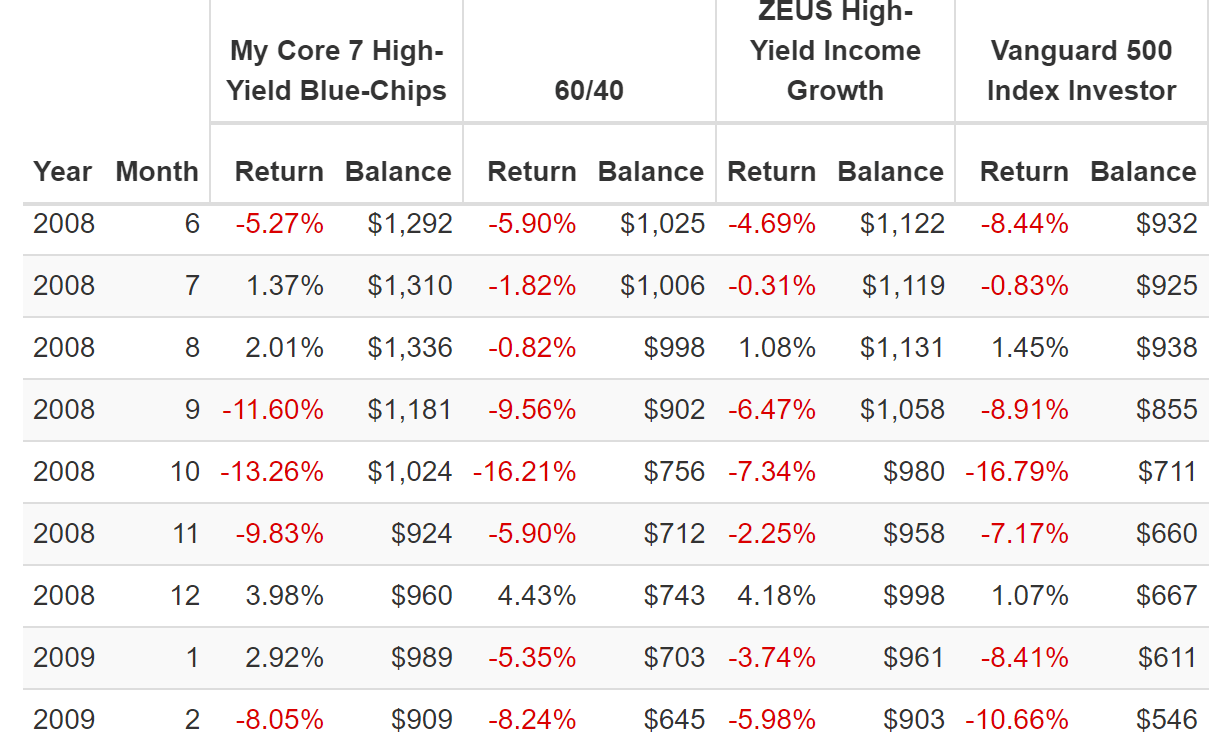
The market fell 17% in October 2008 and the high-yield blue-chips fell 13% (beating a 60/40).
But ZEUS fell just 7% almost 60% less.
February 2009 stocks fell 11% and ZEUS 6%, 45% less.
This is the power of a diversified and prudently risk-managed recession-optimized portfolio. This is the power of ZEUS.
- higher safe yield
- better returns
- lower volatility
- and peak declines that are 33% to 66% smaller in even the most extreme market crashes and panics.
Bottom Line: I’m Buying These 7 High-Yield Blue Chips And So Should You
Bear markets are terrifying for some, exhausting for many, but always profitable for smart long-term investors.
I don’t know when the bottom will finally arrive, I have only a vague notion based on the economic fundamentals and market history.
But it doesn’t matter to me, because I’m not a short-term trader trying to score a quick 10% or 20% gain. I’m a long-term investor on a mission to build a perpetual charitable trust and change the world through blue-chip dividends.
When your time horizon is 5+ years, bear markets aren’t terrifying, they are exhilarating.
This bear market is the Olympics for portfolio builders like myself, an opportunity to prove that safety and quality first, and prudent valuation and sound risk management always trumps the “red hot” momentum stocks that were all the rage for the last few years.
Only when the tide goes out do you see whose been swimming naked.” -Warren Buffett
The intelligent investor is a realist who buys from pessimists and sells to optimists.” – Ben Graham
The Pandemic bubble is over! The “new normal” of zero interest rates and speculative “TINA” momentum chasing is over.
The world of fundamentals and valuation has returned in spectacular fashion.
Dividends are red hot again, as they deserve to be, and MO, MMP, VFC, ENB, CMI, and KEYUF are my seven highest priority high-yield blue-chips for this bear market.
And here’s why:
- 6.7% very safe yield
- BBB+ stable credit rating
- 27-year dividend growth streak
- 7.6% long-term growth rate
- 14.3% long-term total return potential (just as they’ve delivered for the last 19 years)
- 17% annual income growth
- 31% undervalued = 9.5X earnings and cash flow
- 30% annual return potential through 2024
This is how I am surviving and thriving in this bear market. Not by trying to time the market and obsessively watching the Fed or bond yields, and try to guess what Putin will do next.
The only thing we can control is our approach to risk management and with world-class blue-chips like these you never have to pray for luck.
- seven management teams with 70th global percentile risk management are handling all the scary stuff for me!
Instead of trying to time the market and outsmart everyone, why not let the world’s best companies working hard for you, so that one day you don’t have to?
Why not let the proven power of blue-chip dividends float you to a rich retirement on a sea of very safe and exponentially growing income?
Why not take charge of your financial destiny and retire in safety and splendor, with supercharged long-term returns and eye-popping sustainable yield, courtesy of this bear market?
That’s my plan, what’s yours?
Be the first to comment