


byakkaya/E+ via Getty Images
Written by Nick Ackerman, co-produced by Stanford Chemist. This article was originally published to members of the CEF/ETF Income Laboratory on March 25th, 2022.
Voya Global Advantage and Premium Opportunity Fund (NYSE:IGA) can provide investors with a more unique portfolio. They have a tilt towards global positions and what would be considered more value stocks. The most significant exposure in the fund is to financials. This is then followed by healthcare. This type of weighting has meant the fund has held up a bit better this year.
On the other hand, geopolitical risks with uncertainty in Europe with Russia’s invasion of Ukraine might keep global stocks a bit cheaper for another year. Initially, I was more optimistic heading into the year with international positioning due to cheap valuations. Once the invasion happened, that seemed to have shifted investors’ focus back to U.S. investments. That isn’t to say that U.S. equities don’t have their own uncertainties going on at this time.
What is more certain for IGA is that the fund’s current discount is quite appealing. The current distribution yield certainly doesn’t hurt at over 8% either.
The Basics
- 1-Year Z-score: -2.18
- Discount: 11.76%
- Distribution Yield: 8.25%
- Expense Ratio: 1.16%
- Leverage: N/A
- Managed Assets: $172.1 million
- Structure: Perpetual
IGA’s investment objective is “a high level of income; capital appreciation is secondary.” They intend to write “call options on indexes or ETFs, on an amount of equal to approximately 50-100% of the value of the Fund’s common stock holdings.” Typically, this is an important metric to look at. This can help gauge how bullish or bearish the fund may be leaning.
The more overwritten the portfolio, then the more that would indicate they are bearish. They would not want to be overwritten to a significant degree if they felt like the indexes would continue significantly higher.
With that, they are right near the bottom end of their range, with the fourth quarter 2021 Fact Sheet showing a 49.94% percent of the portfolio being overwritten. That seems to indicate that they should expect indexes to rise from here. Although, this is almost exactly how they were positioned in our previous update.
The fund is fairly small, so larger investors should be cautious. That can add additional risks if an investor needs to get out of the position quickly. On the other hand, most closed-end funds are leveraged, and IGA is not. So that is one less concern to be worried about with this fund. That is especially true with higher interest rates coming; other CEFs will contend with that as their leverage expenses increase.
IGA’s expense ratio comes to 1.16%, according to their last Semi-Annual Report. The expense ratio they state on their website is 0.96%. For CEFs, neither figure would be particularly onerous.
Performance – Attractive Discount
The biggest criticism of IGA is its historical performance. I agree; it hasn’t performed well compared to peers in the option writing CEF space. That’s why I highlight it just about every time I cover this fund. Over the last decade-plus now, U.S. investments have been outperforming their U.S. counterparts. Given that the portfolio has a sleeve of international positions, that has held the fund back relative to a pure U.S. exposure.
On top of this, I had already noted the positioning that is geared more towards a value-oriented portfolio. The more popular funds, usually offered by Eaton Vance, are packed full of tech plays. While I believe that the EV funds deserve a place in an investor’s portfolio, I think there can be some room for diversification.
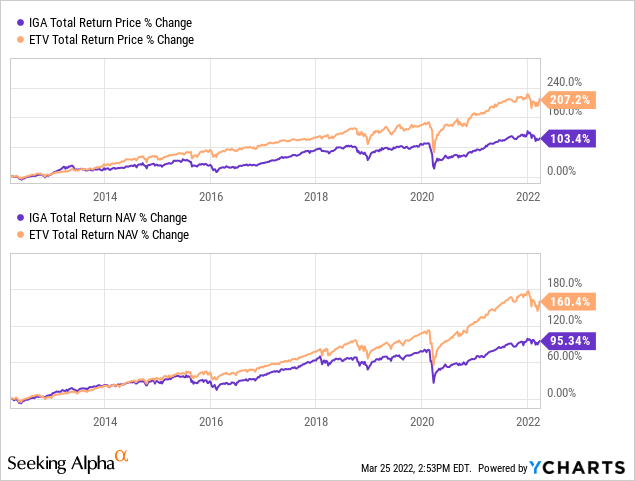
Below is the last 10-year performance of IGA compared to Eaton Vance Tax-Managed Buy-Write Opportunities Fund (ETV). ETV is one of the more popular EV funds. The holdings are almost entirely in the U.S., and in their last report, they showed 36.8% of their portfolio is in tech.
Ycharts
That is certainly an impressive outperformance, as one would expect for a U.S. large-cap tech-heavy portfolio. Based on today’s valuation, IGA would appear to be the better buy at a deep discount. If international stocks get some appreciation, that could further help IGA out when it comes to performance going forward.
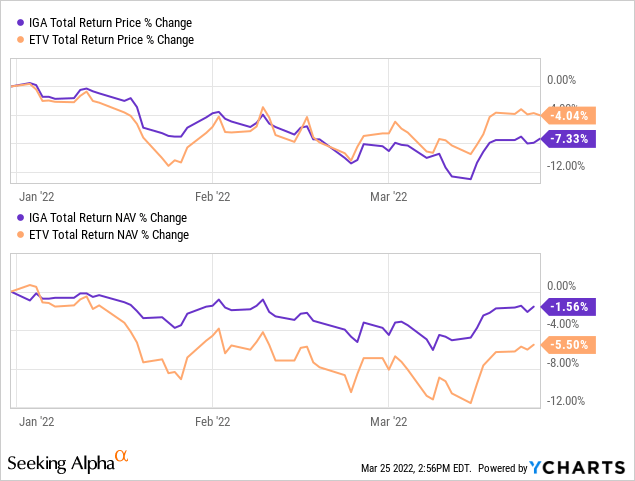
We see some of this playing out already too. IGA’s total NAV performance on a YTD basis has outperformed ETV. Yet, ETV’s total price return has come in higher. That has only expanded ETV’s premium further.
Ycharts
The main takeaway here is that I believe positions in both of these funds for further diversification could be worthwhile. I’m not necessarily saying sell ETV completely for those holding that position and swap.
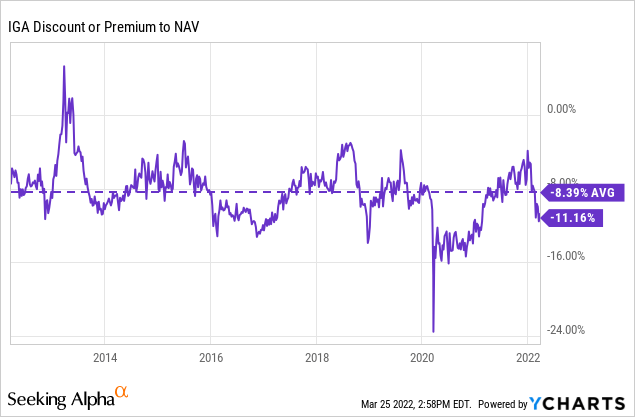
At IGA’s current discount, we are now seeing a deeper discount than the last 10-year average.
Ycharts
Distribution – 8.25% Distribution Yield
Besides the discount, I believe the distribution at the current level is pretty attractive too. It comes out to 7.33% on a NAV basis, which seems to be a reasonable and sustainable level. Since the fund’s launch, they have had several adjustments downward of the distribution and combining that with the quarterly payout, I think that turns a lot of investors away.
However, that comes back again to how the fund’s performance has been over the longer term. It has undoubtedly been weaker, relatively speaking. So it doesn’t come as a surprise to see a weaker historical distribution payout with cuts. Launching near the end of 2005 really set this fund up for some pain only a couple of years out of the gate too.
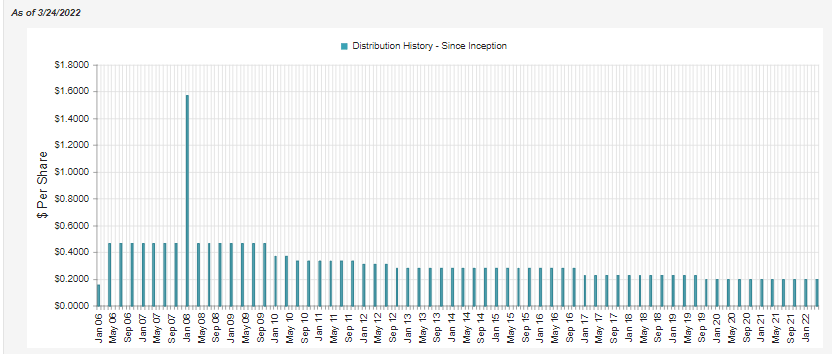
IGA Distribution History (CEFConnect)
To cover the fund’s distribution to investors, they will rely on capital gains generated from the underlying portfolio. This isn’t anything too unheard of for equity funds.
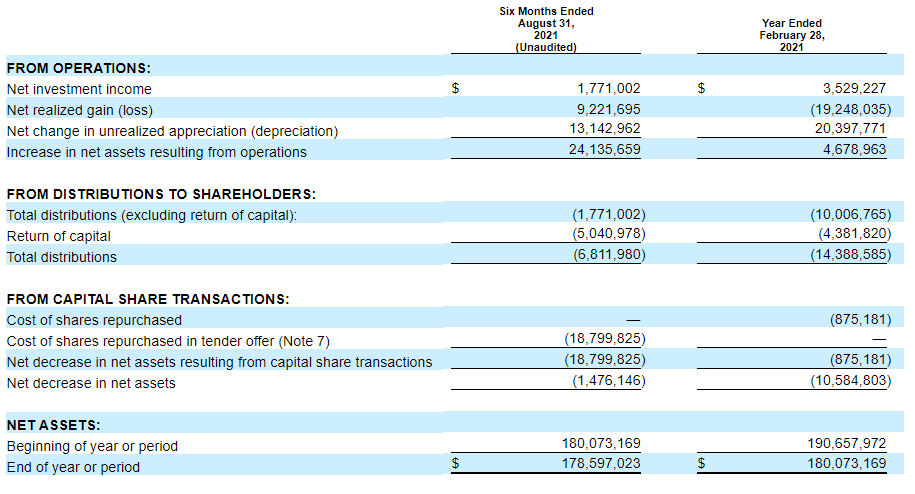
IGA Semi-Annual Report (Voya)
The NII coverage comes in at around 26% for the last six months reported. That is about equal to the around 25% that the coverage level was in their previous fiscal year.
From the above, we can also see that in 2021 they were implementing a share buyback program. When CEFs buy shares back at below NAV, it is accretive and can be beneficial to shareholders. This repurchase program is effective until March 31st, 2022. With their next Annual Report, it will be interesting to see if they were still doing some repurchases. There was also the tender offer which we had noted in another previous article.
IGA’s Portfolio
We’ve already touched on IGA’s portfolio throughout this article, but we can now take a deeper look. In terms of the portfolio composition, it is mainly equity-based at 96.61% of the assets. They also tend to be pretty active, with a higher turnover rate reported. Over the previous six months, it was 34%. In the prior fiscal year, it was 74%, and in 2020, they were even more active, with a turnover rate coming in at 130%.
The last reported weighting of their portfolio in terms of geography still has the U.S. at the largest weighting. This is normal even for a global fund. Following that, we have exposure to Japan, Canada and the U.K.
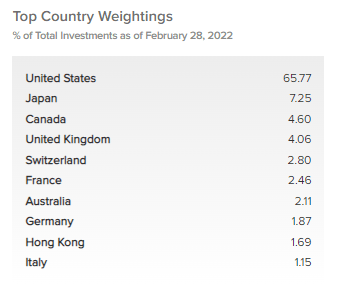
IGA Country Weighting (Voya)
This overall weighting hasn’t changed materially from the allocations listed in our prior coverage. At that time, 65.39% was allocated to the U.S., then 7.41% for Japan, Canada at 4.41% and the U.K. at 4.01%. So at least in that regard, the elevated level of portfolio turnover isn’t changing the composition of the fund too materially.
The sector weighting of the fund has changed, but only to a minor degree.
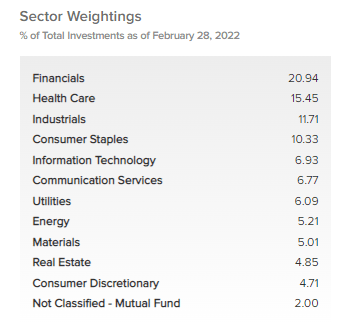
IGA Sector Weightings (Voya)
The financial exposure had fallen just a touch from the 22.76% previous allocation. Healthcare, industrials and consumer staples are still in the same order of exposure as the last time. Tech follows after those sector weightings. That had actually decreased from the already rather low 7.99% at the end of Q3 2021 that was reported. I believe the portfolio weighting of this fund is what makes it a worthwhile diversifier for an investor’s portfolio.
The positions that represent the top holdings of the fund are rather unique in terms of not seeing them elsewhere usually. Thus, how we get the diversification that IGA can offer. However, they note that they have 254 holdings. The top ten also don’t constitute a particularly hefty weighting either. That means that there isn’t a position or two that can really change the outcome of the fund. That can either be positive or negative.
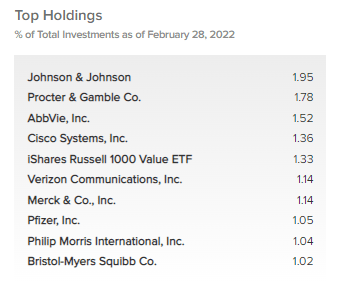
IGA Top Ten (Voya)
The top ten make up roughly 13.3% of the portfolio’s assets. Johnson & Johnson (JNJ) leads the way with its 1.95% weighting. What might be a bit interesting here is how financials make up the largest weighting of the portfolio. Yet, the top ten are tilted more towards healthcare overall.
Besides JNJ, there is AbbVie (ABBV), Merck (MRK), Pfizer (PFE) and Bristol Myers Squibb (BMY) as all healthcare-related stocks.
On another interesting note, we also have iShares Russell 1000 Value ETF (IWD) make its way into the top ten. This isn’t the first time we’ve seen this position in IGA, either. That essentially means that besides the number of holdings IGA is already holding, there is exposure to another 850 positions. Of course, give or take some as there is going to be overlap. Except, IWD only represents a 1.33% weighting, so on its own isn’t going to move this fund materially.
Conclusion
IGA seems to represent a fairly attractive value in the market at this time. The fund’s discount is deeper than its longer-term average. The distribution rate is also quite appealing at this level, with a reasonable payout that should be sustainable at this time. Of course, geopolitical uncertainty could change things quite rapidly. The fund relies on capital gains to fund their distributions, so further weakness could cause concern. On the other hand, IGA has held up better than its more tech-oriented peers on a YTD basis.
Another consideration that gets brought up when touching on IGA is its sister fund, Voya Global Equity Dividend and Premium Opportunity Fund (IGD). This is one that I hold. I ended up with this position when the tender offer was conducted last year, and IGD bought back a more significant portion. This worked to my benefit; I’ve been sitting on some unrealized gains since then. I am holding it in a taxable account, so I have waited until they turned to long-term gains. That’s been accomplished now, so I’ve considered moving back to IGA since.
IGD is a similar fund with the same objectives and investment policy. They have a lot of overlap, and their top ten are quite identical. Notably, IWD is not a position in IGD’s portfolio. It is a much larger fund with around $513.2 million in assets. The distribution is also paid monthly, which some investors prefer. I think it certainly doesn’t hurt, but it doesn’t dictate whether I invest in a fund or not.
More interesting is that IGA has outperformed IGD quite handily over the longer term. This is by a meaningful amount too.
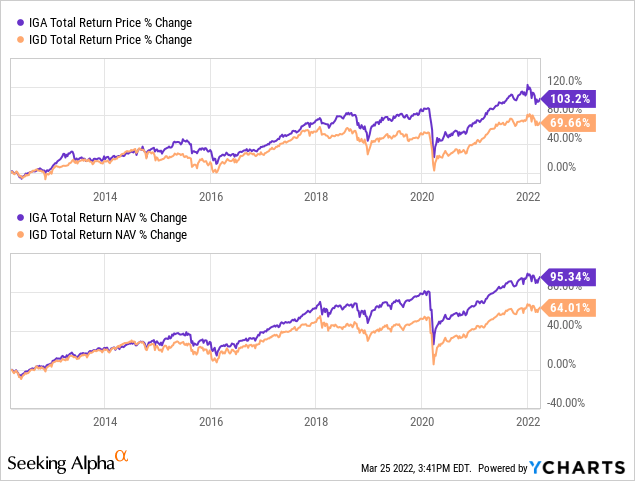
Ycharts
The differences seem to start showing up in 2015 and 2016. Then in 2018, it appears more noticeable. Even on a more recent look at performance, we see IGA performing better. The below chart is a YTD comparison.
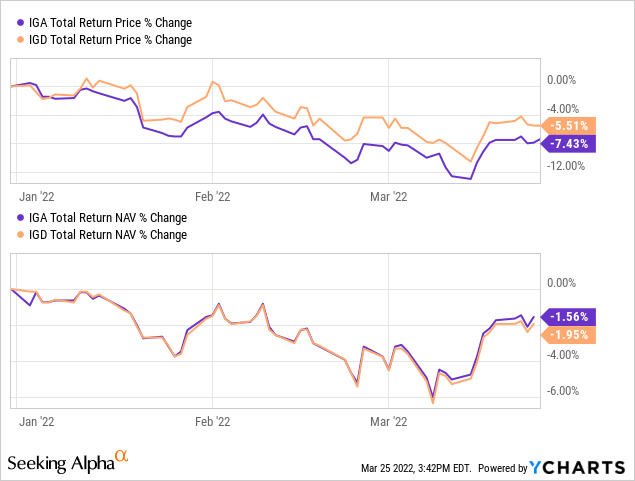
Ycharts
Both of the charts above show total returns, so that is taking into effect the distributions paid out. This is happening even though they share a lot of overlap. In fact, IGD also lists 254 holdings at this time. That is the same number as IGA.
At this time, IGD’s discount comes to 10.09% compared to IGA’s 11.16%. If this diverges further from here, I will make the switch back to IGA.
Be the first to comment