

fatido/iStock via Getty Images
This article was written by Williams Equity Research (“WER”)
You may recall an article a few days ago titled, The ‘Fab 5’ REITs That Could Put You In The Championship Bracket, in which we provided readers with a list of 5 of the best REITs to buy right now.
As March Madness continues to play out, we are going to now move over to the BDC (business development company) sector to clear up a few misconceptions (regarding BDCs).
We have found that many of our iREIT on Alpha members always own BDCs, so it makes sense for us to expand our coverage into this high-yielding asset class. In a few days we’ll provide you with our “Final 4” BDCs, and I hope you enjoy this well-researched overview of BDCs.
Setting The Stage
Business Development Companies (“BDCs”), like Real Estate Investment Trusts (“REITs”) and Master Limited Partnerships (“MLPs”), are special company structures created by legislation to solve certain problems.
In the case of REITs, it was to give the average investor access to diversified real estate at a reasonable cost and ease the capital raising process by eliminating taxation at the corporate level.
MLPs increased the ability to raise money for infrastructure (usually but not exclusively energy oriented) in a similar way. Decades later, there are trillions of dollars in assets in these more focused and efficient vehicles for owning hard assets like real estate and pipeline.
BDCs take a different approach and are not involved primarily in the ownership of hard assets. Instead, BDCs are required to invest at least 70% of assets in the debt and or equity of U.S. businesses.
In practice, these are private companies that depend on BDCs for a significant portion of their lending needs. While regular banks can and still do play a role, it often requires a BDC to help a company take on debt to buy out management, materially expand their operational footprint, or invest in a new service line. BDCs have other types of constraints as well, such as limits on leverage.
Positive attributes of most BDCs include majority floating rate investments less sensitive to changes in interest rates, average yields well above 7%, highly diversified loan pools, and a business model that has now been around for decades.
BDCs are often a “love or hate” sector to many investors. The most common explanations for avoiding the sector usually boil down to one or more of these four:
- Poor performance and corporate governance concerns of certain non-traded BDCs;
- Poor performance and corporate governance concerns of certain publicly traded BDCs and their external managers;
- Confusion around the return profile of BDCs in general; and/or
- Confusion around what BDCs do and own in their portfolios.
This article is designed to provide enough reasoning to paint a clear picture without getting too deep into the weeds. As a result, there will be items that we do not cover here. These are included in our BDC foundations series available to subscribers desiring a greater understanding.
Like most things in life, there is a grain of truth or at least a reasonable reason why these assumptions about why BDCs are problematic are held by many. We’ll include those in our discussion too alongside tips to minimize those risks. With that, let’s tackle the first three of the 10 most common BDC misconceptions.
1. BDCs Are Too Risky
Just like banking or energy or any other sector, there are certainly members of the BDC club that are higher risk. That does not necessarily mean the whole sector deserves that classification. In order to tackle this first misconception, we need definitions. It’s not possible or useful to encompass every possible definition of risk, but we’ll narrow it down to two: solvency and earnings stability.
Solvency is the straightforward one and we’ll use the latest two major crises to evaluate. Based on our research and that of others, not a single BDC went bankrupt during the Great Recession. Plenty of banks and other types of companies cannot say the same. Certain BDCs did run into liquidity problems, however, and this put immense pressure on their share prices.
Yahoo Finance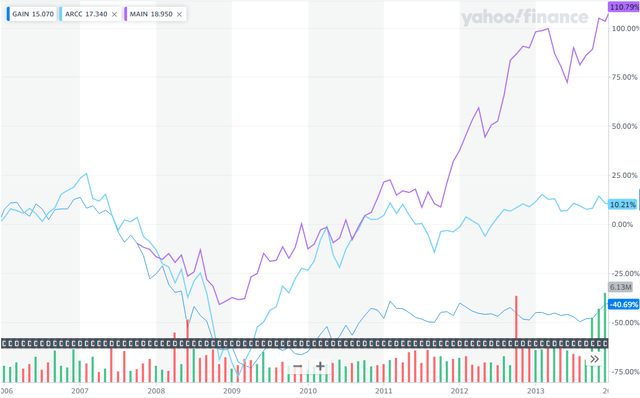
This chart shows the performance of Main Street Capital (MAIN) in purple, Ares Capital Credit (ARCC) in teal, and Gladstone Investment (GAIN) in blue from 1/1/2006 through 1/1/2014. ARCC, easily one of the best managed BDCs, declined by approximately 75% peak-to-trough during the Great Recession. GAIN wasn’t far behind at down 73%.
MAIN, the most popular internally managed BDC, had a maximum decline of roughly 40%. For context, the SPDR S&P 500 ETF (SPY) experienced about the same drawdown as MAIN. In fact, there wasn’t any material length of time that MAIN didn’t outperform the S&P 500 in the years immediately before, during, and after the Great Recession excluding dividends.
On the other hand, ARCC needed until Q1 of 2010 before it closed the gap with the S&P 500. GAIN’s forced liquidations and other challenges resulting from the Great Recession meant it took many more years before it was back to normal.
As you may have noticed, this discussion was designed to illustrate each BDC’s unique profile had a major impact on its share price performance during the Great Recession. In terms of solvency, however, BDCs did far better than the broader financial services sector. Investors ran into trouble (and many did) when they:
1) panic sold BDCs near the bottom, and/or
2) didn’t perform firm specific underwriting, which could have been mitigated through diversification.
What about 2020?
Yahoo Finance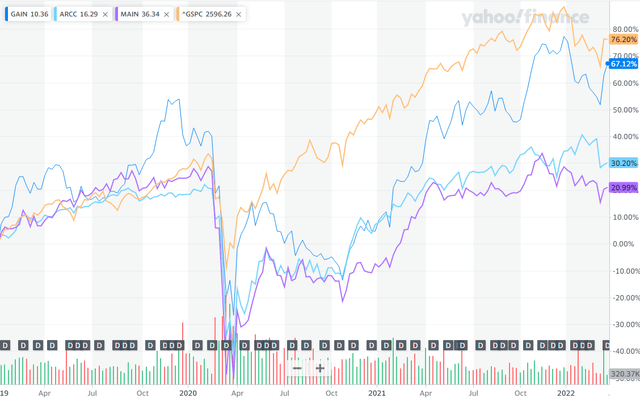
Like most financial companies, BDCs went into 2020 with far lower levels of leverage and risk compared to 2008/2009. As a result of this factor and their inherent stability, zero BDCs went bankrupt due to the pandemic and the vast majority exceeded their early 2019 pre-pandemic share prices by early 2021, or less than 12 months after equity markets set lows.
BDCs once again experienced a larger drawdown (10-30%) than the S&P 500 shown in orange in the above chart. Assuming we went long in January of 2019, a few BDCs (e.g. GAIN) have matched the total return of the S&P 500 but most did not. This isn’t too much of a surprise as the S&P 500 is trading near the very top of its historical trading range from a valuation perspective while most BDCs are closer to the middle.
What about earnings?
Cash earnings matter as they power dividends and other corporate activities. To ensure apples-to-apples and reliable data over long periods of time, we’ll use GAAP net income to measure earnings, even though this will understate cash earnings almost all the time.
ARCC grew net income from $41.9 million in 2005 to $90.7 million in 2007. 2008 resulted in a $139.5 million loss with 2009 setting record earnings with $202.7 million in net income to shareholders.
That more than doubled in the following year to $492.0 million. In fact, 2008 is the only year since ARCC’s inception in 2004 that generated negative GAAP net income. 2020’s figure of $484.0 million was a sharp decline from 2019’s $793 million, but what do you think happened in 2021?
Just like the Great Recession, the year immediately after the correction resulted in record net income of $1.567.0 billion. Coincidence? No. We wrote about this phenomenon ad nauseum in 2020. Due to how BDCs are structured and U.S. GAAP accounting rules, BDCs must incorporate estimated potential loan losses into their financials (e.g. CECL reserve) independent of how those loans end up performing.
Like clockwork, BDCs stated GAAP earnings take a major hit during uncertain periods and then reverse most of those losses as the storm clears. In a very real sense, they are just moving earnings from one reporting period to the next due to accounting rules (note: just because that’s always happened in the past is no guarantee it will in the future).
That said, ARCC and many of its peers did cut their dividends during the Great Recession to shore up capital and deal with liquidity issues. This surely added fuel to the fire during the downturn. How bad was it?
Sticking with ARCC, the base dividend of $0.42 quarterly was reduced to $0.35 during the crisis or a ~17% reduction. ARCC’s base dividend is roughly back where it was before the cut as it pays out excess earnings in supplemental dividends rather than increasing the base level.
ARCC Q4-21 Tearsheet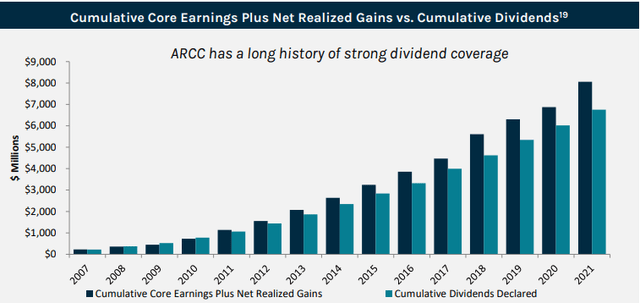
This system has allowed ARCC and other quality BDCs to maintain excellent distribution coverage over time. The widening gap between the dark blue (cumulative core earnings plus net realized gains) and green (cumulative dividends declared) bars indicate a safer dividend over time.
Q4 MAIN Investor Presentation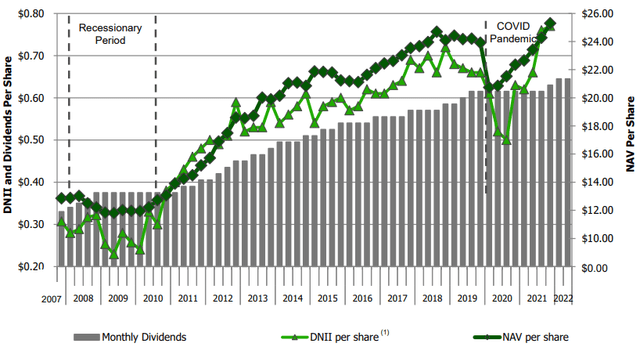
MAIN, on the other hand, has increased its distributions per share by approximately 75% since before the Great Recession and never reduced its monthly dividend payout.
2. Those Must Be Sucker Yields
A “sucker yield” can be one of the most dangerous temptations for retail investors. A base dividend nearing or even exceeding one’s annual total return target is almost irresistible. It seems so easy. There isn’t a single metric to accurately determine if a yield is unsustainable but there are a few measures that are extremely reliable when taken together.
First, and potentially most critical, is distribution coverage. As noted previously, most quality BDCs have distribution payout ratios of 80-95%. To our knowledge, there are zero BDCs with current payout ratios materially exceeding 100%. This is in part because most BDCs utilize a combination of base and supplemental dividends. The base dividend is reliably covered by collecting interest from the loan pool with supplemental dividends derived from less consistent capital gains and fee income. This gives investors reliable income while providing management flexibility to operate the business across different economic environments.
Second, when evaluated properly, dividend track records can be a great resource. Of the 11 BDCs we categorized as Tier 1 (the best) prior to the pandemic-panic of early 2020, 10 maintained or increased their base dividend in 2020 and two sort of did. If an investor participated in Golub Capital BDC’s (GBDC) rights offering to shore up its liquidity just after the S&P 500 hit lows, then 11 out of 11 Tier 1 BDCs maintained their distributions throughout all stages of the coronavirus period.
Impressively, even 90%+ of those categorized as Tier 2 (mid-quality) and Tier 3 (lowest quality) maintained their previous base distributions in 2020 and 2021. Payout ratios for BDCs average between 80% and 95% of total investment income. Most quality BDCs have maintained or increased their dividend every year since the Great Recession. A few BDCs, like MAIN, have never decreased their base dividend despite inception dates prior to the Great Recession.
As noted in the previous section, many BDCs did reduce their dividend during the Great Recession, but not necessarily to any greater extent than REITs, MLPs, or traditional C-Corp dividend stocks. That’s arguably impressive since BDCs tend to yield roughly double any of those other categories. To reiterate, individual BDC underwriting is extremely important.
Poorly managed BDCs with yields well above the peer average are likely a value/yield trap and should be avoided in our opinion. That’s a key reason why we classify BDCs as Tier 1 (the best), 2 (average quality), and 3 (lower quality) for subscribers.
3. High Loan Default Rates
ARCC Q2-21 Tearsheet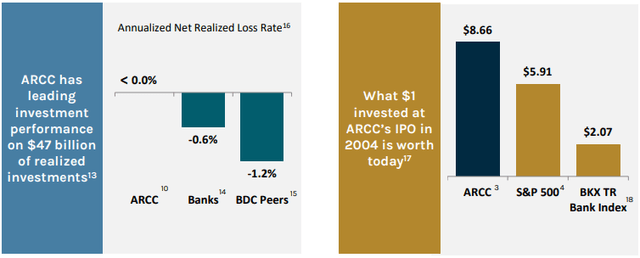
This is among the most common misconceptions I come across but it’s understandable. As we learn about bonds and credit instruments in general, we are taught that U.S. government bonds are the holy grail with quality declining alongside credit scores from the major rating agencies like S&P, Fitch, and Moody’s.
There is a vein of truth to this but it’s easily misconstrued or misapplied. As investors, the key to success is risk-adjusted returns. Although an obscure term, we encourage readers to consider it’s literal meaning: adjusted for risk. Everyone’s definition and sensitivity to different types of risk varies, and that’s yet another reason why it’s critical to understand what matters to you.
Government bonds, for example, are among the most sensitive to changes in interest rates. That means long-term U.S. bond investors are the most susceptible to unrealized principal losses in the event interest rates rise. On the other hand, the probability investors don’t receive an interest or principal payment is very low (it’s not zero despite what the borrower in that situation tells you).
In addition, moderately high inflation (we are experiencing at least that now) devastates long-term bond returns due to their low and fixed coupon rates. These seem like big risks to me despite U.S. bonds considered “risk free” by many. To the government’s credit, a loan portfolio of U.S. notes and bonds has historically had a zero default rate, meaning none of the loans went south. Corporate bonds’ default rates vary tremendously depending on their quality.
Here is great data from S&P Global:
S&P Global
Of the 198 companies that defaulted in 2020, only 4% were rated higher than B. As a reminder, that’s a full 5 notches below the investment grade threshold of BBB- and is considered “highly speculative.” Let’s clearly good performance, but let’s take a broader view.
S&P Global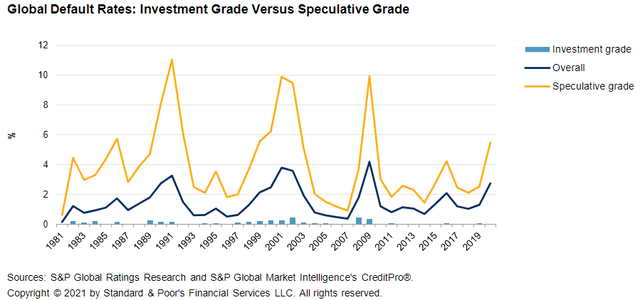
Overall default rates exceeded 4% annually during the worst of the Great Recession with junk/high yield bonds reaching 10% annual default rates in all four recessions of the past 30 years. The peak high yield default rate was 15.6% in 2020, or nearly 50% higher than any other period since 1990.
S&P Global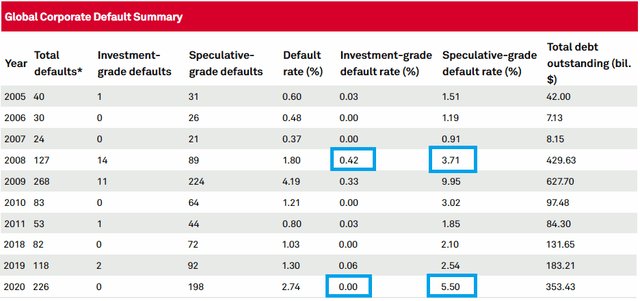
I trimmed S&P Global’s chart to encompass the last two major recessions since BDCs weren’t common before that. Investment grade bonds performed well with the annual default rating peaking at 0.42% in 2008. 1-3% of high yield bonds consistently default every year with 5%+ not uncommon during peak market uncertainty. Given BDC loans are almost exclusively to private companies with no need for a credit rating, how have they stacked up? There are a couple ways to measure this.
Per Fitch, the leveraged loan default rate, a rough proxy for the types of loans BDCs originate and invest in, stood at 0.6% at the end of 2021. That’s among the lowest default rates in the past decade. 2020 was unsurprisingly much more challenging at 4.5%.
If we focus in the lower middle-market where many publicly traded BDCs focus, that default rate was 1.3% in 2021, or 700 basis points greater than the institutional leveraged loan index. Cumulative losses for the 2020-2022 period will be around 7% compared to 15% from 2008-2010. Fitch Ratings’ Market Concern Loans has declined for 17 straight months since the April 2020 peak with most metrics indicating a very healthy operating environment for BDCs.
In summary, the loan type that BDCs most commonly engage in have default rates that are approximately 66% lower than high yield bonds in the last couple major recessions. They aren’t as solid as investment grade bonds, but leveraged loans tend to offer at least three times the yield to compensate for the higher risk.
High yield bonds, on the other hand, have two to three times the default rate as first lien loans and the broader leveraged loan market while offering 40-60% less yield. That’s not to mention the fact leveraged loans are primarily floating rate while corporate bonds are fixed rate and are much more sensitive to interest rate and duration risk. Recovery rates on leveraged loans are also on par with or better than high yield bonds but less favorable than investment grade bonds.
That completes our high-level analysis, but how have individual BDCs performed?
ARCC Q4-21 Tearsheet
Starting with ARCC since it has among the longest publicly traded track records at 15+ years, Ares has achieved ~0% annualized net realized loan losses since inception. You read that correctly. That compared to 0.6% for banks and 1.2% net realized loan losses for BDCs on average (Author’s note: you can find our latest research on ARCC here).
This is one reason we initiated bullish research on Ares Management Corporation (ARES) in this article published on March 1st. Net realized loss rates are where the rubber meets the road and can be understood as (1-(Defaulted Loan Amount X Recovery Rate)) / (Total Loan Amount). Stated another way, it doesn’t really matter how many mortgage borrowers default, the key is the recovery rate on those mortgage loans.
If underwriting is strong and there is plenty of equity, the bank will never experience meaningful net realized losses regardless of the default rate. All things equal of course, we’d prefer to have lower default rates as that makes our interest income more reliable and requires less frequent loan origination.
Most quality BDCs have annualized net realized loss rates below 0.5% and perform better than banks despite obtaining much higher yields on their investments. MAIN, for example, has cumulative net realized gains from its lower middle market portfolio of $157.7 million since the firm’s initial public offering.
Not every BDC is created equal and it’s mandatory to underwrite each company individually. Information on loan losses is provided in 10-Q and 10-K SEC filings within discussions on non-accruals and risk ratings/grades. We cover those topics in-depth in all our deep dive BDC analyses.
Part I Conclusion
We discussed the fact and fiction encompassed in three of the most common BDC misconceptions. Investing isn’t about avoiding risk entirely or blindly shooting for the moon. It’s about balance risk against reward in a way that puts the long-term odds in your favor. This series is designed to provide the knowledge and understanding necessary for readers to become educated BDC investors.
In our next series, we’ll break down three more controversial but common BDC talking points.
Stay tuned and let us know if you find this educational content helpful!
Be the first to comment