

da-kuk
Written by Nick Ackerman, co-produced by Stanford Chemist. This article was originally published to members of the CEF/ETF Income Laboratory on September 1st, 2022.
The New America High Income Fund (NYSE:HYB) is a rather straightforward high-yield closed-end fund. They don’t list any interest rate swaps or other fancy derivatives. When you invest in HYB, you get what you expect. That is a portfolio of mostly below-investment-grade bonds that utilizes leverage.
Their latest report has shown encouraging signs. Net investment income coverage was over 100%. After factoring in the special they paid last year, their coverage was also strong in the previous year. So that’s a continuation of strength. However, it was a decline in NII year-over-year.
Higher interest rates and the weaker economic outlook for the overall economy are also contributing to a depressed price. A widening discount has also contributed to the weakness in share price relative to the NAV. Though that also presents a rather interesting opportunity for CEF investors.
The Basics
- 1-Year Z-score: -1.11
- Discount: -12.46% (based on 9/9 NAV)
- Distribution Yield: 8.53%
- Expense Ratio: 1.27%
- Leverage: 30.71%
- Managed Assets: $273.6 million
- Structure: Perpetual
HYB’s investment objective is “to provide high current income while seeking to preserve stockholders’ capital.” They do this through investing in “a portfolio of “high yield” fixed-income securities, commonly known as “junk bonds.” The Fund invests primarily in “high yield” fixed-income securities rated in the lower categories by established rating agencies, consisting principally of fixed income securities rated “BB” or lower by Standard & Poor’s Corporation (“S&P”) or “Ba” or lower by Moody’s Investors Service, Inc. (“Moody’s”), and subject to applicable bank credit facility requirements, non-rated securities deemed by the Investment Adviser to be of comparable quality.”
It is a rather small fund overall, and liquidity for some larger investors could be a concern. The fund’s expense ratio came to 1.27% with the latest report. The expense ratio came to 1.82% when including the leverage expenses, which isn’t too unusual for high-yield bond funds.
The leverage expenses for this fund have jumped up considerably. This is to be expected as interest rates increase. HYB doesn’t have any meaningful hedge in place to offset any of this impact. As a fund that is primarily focused on high-yield fixed-rate bonds, the fund’s leverage expenses could continue to eat into the spread of what they can earn on their holdings versus the yield. Eventually, with yields rising, that could translate into higher yields for HYB. However, that will take some years, and the higher expenses are felt first.
As of June 30th, the Fund’s outstanding borrowing through its credit facility (the “Facility”) with the Bank of Nova Scotia was $84 million, unchanged from borrowings at year-end. The borrowing represented approximately 32% of the Fund’s total assets. Amounts borrowed under the Facility bear interest at an adjustable rate based on a margin above the London Inter-bank Offered Rate. The interest rate on the Facility as of June 30th was 2.47%, more than double the .95% rate the Fund was paying on the Facility at year end 2021. The difference between the market-value weighted average current yield on the portfolio and the rate paid on the Facility has narrowed to 4.68 percentage points at June 30th, compared to a yield spread of 5.06 percentage points as of December 31, 2021.
Performance – Interest Rates And Slowing Economy
The two culprits on the fund’s performance will continue to be interest rates and a softer economic outlook. However, the market is now looking for interest rates to lead to a recession in 2023. This will be a deeper recession if the Fed tightens too aggressively in its fight against inflation. That is ultimately the primary cause of YTD’s poor performance. It isn’t just HYB; every asset class has felt the pressure.
Here is a YTD comparison between the BlackRock Corporate High Yield Fund (HYT) and its close ETF cousin, the iShares iBoxx High Yield Corporate ETF (HYG). HYT has in place some mild hedging through derivatives that HYB doesn’t have. It hasn’t had a meaningful impact on a total NAV return basis.
As a reminder, the NAV chart may appear a bit unusual, but that’s because HYB reports the NAV weekly. Both the leveraged HYB and HYT have underperformed to the downside compared to HYG, which offers no leverage.
Ycharts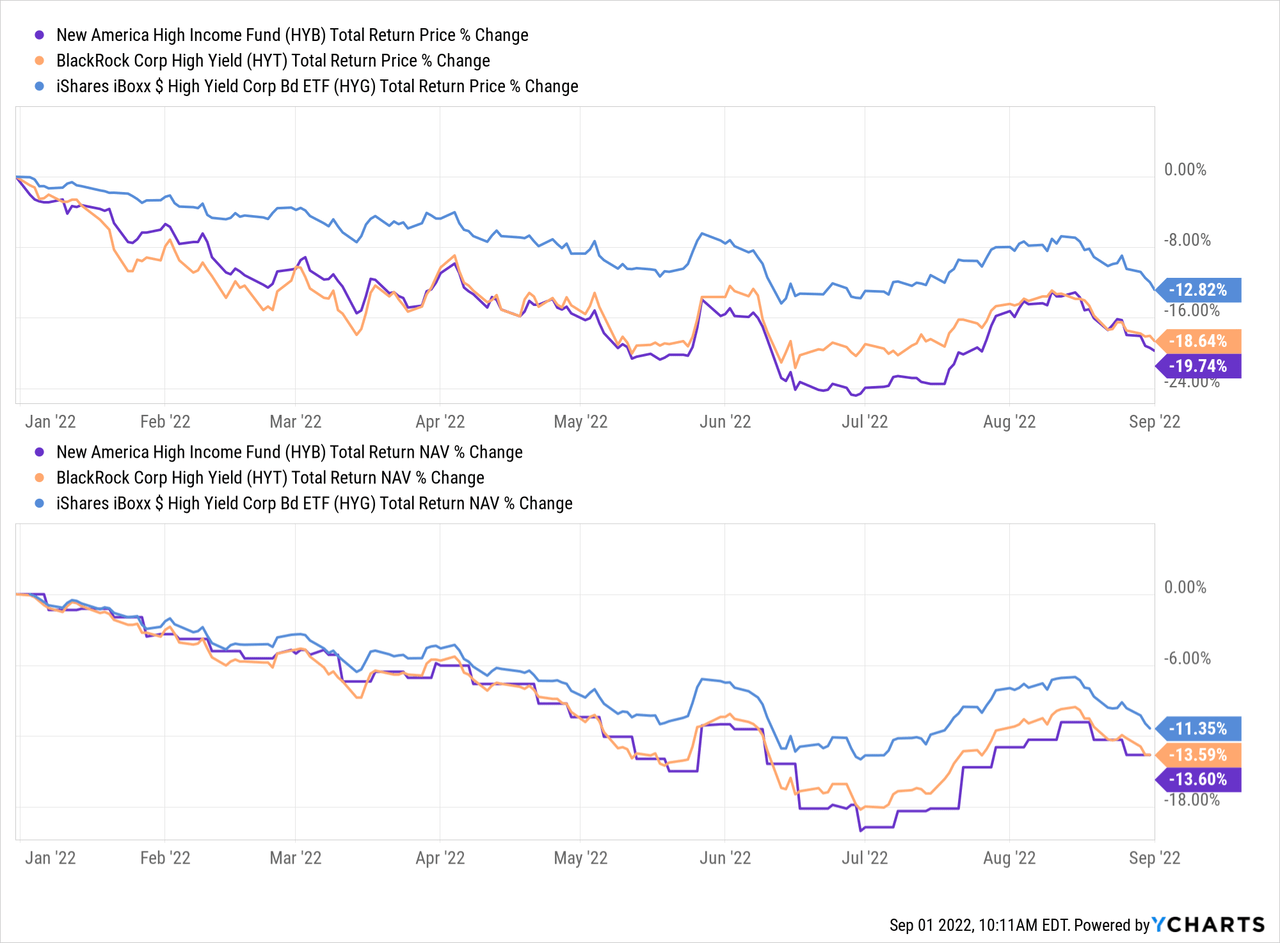
Despite the close performance, HYB gets punished with a deeper discount. Though they don’t report a daily NAV, over the longer term, the average is still more than relevant to look at.
The fund’s discount at this time is below the longer-running average. That doesn’t mean that it can’t ever go deeper. The chances of it going deeper and staying there for a significant period of time have historically not happened.
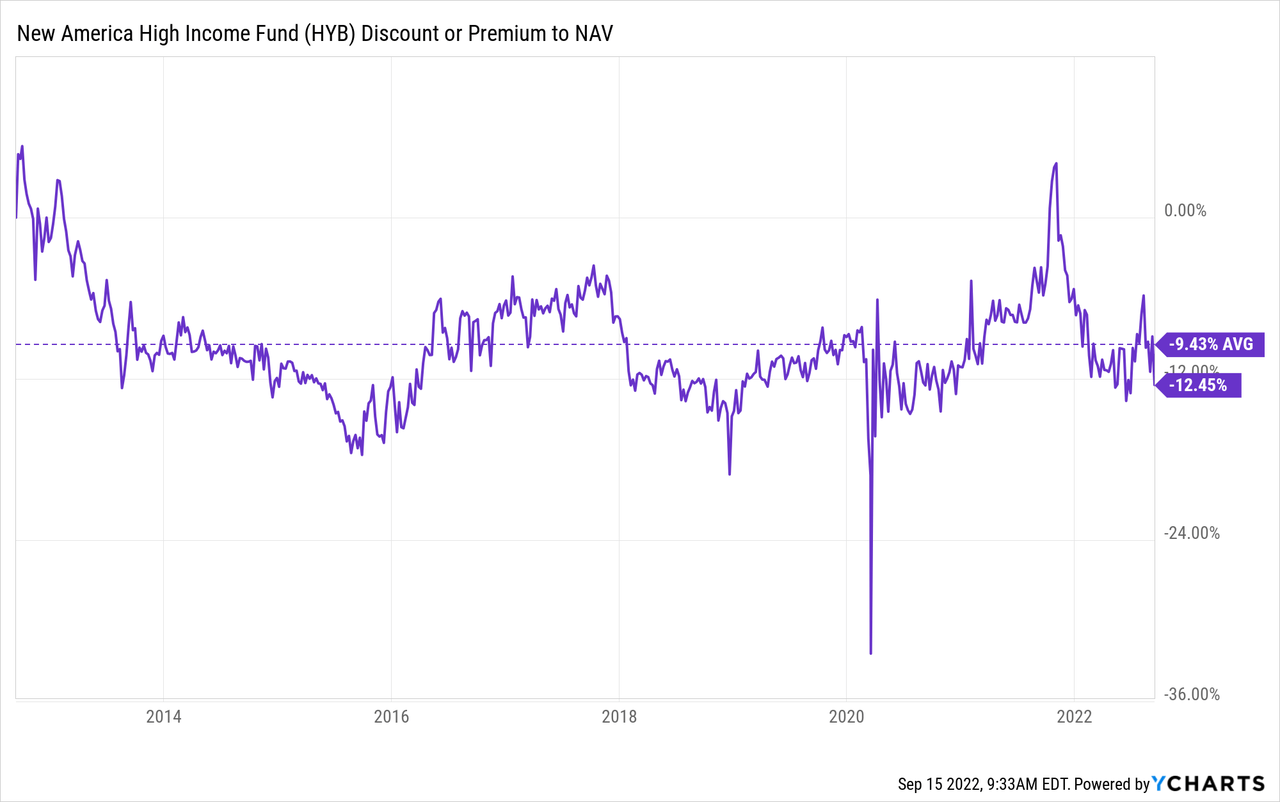
Combining that with the valuation of the underlying portfolio value also declining, we are looking at a more interesting time to pick up shares. Barring a black swan event that causes massive defaults, the portfolio should generally expect to receive face value back on most of its underlying holdings if they hold them to maturity.
Distribution – Fully Covered
This is quite the old fund, and we have seen many adjustments in the payout over time. That’s usually pretty standard for a fixed-income-oriented fund. Going through different interest rate periods will have a sizeable impact on the payouts the fund can sustain.
HYB Distribution History (CEFConnect)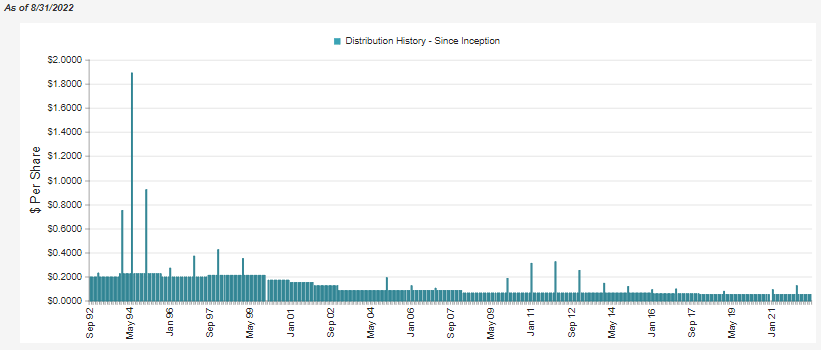
The latest payout works out to an 8.53% distribution yield. Even better, the rate has shown some strong coverage, with the latest report having over 100% NII coverage. In fact, it came in at a very strong 120% coverage. This fund has paid out a special year-end distribution to shareholders on several occasions.
They had 23,374,744 shares outstanding at the end of the prior year. That worked out to an additional $1.812 million being paid out for the 2021 special distribution. That would mean the regular distributions paid were closer to $14.022 million being paid out. That left the $14.963 million generated in NII to cover the distribution too.
As a regulated investment company, they are required to payout the majority of the earnings generated from income and realized gains. That’s why we’ve seen so many specials, as the fund seems to focus on stronger coverage. Thus, when there are capital gains or a higher amount of NII generated, they are required to make these year-end payments.
HYB Semi-Annual Report (New America Fund)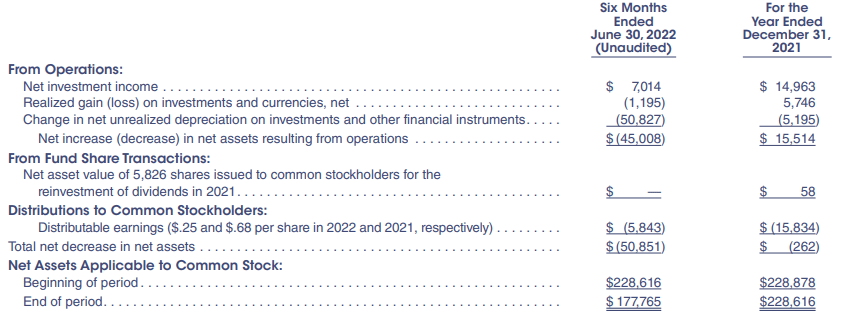
Year-over-year, the NII had declined from the previous $7.654 million the underlying portfolio generated. Also, if we factored in the realized losses of the fund, coverage would have been slightly negative. In my opinion, the NII coverage is more important for a fixed-income fund. This coverage will continue to be an important metric to watch. The portfolio managers have a rather optimistic outlook, which is encouraging.
Fundamental conditions in the high yield asset class and its underlying credit quality remain solid. We do not expect a meaningful increase in default activity during the rest of the year despite the challenging performance environment. The upgrade cycle that has led to many of our companies being elevated to investment-grade status also remains largely intact. The number of issuers to receive credit rating upgrades has exceeded downgrades for several consecutive quarters, and we believe this trend will continue.
The distributions in each of the prior two years both were ordinary income. That isn’t too surprising, given the interest income the fund receives from the underlying bonds.
The tax character of distributions paid to common shareholders in 2021 and 2020 of approximately $15,834,000 and $15,248,000, respectively, was from ordinary income.
That would generally mean that a tax-sheltered account would be more appropriate.
HYB’s Portfolio
The majority of the portfolio is weighted heaviest in single and double B credit quality. However, there is some meaningful exposure to the CCC and below category at around 11%. That is an area that is particularly noteworthy in that they will be the first to start defaulting during any sort of slowdown. They are the types of companies that, even during normal economic conditions, can have difficulties if the wind blows too hard one day.
Therefore, the current environment could warrant caution in evaluating our high-yield investments, ensuring that our exposure to the lowest junk-rated companies isn’t too substantial. Of course, those with a higher risk tolerance or more optimistic outlook could come to a different conclusion. The weightings, in my opinion, are fairly favorable when compared to a peer such as HYT. HYT has over 15% in CCC and below.
HYB Credit Quality (New America Fund)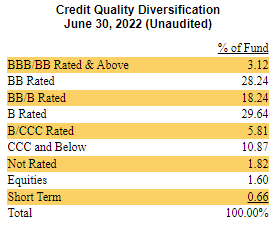
U.S. exposure makes up the vast majority of the portfolio at 86.18% weighting. The remainder is spread around the world, with no other single country commanding any sort of significant exposure. The industry exposure has the top industries making up around 70% of the exposure. Perhaps more importantly, though, things are spread out fairly meaningfully across the different industries with a wide variety of exposure.
Energy is the largest exposure here, but balance sheets in that space have improved quite remarkably over the last several years now. The price of oil and natural gas at this time will only serve to strengthen them further.
HYB Industry Exposure (New America Fund)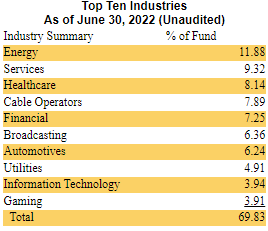
Looking at their top ten holdings, we see a similar pattern of diversification. No position takes up a significantly large portion of the portfolio. Only the top three have over 1% allocations, with the remainder sub-1% level. They drop to only a 0.79% weighting by the tenth position.
HYB Top Ten (New America Fund)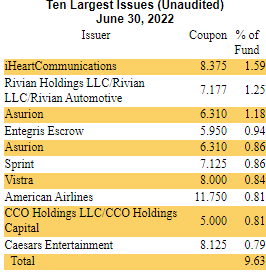
According to CEFConnect, they list 452 total holdings as of June 30th, 2022. That’s a fairly common approach of junk-rated funds. They spread out their portfolio among hundreds of positions. That way, when there are a handful of collapses and defaults, it doesn’t drag the whole fund lower.
Conclusion
HYB is a fairly straightforward high-yield bond fund portfolio. They offer a leveraged portfolio, which can be appropriate for some investors who don’t mind the higher risks associated with leverage. It can help provide outsized returns during good times but also hurt the fund on the way down. In this case, the leverage still leads to a net positive income result for the fund. That will continue to be impacted as rates head higher, though, so it will be something to monitor. For now, the distribution coverage remains strong. A cut seems unlikely, making the 8.53% distribution yield quite attractive. That’s on top of the fact that the fund is also trading at a compelling discount.
Be the first to comment