

Romanista
Top Level
Home Depot (NYSE:HD) has been on a growth tear for the past decade, but when looking at the future earnings and revenue estimates it may be slowing in both revenue and earnings. In this article I will provide a clear picture of past and future earnings and revenue and show the results of a newly developed model to predict risk and return so that you have actionable information.
Home Depot Revenue Growth: Then and Now
The next two charts show the last 8 years of earnings and revenue as well as forecasts for the next 2 years from 11 sell-side analysts reporting from major brokerage houses.
Revenue looks like it is flattening across the next two years in comparison to the previous period. The revenue forecasts show that revenues are projected to grow on a 3.1% trend over the next two years. This is down -17.1% from The Home Depot’ historical growth trend of 20.3%. Upon closer inspection though you can see that the COVID boom in home improvement projects likely pulled demand forward causing Home Depot to realize revenues in 2021 and 2022 that would have normally been delayed until 2023 and 2024. When you view the revenue range of $144.79 to $150.96 in 2024 it looks like a reversion to the previous growth trend.
HD Revenue Expectations (Authors Image from Financial Modeling Prep Data)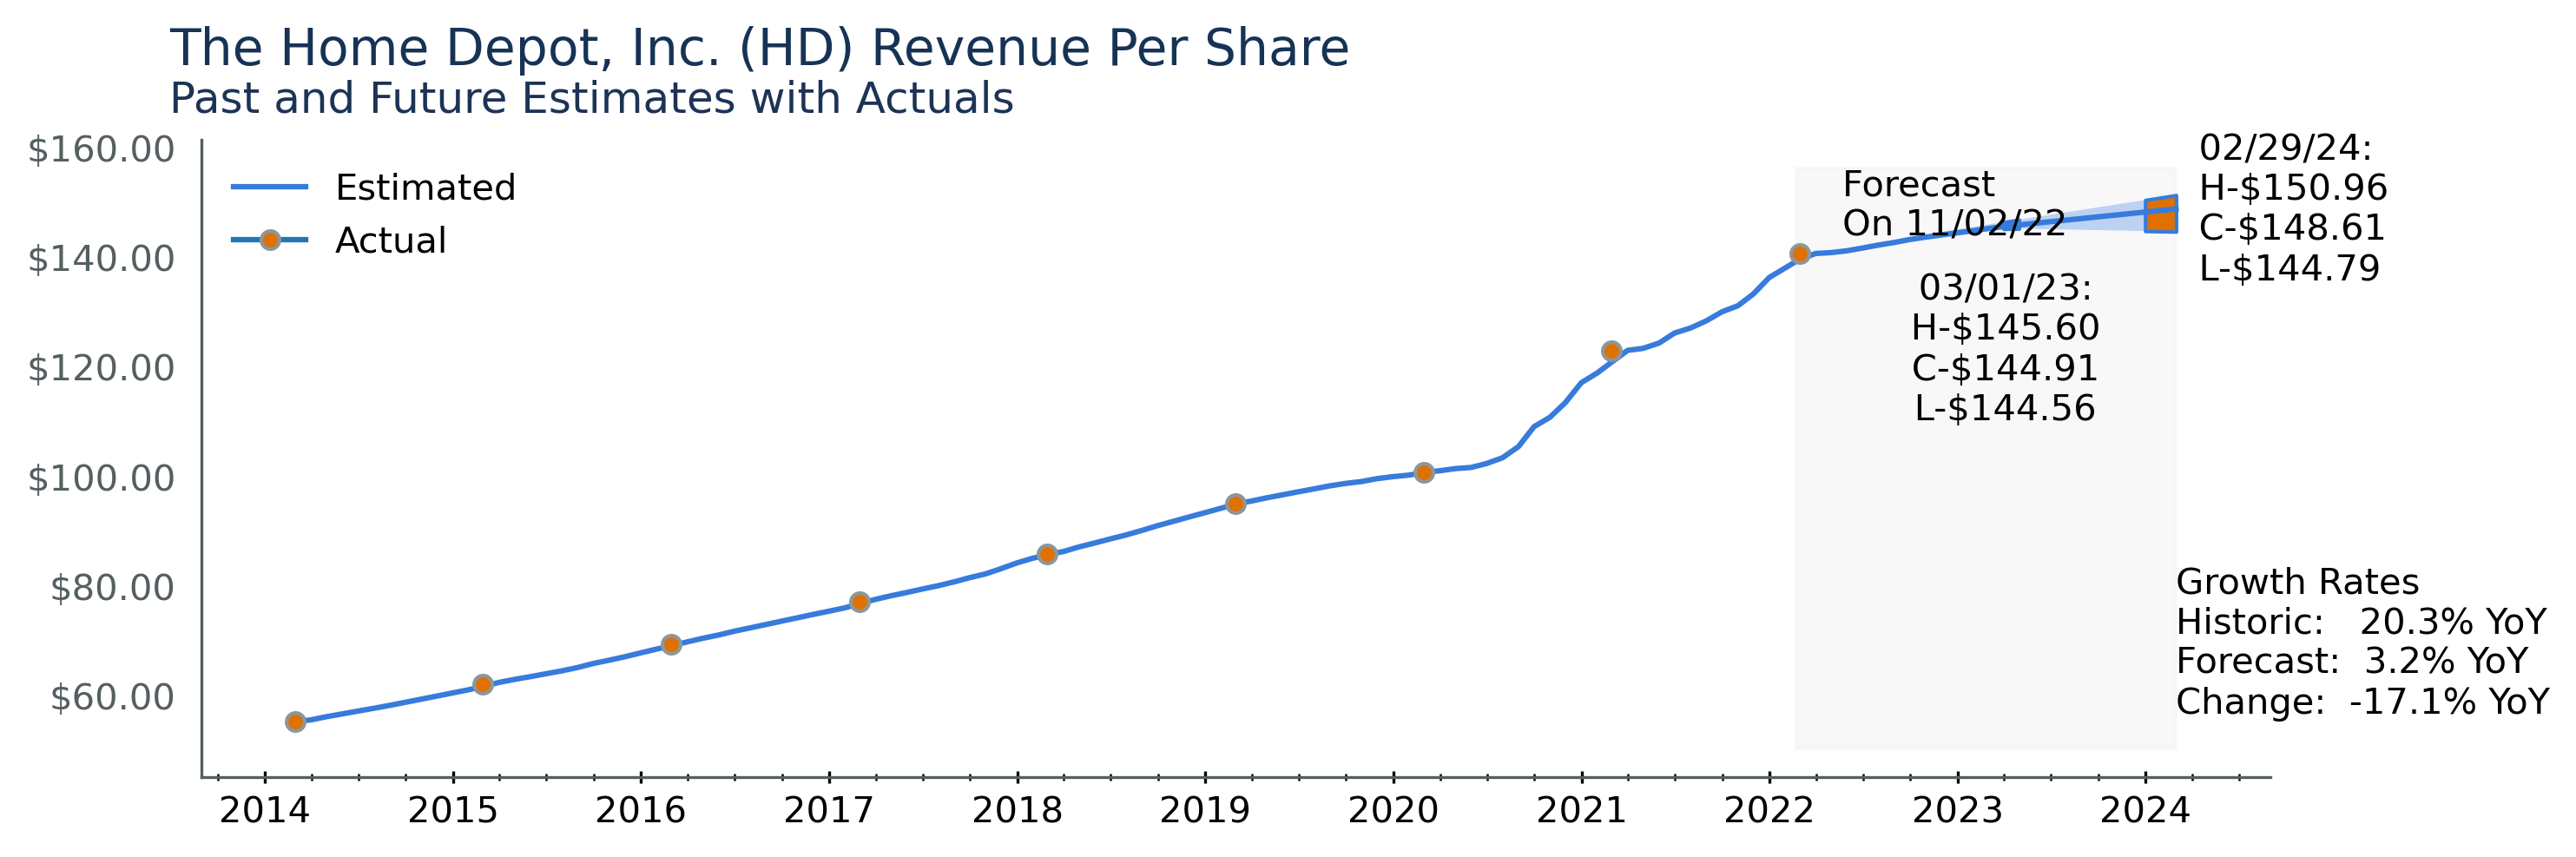
Home Depot Earnings Expectations
Earnings show much the same thing. Although the estimates show more uncertainty the long-term trend is still intact. After an initial disruption from COVID earnings are reverting to previous trends.
It should be noted that the earnings shown here are Pro forma, or ‘street’ earnings. GAAP earnings have been found to be less reliable when predicting intrinsic value due to accounting rule changes and sometimes the absurdity of the rules themselves.
HD Earnings Expectations (Authors Image from Financial Modeling Prep Data)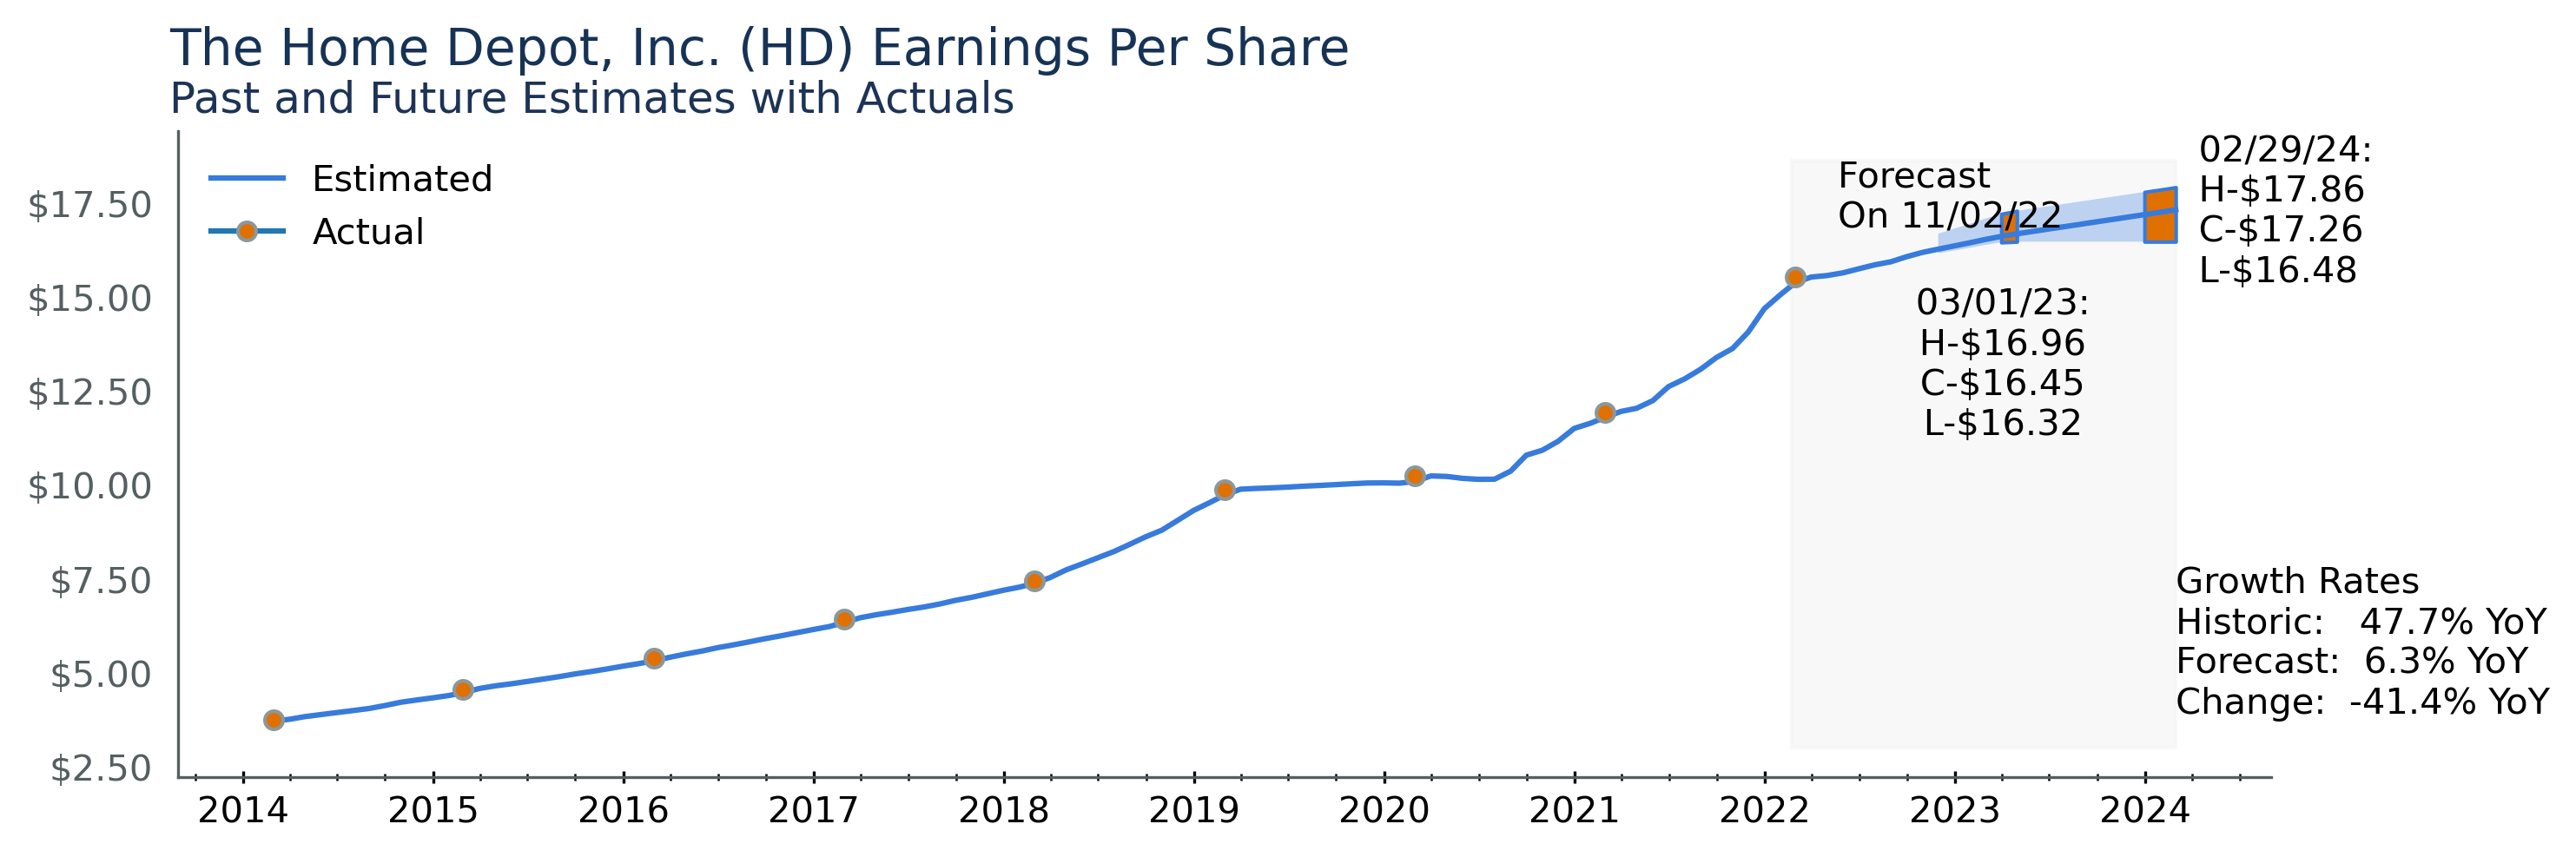
Long Term Economic Prospects
In his 2007 Letter to Shareholders Warren Buffett provided us with clear insight on what it takes to be a great business. He put it simply: “it is far better to have an ever-increasing stream of earnings with virtually no major capital requirements.” He has spoken of this concept time and time again and further defines it as returns on unleveraged net tangible assets. If a company needs less money to grow, it can grow faster. We unleverage the assets to compare companies on a risk adjusted basis, this way a company with a bigger debt and risk appetite does not appear superior to a company with less debt.
The next chart shows just that. At a Return on Unleveraged Net Tangible Assets of 12.9% Home Depot is in the top third of companies with an upward trend since 2009. The blue shaded area here shows the distribution of all other companies in the S&P 500 with the dark region in the center representing the middle third of all companies centered around 9.5%.
Home Depot Return on Net Tangible Assets (Authors Image from Financial Modeling Prep Data)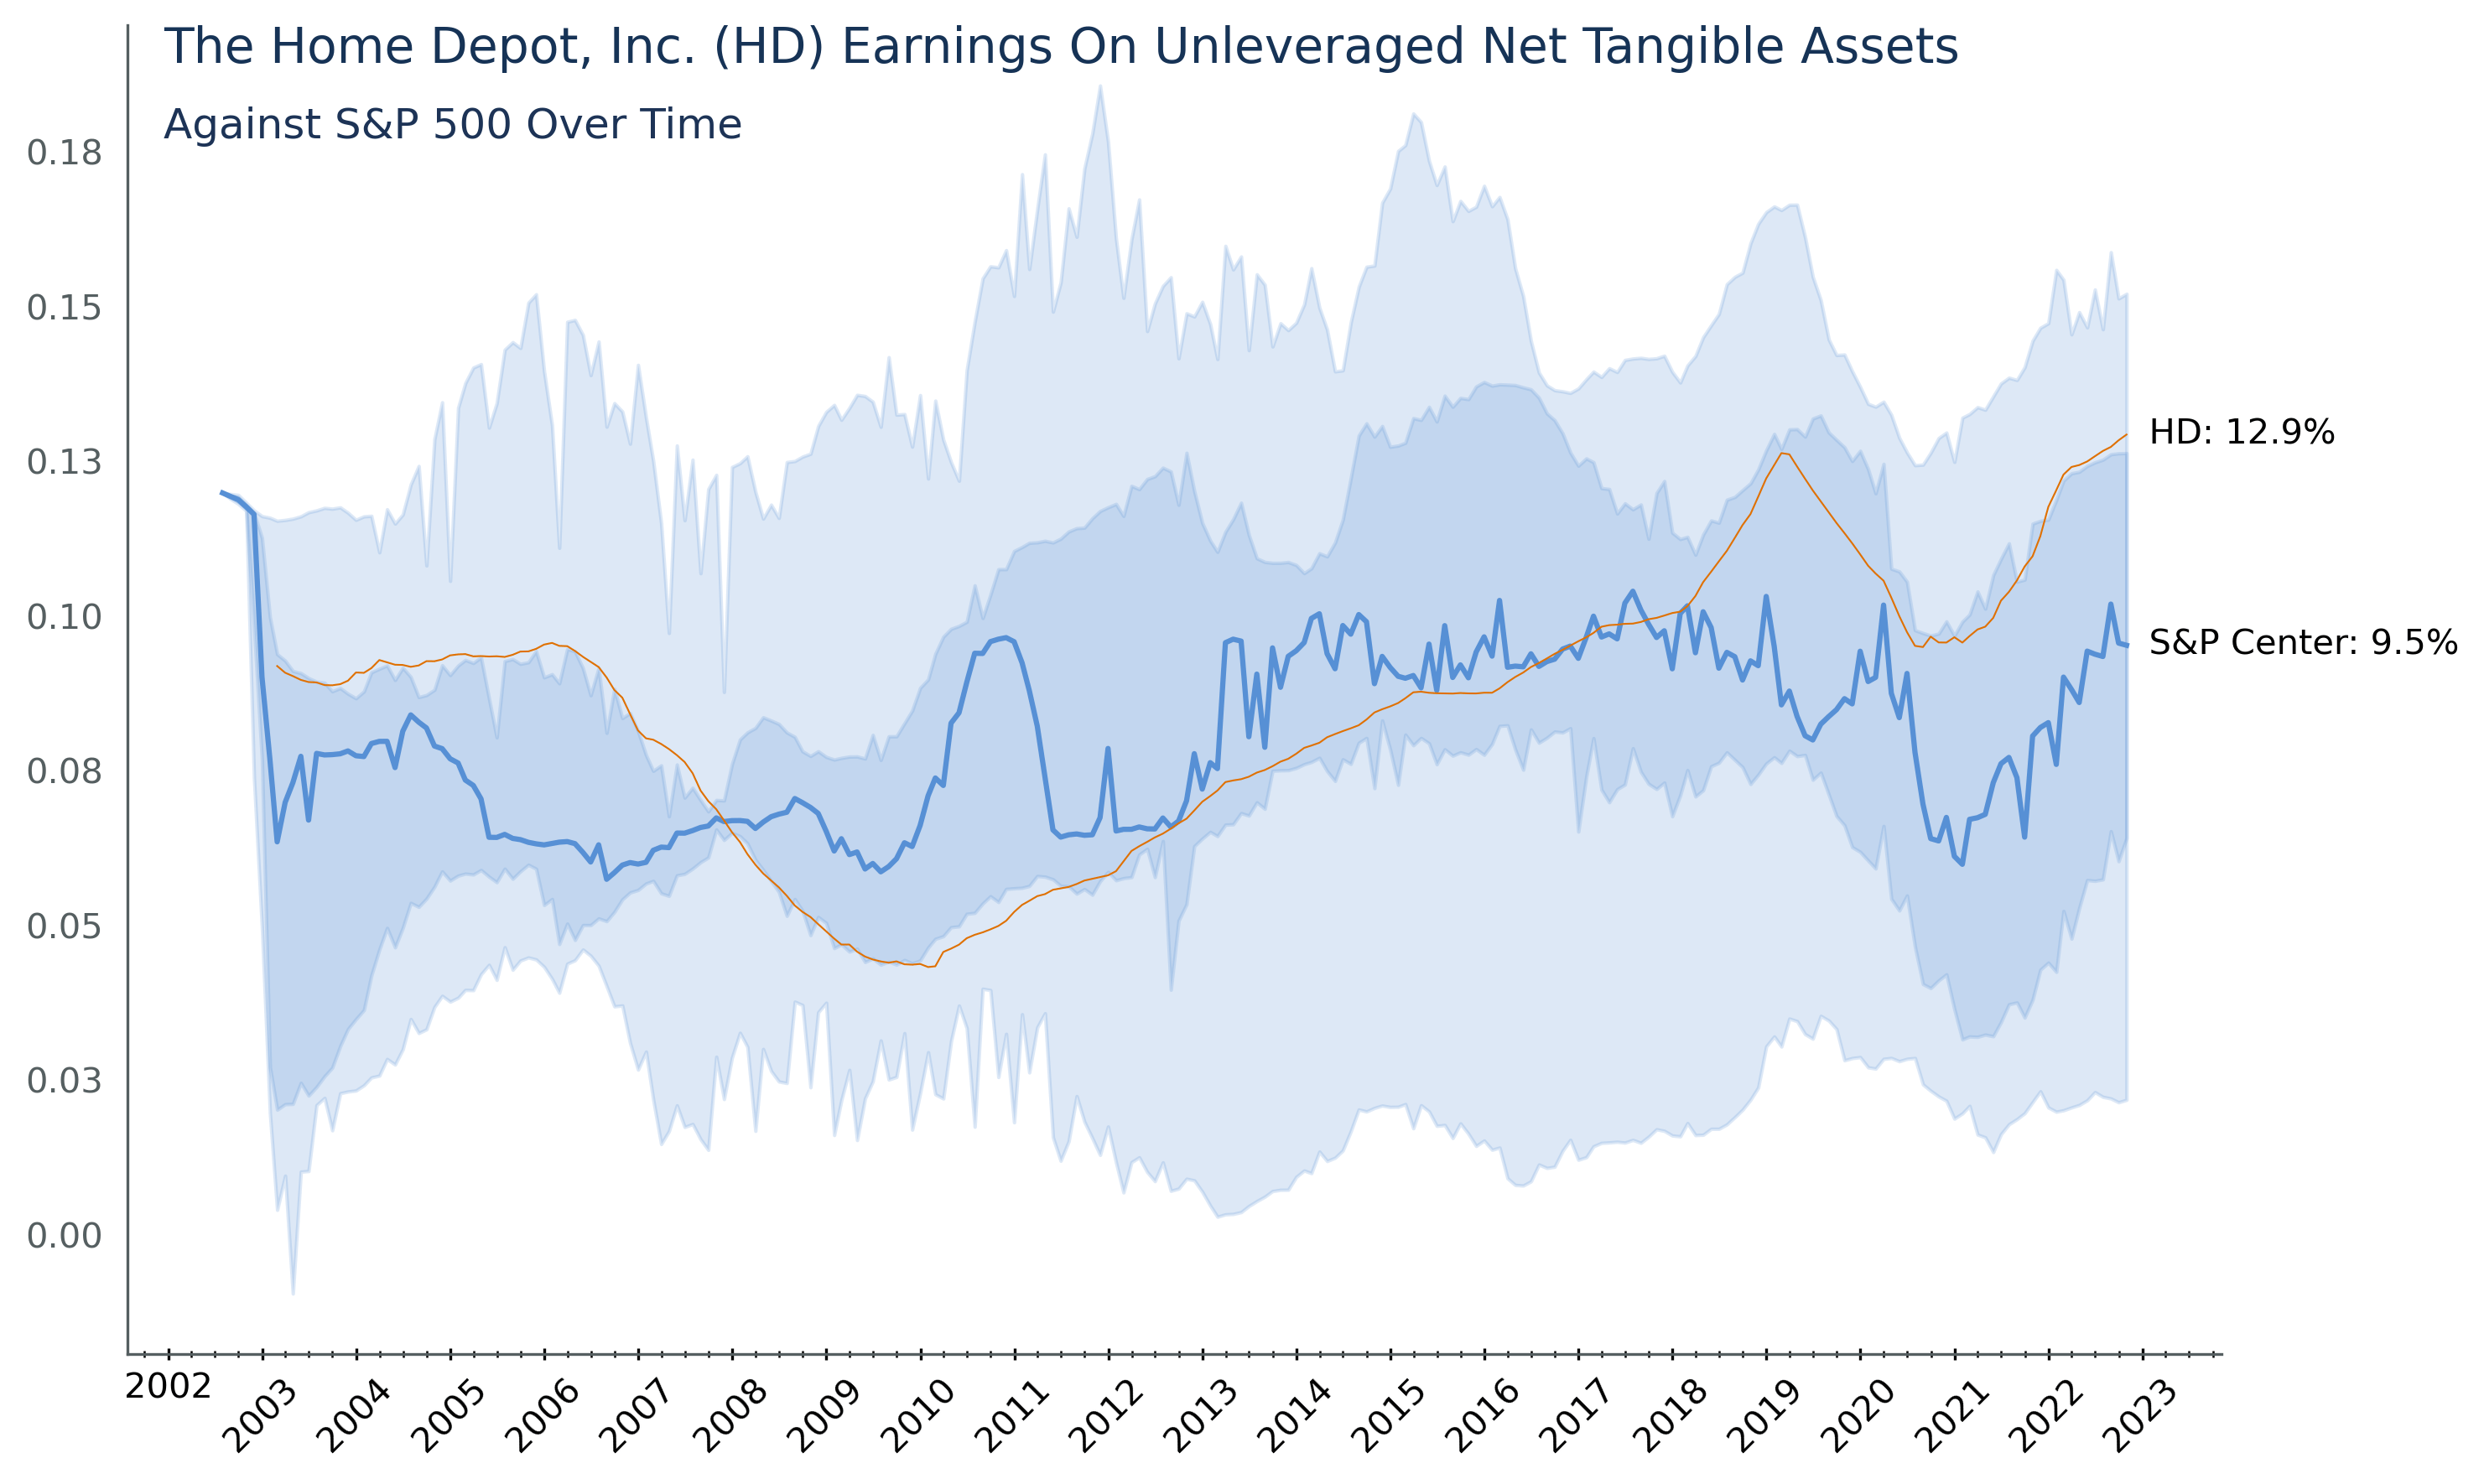
There is more information to glean from the above chart. The Financial Crisis and COVID can both be clearly seen from dips in earnings across the S&P 500. No similar dip is visible right now. We could be seeing a peak right now, but there definitely isn’t a downward trend. I don’t know how predictive this is, or if we can exploit it, but it is something to watch.
Resulting Risk Forecast
The below chart is a prediction of value at risk and potential return of holding Home Depot stock. As shown by the blue intrinsic value region Home Depot has not traded at such a discount since early spring of 2020. Earnings and revenue growth was also flattening at this time too, but growth rates were much lower than they are now.
Home Depot Risk Return Forecast (Authors Image from Financial Modeling Prep Data)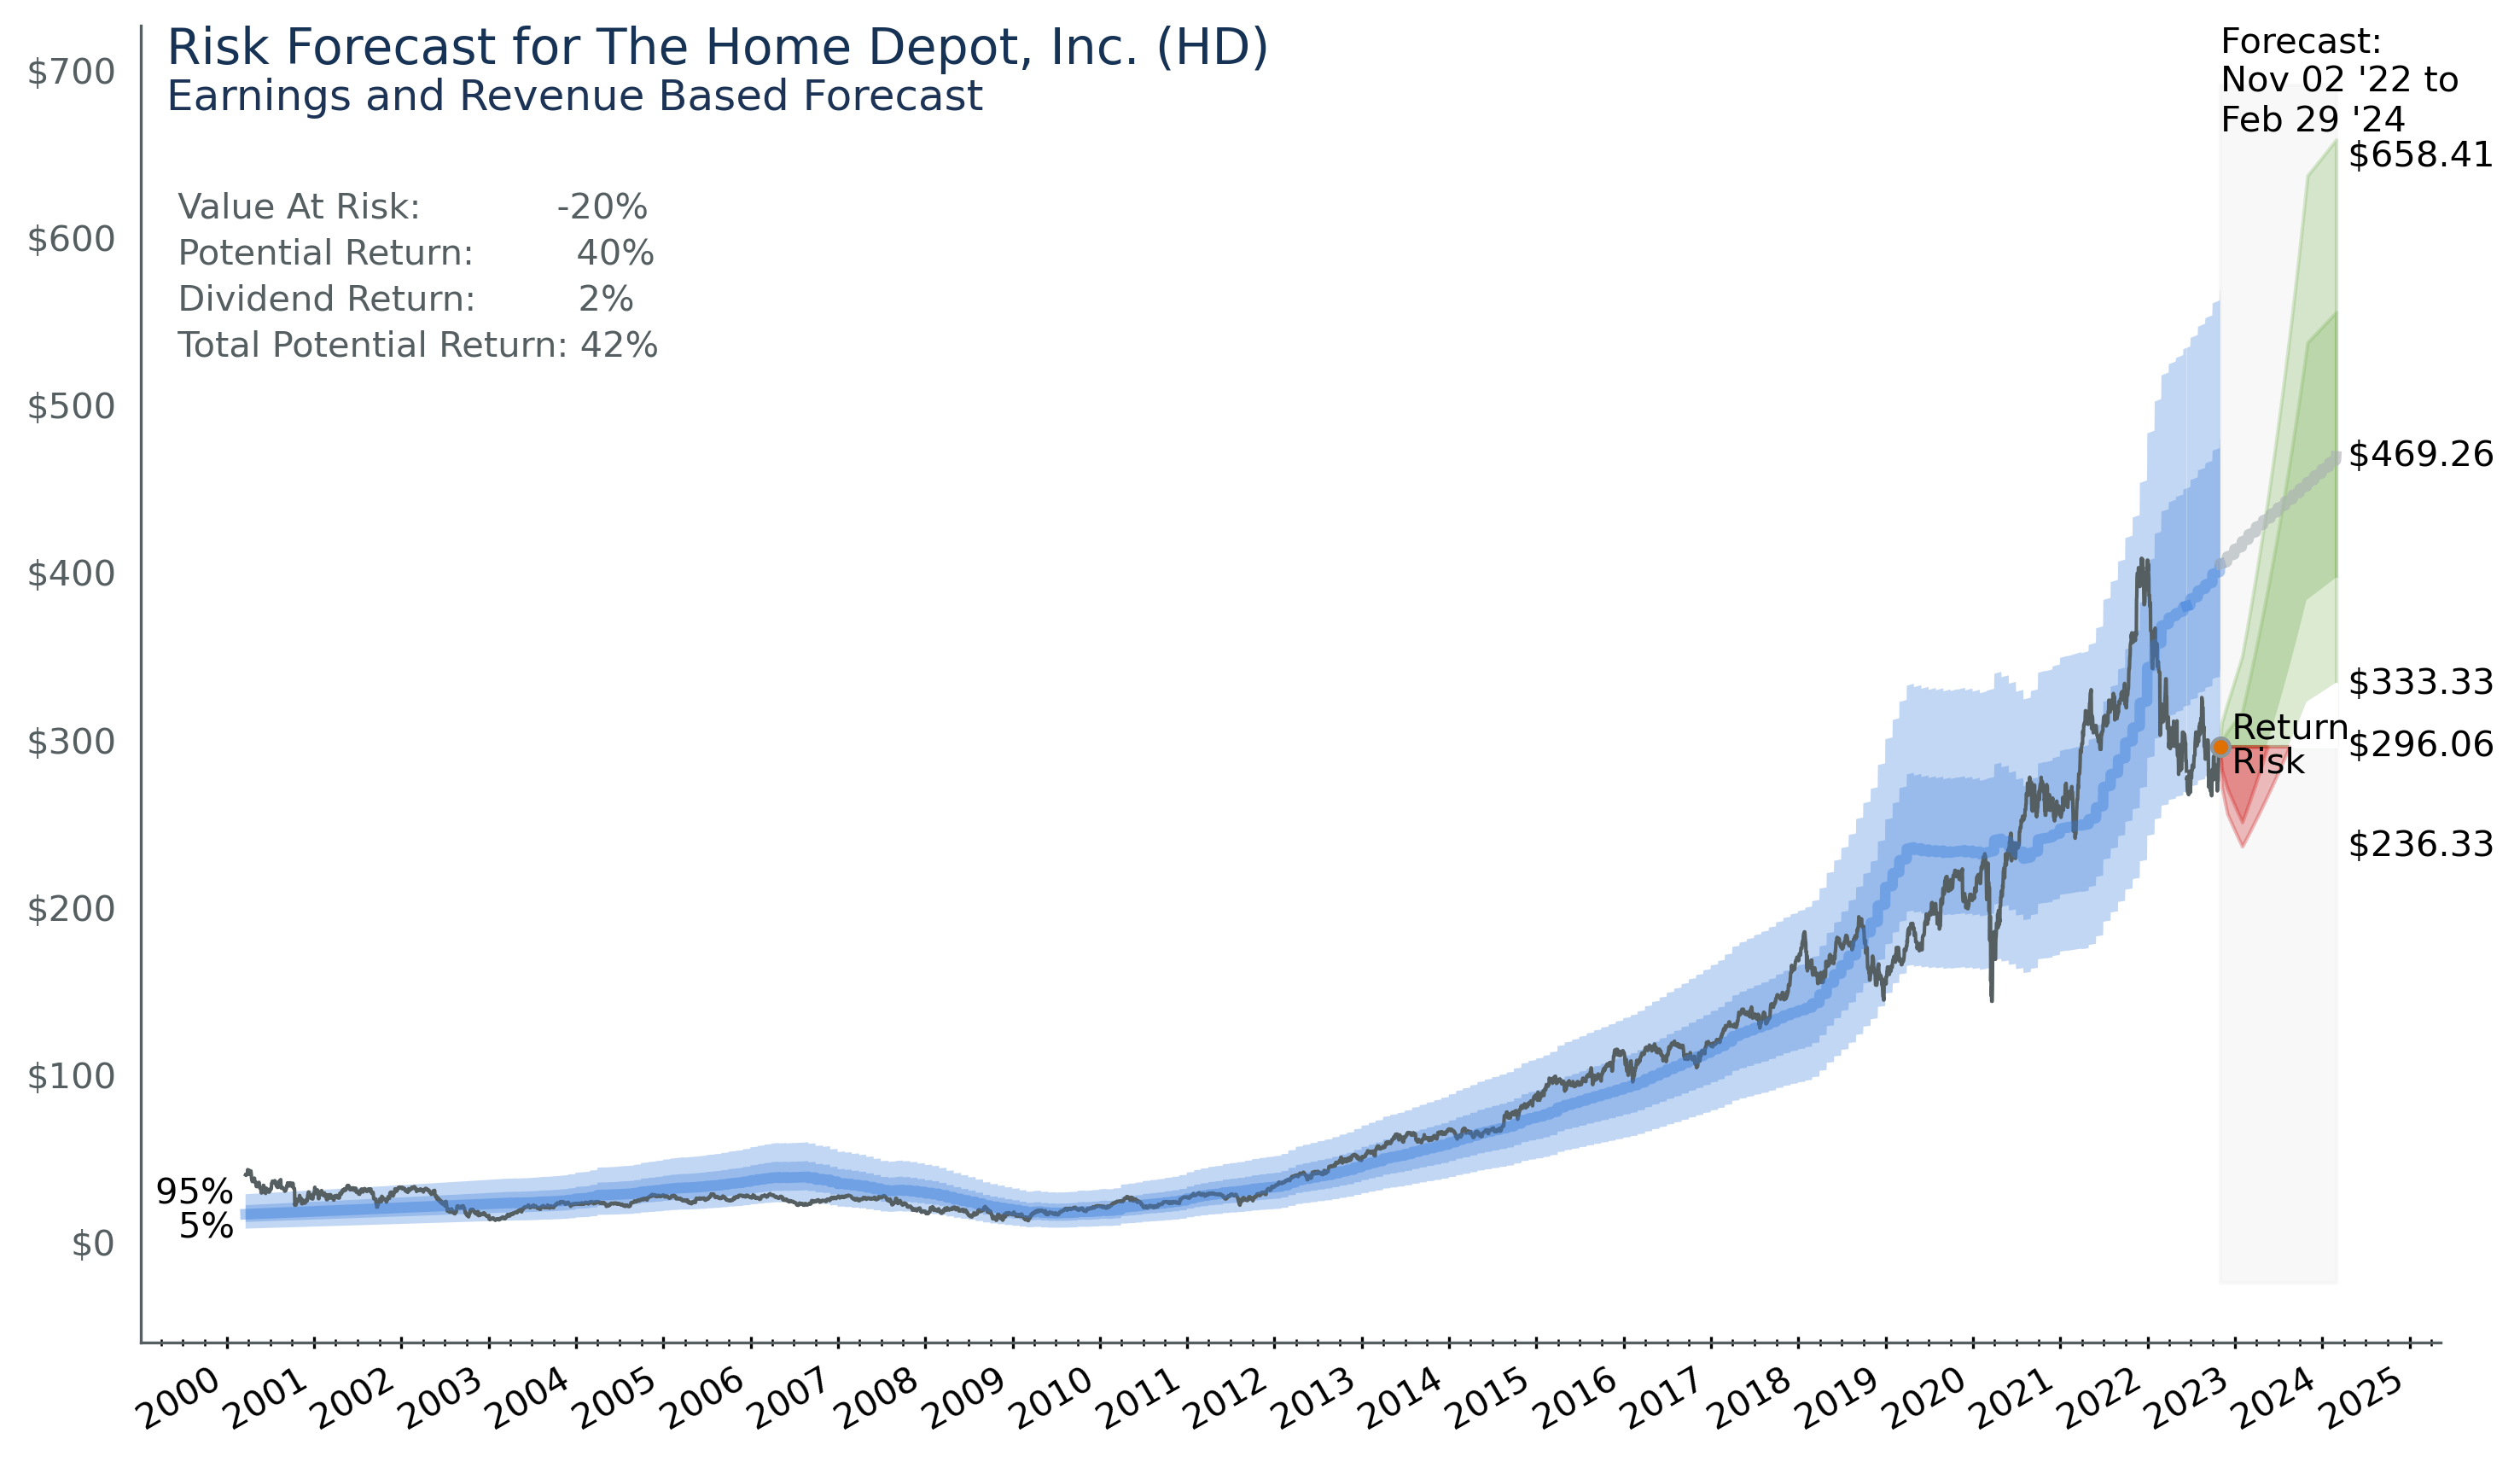
Home Depot now has a value at risk of only 23%. The low-price prediction of $236.33 is based on historic short-term volatility and although you could still take a hit of 23% it would only happen from extreme pessimism. Pessimism from something like Russia going nuclear, the Fed raising rates well above current expectations, or some major catastrophe inside the company. With a central forecast of $469.26 potential yearly returns are as high as 40%.
An Explanation of the Above Chart
You have all seen lots of price predictions based on CAGR, DCF, NPV, and other valuation schemes. These all provide insight, but we know the outputs are heavily dependent on assumptions like discount factors and showing contradictory results. This probably just looks like another one of these estimates that are highly dependent on assumptions. It would look like this to me. The reason why this forecast is different is that it works without me putting in any magic numbers. The algorithm avoids assumptions and tries everything until it finds an optimum setting. This enables the forecast to learn not only the central tendency, but also how well that forecast has performed in the past and create a range of potential values in the blue bands.
The blue bands represent the predicted intrinsic value of the company with the actual price data shown against the prediction.
A word of caution: The chart only shows the range the stock trades in 90% of the time. The more extreme cases can go well above or well below the bands shown on the chart. It also only represents known risks. New information, like a big miss on earnings, will require an updated price risk assessment.
Conclusion
Home Depot is that same business, in the same industry, with the same customers it has always had. Although not immune to economic downturns, at this time of economic uncertainty, and given the recent sell off, Home Depot offers an enticing value for your investment dollar.
Be the first to comment