

peterschreiber.media/iStock via Getty Images
This article was coproduced with Dividend Sensei.
The dividend aristocrats are companies that have raised their dividends for 25+ consecutive years.
They are legendary for delivering not just incredible dependable dividend increases every year but also market-beating returns over decades and 15% lower volatility than the S&P 500.
But all this quality doesn’t come cheap.
Today, the aristocrats trade at 21x earnings, and a 9% historical premium.
But, of course, it’s always and forever a market of stocks, not a stock market. If you know where to look you can find high-yield aristocrats trading at a bargain that you can safely buy today.
Today I wanted to highlight why UGI Corporation (NYSE:UGI) is one of the best high-yield aristocrats you’ve never heard of, but definitely deserves to be on your radar.
Because right now this is an aristocrat bargain, hiding in plain sight, that could deliver exceptional returns in both the short, medium, and long-term.
UGI 2024 Consensus Total Return Potential
FAST Graphs / FactSet![]()
If UGI grows as analysts expect, by 2024 it could deliver 63% total returns, or 22% annually.
-
Buffett-like returns from an anti-bubble blue-chip bargain hiding in plain sight
UGI 2027 Consensus Total Return Potential
Fast Graphs / FactSet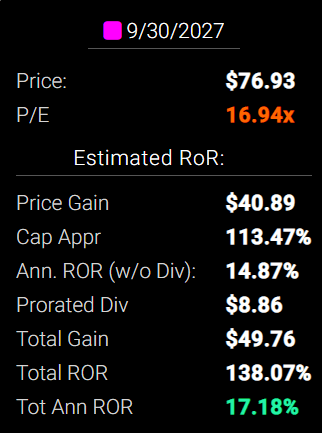
By 2027, if UGI grows as expected and returns to historical fair value, it could nearly triple and deliver 20% annual total returns.
-
Also Buffett-like returns
-
4x the S&P 500 consensus
And over the long-term, UGI is expected to slightly outperform the aristocrats, but with nearly 2x the very safe yield on day one.
|
Investment Strategy |
Yield |
LT Consensus Growth |
LT Consensus Total Return Potential |
Long-Term Risk-Adjusted Expected Return |
Long-Term Inflation And Risk-Adjusted Expected Returns |
Years To Double Your Inflation & Risk-Adjusted Wealth |
10 Year Inflation And Risk-Adjusted Return |
|
Safe Midstream |
4.9% |
6.0% |
10.9% |
7.6% |
5.1% |
14.0 |
1.65 |
|
Adam’s Planned Correction Buys |
4.0% |
18.9% |
22.9% |
16.0% |
13.5% |
5.3 |
3.56 |
|
UGI Corp |
3.8% |
7.5% |
11.3% |
7.9% |
5.4% |
13.3 |
1.70 |
|
REITs |
2.8% |
6.5% |
9.3% |
6.5% |
4.0% |
17.9 |
1.48 |
|
High-Yield |
2.8% |
11.3% |
14.1% |
9.9% |
7.4% |
9.8 |
2.04 |
|
Dividend Aristocrats |
2.2% |
8.9% |
11.1% |
7.8% |
5.3% |
13.6 |
1.67 |
(Sources: Morningstar, FactSet, YCharts)
-
UGI is an attractive high-yield utility option that offers 1% more yield than Vanguard’s high-yield ETF and is expected to match or slightly beat the dividend aristocrats over time.
Why are we excited about 11.3% long-term return potential?
Because over time it can help you retire in safety and splendor.
Inflation-Adjusted Consensus Return Potential: $1,000 Initial Investment
|
Time Frame (Years) |
7.4% CAGR Inflation-Adjusted S&P Consensus |
8.6% Inflation-Adjusted Aristocrat Consensus |
8.8% CAGR Inflation-Adjusted UGI Consensus |
|
5 |
$1,429.63 |
$1,511.29 |
$1,525.26 |
|
10 |
$2,043.84 |
$2,284.01 |
$2,326.42 |
|
15 |
$2,921.94 |
$3,451.81 |
$3,548.40 |
|
20 |
$4,177.29 |
$5,216.70 |
$5,412.23 |
|
25 |
$5,971.97 |
$7,883.98 |
$8,255.06 |
|
30 |
$8,537.71 |
$11,915.01 |
$12,591.12 |
(Source: DK Research Terminal, FactSet)
If UGI grows as expected, it could deliver 13x inflation-adjusted returns over the next 30 years.
|
Time Frame (Years) |
Ratio Aristocrats/S&P |
Ratio Inflation-Adjusted UGI Consensus And S&P Consensus |
|
5 |
1.06 |
1.07 |
|
10 |
1.12 |
1.14 |
|
15 |
1.18 |
1.21 |
|
20 |
1.25 |
1.30 |
|
25 |
1.32 |
1.38 |
|
30 |
1.40 |
1.47 |
(Source: DK Research Terminal, FactSet)
Analysts expect UGI to deliver similar inflation-adjusted outperformance to the market over the next 30 years as the last 30 years.
UGI Total Returns Since 1989
Portfolio Visualizer Portfolio Visualizer
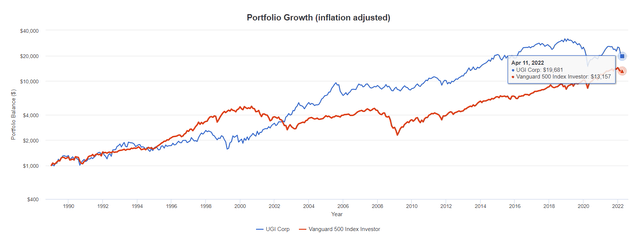
Since 1989, UGI is up 46x, or 20x adjusted for inflation, delivering 12.2% long-term returns similar to what analysts expect in the future.
-
50% better long-term inflation-adjusted returns than the S&P 500
So let’s take a look at the three reasons why UGI is one of the best-hidden gem aristocrats on Wall Street.
Reason One: World-Class Quality You Can Trust
The Dividend King’s overall quality scores are based on a 248 point model that includes:
-
Dividend safety
-
Balance sheet strength
-
Credit ratings
-
Credit default swap medium-term bankruptcy risk data
-
Short and long-term bankruptcy risk
-
Accounting and corporate fraud risk
-
Profitability and business model
-
Growth consensus estimates
-
Management growth guidance
-
Historical earnings growth rates
-
Historical cash flow growth rates
-
Historical dividend growth rates
-
Historical sales growth rates
-
Cost of capital
-
GF scores
-
Long-term risk-management scores from MSCI, Morningstar, FactSet, S&P, Reuters’/Refinitiv, and Just Capital
-
Management quality
-
Dividend friendly corporate culture/income dependability
-
Long-term total returns (a Ben Graham sign of quality)
-
Analyst consensus long-term return potential
In fact, it includes over 1,000 fundamental metrics including the 12 rating agencies we use to assess fundamental risk.
-
Credit and risk management ratings make up 41% of the DK safety and quality model
-
Dividend/balance sheet/risk ratings make up 82% of the DK safety and quality model
How do we know that our safety and quality model works well?
During the two worst recessions in 75 years, our safety model anticipated 87% of blue-chip dividend cuts, the ultimate baptism by fire for any dividend safety model.
It’s also delivered exceptional safe income and market-smashing returns over time.
DK Zen Phoenix: Superior Fundamentals Lead To Superior Long-Term Results
|
Metric |
US Stocks |
189 Real Money DK Phoenix Recs |
|
Great Recession Dividend Growth |
-25% |
0% |
|
Pandemic Dividend Growth |
-1% |
6% |
|
Positive Total Returns Over The Last 10 Years |
42% |
99.5% (Greatest Investors In History 60% to 80% Over Time) |
|
Lost Money/Went Bankrupt Over The Last 10 Years |
47% |
0.5% |
|
Outperformed Market Over The Last Decade (290%) |
36% |
46% |
|
Bankruptcies Over The Last 10 Years |
11% |
0% |
|
Permanent 70+% Catastrophic Decline Since 1980 |
44% |
0.5% |
|
100+% Total Return Over The Past 10 Years |
NA |
87% |
|
200+% Total Return Over The Past 10 Years |
NA |
66% |
|
300+% Total Return Over The Past 10 Years |
NA |
44% |
|
400+% Total Return Over The Past 10 Years |
NA |
35% |
|
500+% Total Return Over The Past 10 Years |
NA |
27% |
|
600+% Total Return Over The Past 10 Years |
NA |
23% |
|
700+% Total Return Over The Past 10 Years |
NA |
20% |
|
800+% Total Return Over The Past 10 Years |
NA |
18% |
|
900+% Total Return Over The Past 10 Years |
NA |
18% |
|
1000+% Total Return Over The Past 10 Years |
NA |
16% |
|
Sources: Morningstar, JPMorgan, Seeking Alpha |
How does UGI score on one of the world’s most accurate and comprehensive safety models?
UGI Dividend Safety
|
Rating |
Dividend Kings Safety Score (153 Point Safety Model) |
Approximate Dividend Cut Risk (Average Recession) |
Approximate Dividend Cut Risk In Pandemic Level Recession |
|
1 – unsafe |
0% to 20% |
over 4% |
16+% |
|
2- below average |
21% to 40% |
over 2% |
8% to 16% |
|
3 – average |
41% to 60% |
2% |
4% to 8% |
|
4 – safe |
61% to 80% |
1% |
2% to 4% |
|
5- very safe |
81% to 100% |
0.5% |
1% to 2% |
|
UGI |
88% |
0.50% |
1.60% |
|
Risk Rating |
Medium-Risk (52nd industry percentile risk-management consensus) – speculative |
Effective BB+ Stable outlook credit rating 13.0% 30-year bankruptcy risk |
2.5% OR LESS Max Risk Cap Recommendation |
Long-Term Dependability
|
Company |
DK Long-Term Dependability Score |
Interpretation |
Points |
|
Non-Dependable Companies |
21% or below |
Poor Dependability |
1 |
|
Low Dependability Companies |
22% to 60% |
Below-Average Dependability |
2 |
|
S&P 500/Industry Average |
61% (61% to 70% range) |
Average Dependability |
3 |
|
Above-Average |
71% to 80% |
Very Dependable |
4 |
|
Very Good |
81% or higher |
Exceptional Dependability |
5 |
|
UGI |
81% |
Exceptional Dependability |
5 |
Overall Quality
|
UGI |
Final Score |
Rating |
|
Safety |
89% |
5 |
|
Business Model |
70% |
3 |
|
Dependability |
81% |
5 |
|
Total |
83% |
12/13 Speculative dividend champion |
|
Risk Rating |
2/3 Medium Risk |
|
|
20% OR LESS Max Risk Cap Rec – highly speculative |
5% Margin of Safety For A Potentially Good Buy |
UGI: 149th Highest Quality Master List Company (Out of 506) = 71st Percentile
The DK 500 Master List includes the world’s highest-quality companies, including:
-
All dividend champions
-
All dividend aristocrats
-
All dividend kings
-
All global aristocrats (such as BTI, ENB, and NVS)
-
All 13/13 Ultra Swans (as close to perfect quality as exists on Wall Street)
-
49 of the world’s best growth stocks
UGI’s 83% quality score means its similar in quality to such blue-chips as
-
NextEra Energy (NEE) – dividend aristocrat
-
AbbVie (ABBV) – dividend king
-
Chubb Limited (CB) – dividend aristocrat
-
Sherwin-Williams (SHW) – dividend king
-
Realty Income (O) – dividend aristocrat
-
Magellan Midstream Partners (MMP)
-
Costco (COST)
-
Walmart (WMT) – dividend aristocrat
-
Air Products and Chemicals (APD) – dividend aristocrat
-
American States Water (AWR) -dividend kings
Even among the world’s highest quality companies, UGI has higher quality than 71% of them.
Why We Trust UGI And So Can You
UGI was founded 139 years ago and has been paying uninterrupted dividends for the last 137 consecutive years.
-
It sells gas, electricity, and propane in 18 countries
-
To 3 million customers
-
Through 4 businesses
-
Employing over 11,000 workers
How dependable is UGI?
-
It hasn’t missed a dividend payment since 1885
-
Through 28 recessions
-
Including six depressions
-
Four major oil spikes
-
Inflation as high as 20%
-
Interest rates as high as 20%
-
Dozens of bear markets, corrections, and over 100 pullbacks
-
It’s been raising its dividend every year since 1988
UGI is built to last, and offers a high-yield you can trust.
Management plans to grow the dividend by 4% over time so it can reduce the payout ratio steadily, and retain more earnings to reinvest in growth.
-
Which also means a steadily safer dividend
-
6% to 10% earnings growth is expected over time
UGI has four businesses.
UGI Utilities
This is an A-rated PA gas utility with over 672,000 customers in PA and a handful in Maryland:
UGI Utilities provides electric utility service to approximately 62,500 customers in Luzerne and Wyoming counties in northeastern Pennsylvania through over 2,600 miles of transmission and distribution lines and 14 substations. – UGI IR
UGI utilities also has an electric utility business with 63,000 customers in Northeastern PA.
In September 2021, UGI Utilities bought the Mountaineer Gas Company.
-
Mountaineer provides a regulated natural gas distribution business to nearly 214,000 customers in 50 of West Virginia’s 55 counties.
-
Mountaineer’s system is comprised of approximately 6,200 miles of distribution, transmission, and gathering pipelines.
UGI Energy Services
UGI Energy Services, LLC supplies and markets natural gas, electricity and liquid fuels to over 42,000 locations across Pennsylvania, New Jersey, Delaware, New York, Ohio, Maryland, Massachusetts, Virginia, North Carolina, South Carolina, Rhode Island, California and the District of Columbia.
UGI Energy Services also conducts UGI’s midstream natural gas business through its ownership of underground natural gas storage, gas peaking plants, and pipeline assets in Pennsylvania and owns all or a portion of electric generation assets principally in Pennsylvania.” – UGI IR
87% of this segment’s revenue is fee-based under long-term contracts.
UGI International
UGI International distributes liquefied petroleum gas (‘LPG’) in 17 countries in western and central Europe, operating under seven distinct brands. It also operates a gas marketing business in select countries. UGI International’s businesses are among market leaders in their respective countries.” – UGI IR
AmeriGas Partners
AmeriGas Partners, L.P. is the nation’s largest retail propane marketer, serves over 1.4 million customers in all 50 states from approximately 1,600 locations and conducting business principally through its subsidiary, AmeriGas Propane, L.P. AmeriGas is dedicated to providing its customers with the safest, most reliable and most responsive commercial and residential propane service in the country.” – UGI IR
The value proposition for UGI includes:
-
Management’s plans to deliver 6% to 10% EPS growth and 4% dividend growth over time
-
7.7% EPS growth over the last decade
-
11% CAGR rate base growth in the utility business
-
Green energy transition is on track, including 55% CO2 emissions reduction by 2025 (for the company’s operations)
Management’s goal is 6% to 10% long-term growth, which analysts think it will easily achieve, and here’s how it plans to do it.
Our Board also approved an extension of the existing share repurchase program for up to 8 million shares for an additional four-year period through to February 2026. This program extension will provide additional flexibility in deploying cash with the intent to keep shares outstanding fairly constant and at times return excess cash to shareholders. – CFO, Q4 conference call
Unlike most utilities, UGI has a buyback program, originally created to offset stock-based compensation dilution.
-
However, it could potentially drive meaningful EPS growth thanks to a low and steadily falling payout ratio providing lots of excess earnings to buy back stock at attractive valuations
However, UGI’s growth plans are not primarily based on financial engineering.
According to both the OECD and IEA (International Energy Agency), global energy usage is going to grow steadily through 2050.
-
Renewables are going to be the fastest-growing segment
-
But natural gas is expected to grow as well
-
With modest growth in propane and LPG
UGI has a $2.3 billion growth plan that it believes will grow the rate base at 10% to 11%, one of the fastest rates in the industry.
-
For a $7.6 billion market cap company, this is an enormous growth backlog
-
Equivalent to a $32 billion growth backlog at Duke Energy (DUK) or $60 billion at NextEra Energy
-
One of the largest market cap adjusted growth backlogs in the industry
Fitch likes UGI’s utility business citing “healthy customer growth” and a “supportive regulatory environment.”
-
UGI’s gas utility business sources 99% of its gas from cheap Marcellus shale
-
Helping keep customer costs low and customer satisfaction high
-
The reason for happy regulators
UGI’s international propane business has been growing at a very healthy clip for the last five years:
-
7.4% growth in national accounts
-
6.4% growth in cylinder volume
-
4.2% reduction in expenses
-
$521 million in average annual free cash flow for the company since 2019
UGI’s future lies in renewables, and that’s why its spending about 20% of its growth capex on things like renewable natural gas (methane from landfills).
Management is targeting projects that it believes can deliver 10+% long-term returns on invested capital.
-
Compared to about 9% for the company’s legacy businesses
UGI started investing in renewables in 2015 including wind and solar projects for its electric utility customers.
It’s since diversified into renewable natural gas and bio-propane.
RNG and bio propane are allowing UGI to diversify its business outside of PA, and into other states, as well as expand into Europe, and expand its operations in countries like France.
By 2024 it expects to be generating more than 1.3 billion cubic feet of renewable natural gas per year.
All these investments are with the goal of continuing the company’s historically strong 9.7% growth, which it’s maintained since 2012 and believes can continue for years or decades to come.
By 2025, UGI plans to complete $2.3 billion worth of growth projects, including over $1 billion worth of completed renewable projects.
All while steadily improving efficiencies and reducing CO2 emissions at its core propane businesses.
The company believes that it will be able to fund 90% of its spending plans with operational cash flows.
-
About $600 million in additional debt or stock offerings
-
Utilities almost always tap debt and equity markets to partially fund their growth plans.
UGI plans to focus 80+% of its growth spending on renewables and regulated utilities.
It plans to grow the dividend at 4% over time, reducing the payout ratio to 35% to 45%, one of the lowest levels in the industry.
It also plans to maintain a very safe balance sheet with 3 to 3.5x debt/adjusted EBITDA.
-
Fitch says that under 4.5 and it could start upgrading its credit ratings
UGI’s leverage has been falling steadily since 2019, and management expects it to reach 3.9x in 2022 and drop to 3.3x in 2025.
-
For most utilities, rating agencies consider 5.5x leverage safe
-
4.5X for UGI according to Fitch
-
It’s been below this level since 2020
UGI is one of the few utilities to generate consistent free cash flow.
In fact, management’s definition of free cash flow includes the dividend, and UGI generated $509 billion in excess free cash flow in 2021, after investing in its business and paying $282 million in dividends.
-
36% free cash flow payout ratio
-
Very impressive for any utility
Quantitative Analysis: The Math Backing Up The Investment Thesis
UGI Effective Credit Rating
|
Subsidiary |
2021 Operating Income ($ Millions) |
% Of Operating Income |
Credit Rating |
30-Year Default Risk |
Weighted Default Risk |
|
AmeriGas Partners |
$385 |
35.0% |
BB stable |
17.0% |
6.0% |
|
UGI International |
$314 |
28.5% |
BB+ stable |
14.0% |
4.0% |
|
UGI Utilities |
$241 |
21.9% |
A- stable |
2.5% |
0.5% |
|
UGI Energy Services |
$160 |
14.5% |
BB stable |
17.0% |
2.5% |
|
Total |
$1,100 |
100.0% |
BB+ stable |
13.0% |
(Source: Fitch)
Because UGI keeps debt at the subsidiary level, Fitch doesn’t rate it at the corporate level.
However, its subsidiaries are high junk bond rated. Weighting for 2021’s operating cash flow proportions, I estimate that if UGI paid for a corporate credit rating, it would be BB+ stable, due to its weighted 13% 30-year default risk.
-
management’s plans to continue de-leveraging its businesses could get it upgraded to investment grade by 2025
-
11% bankruptcy risk is BBB- investment grade and UGI is very close to this already
Bond Profile
-
$1.6 billion in liquidity
-
88% unsecured bonds (good financial flexibility)
-
The majority of bonds mature within five years (increases refinancing risk, see risk section)
-
4.65% average borrowing cost vs bond market’s 2.5% long-term inflation forecast
-
UGI’s effective real interest rate is 2.15% vs. 9% returns on invested capital
-
Returns on investment are 4.5x its real borrowing cost
Profitability: Wall Street’s Favorite Quality Proxy
UGI’s profitability is historically within the top 30% of its peers.
UGI Trailing 12-Month Profitability Vs. Peers
|
Metric |
Industry Percentile |
Major Utilities More Profitable Than UGI (Out Of 522) |
|
Operating Margin |
72.02 |
146 |
|
Net Margin |
69.79 |
158 |
|
Return On Equity |
86.59 |
70 |
|
Return On Assets |
82.38 |
92 |
|
Average |
77.70 |
116 |
(Source: GuruFocus Premium)
In the last year, UGI’s average profitability was in the top 23% of peers.
UGI’s industry-leading profitability has been stable or improving for 20 years, making it one of the few wide moat utilities on the Master List.
Over the last 30 years, QCOM’s industry-leading profitability has been stable or improving, confirming a wide and stable moat.
UGI Margin Consensus Forecast
|
Year |
EBITDA Margin |
EBIT (Operating) Margin |
Net Margin |
|
2020 |
22.6% |
15.4% |
11.3% |
|
2021 |
20.7% |
14.1% |
15.8% |
|
2022 |
18.4% |
11.9% |
6.3% |
|
2023 |
21.7% |
15.0% |
8.6% |
|
2024 |
24.0% |
16.4% |
9.7% |
|
2025 |
24.9% |
17.0% |
10.3% |
|
Annualized Growth |
1.51% |
1.63% |
-3.75% |
|
Annualized Growth (Ignoring Pandemic) |
4.99% |
5.28% |
-15.06% |
(Source: FactSet Research Terminal)
UGI’s profitability is expected to remain strong or improve over time, with net margins being more volatile.
UGI Dividend Growth Consensus Forecast
|
Year |
Dividend Consensus |
EPS/Share Consensus |
EPS Payout Ratio |
Retained (Post-Dividend) Earnings |
Buyback Potential |
|
2022 |
$1.41 |
$3.03 |
46.5% |
$340 |
4.50% |
|
2023 |
$1.47 |
$3.40 |
43.2% |
$405 |
5.36% |
|
2024 |
$1.53 |
$3.63 |
42.1% |
$441 |
5.83% |
|
2025 |
$1.59 |
$3.93 |
40.5% |
$491 |
6.50% |
|
Total 2022 Through 2025 |
$6.00 |
$13.99 |
42.9% |
$1,337.70 |
17.69% |
|
Annualized Rate |
4.09% |
9.06% |
-4.56% |
13.04% |
13.04% |
(Source: FactSet Research Terminal)
According to rating agencies, 75% is the safe payout ratio for utilities, and UGI’s is expected to hit 40% by 2025 and keep falling.
Over the next four years it is expected to retain over $1.3 billion in post-dividend earnings, enough to repay 19% of its debt or buy back 18% of its stock if it wanted to.
-
UGI’s organic buyback growth potential is 4% to 5%, the approximate growth rate of the utility sector
-
but from buybacks alone
Reason Two: Solid Growth Prospects For Years Or Even Decades To Come
We’ve seen how UGI has a growth backlog that is one of the largest in the industry, adjusted for market cap.
We’ve seen how management is working hard to diversify into green energy so that UGI can keep growing dividends faster than long-term inflation for decades to come.
And here’s what analysts think that will mean for UGI in the medium-term.
UGI Medium-Term Growth Consensus Forecast
|
Year |
Sales |
EBITDA |
EBIT (Operating Income) |
Net Income |
|
2020 |
$6,787 |
$1,534 |
$1,046 |
$768 |
|
2021 |
$7,672 |
$1,591 |
$1,081 |
$1,216 |
|
2022 |
$8,427 |
$1,548 |
$1,000 |
$532 |
|
2023 |
$8,522 |
$1,853 |
$1,276 |
$730 |
|
2024 |
$8,083 |
$1,940 |
$1,329 |
$785 |
|
2025 |
$8,204 |
$2,044 |
$1,396 |
$842 |
|
Annualized Growth |
3.87% |
5.91% |
5.94% |
1.86% |
|
Annualized Growth (Ignoring Pandemic) |
1.69% |
6.46% |
6.60% |
-8.78% |
(Source: FactSet Research Terminal)
UGI is expected to deliver slow but steady growth in its top and bottom lines.
|
Metric |
2020 Growth Consensus |
2021 Growth Consensus |
2022 Growth Consensus |
2023 Growth Consensus |
2024 Growth Consensus |
2025 Growth Consensus |
|
Sales |
-23% |
13% |
13% |
4% |
-7% |
1% |
|
Dividend |
8% |
2% |
5% (official) |
4% |
4% |
4% (37-year growth streak) |
|
EPS |
17% |
11% |
-2% |
15% |
7% |
8% |
(Source: FAST Graphs, FactSet Research)
Earnings per share are expected to be somewhat volatile for a utility but grow at impressive rates.
And 4% dividend growth is expected for the foreseeable future per management guidance.
UGI Long-Term Growth Outlook
-
20-year growth rate: 7.63% CAGR
-
Consensus growth range (5 sources): 7.0% to 7.5 CAGR
-
Median growth consensus from all analysts: 7.5% CAGR
-
Management guidance: 6% to 10% CAGR
How accurate are analysts at forecasting UGI’s growth over time (based on management guidance)?
Smoothing for outliers analyst margins of error are 15% to the downside and 10% to the upside.
-
5% to 9% CAGR historical margin-of-error adjusted growth consensus range
-
70% statistical probability UGI grows at 5% to 9% over time
For 20 years, UGI has pretty much grown at 5% to 9% and management’s 6% to 10% growth guidance and the analyst’s 7.5% median forecast are all reasonable given the company’s large growth backlog.
And finally, let’s talk about why UGI is one of the best aristocrat bargains on Wall Street.
Reason Three: A Wonderful Company At A Wonderful Price
In the modern low-rate era, which analysts expect to continue for the foreseeable future, tens of millions of investors have consistently paid, outside of bear markets and bubbles, 16 to 18.5x earnings for UGI.
-
90% statistical probability that UGI is worth 16 to 18.5x earnings
|
Metric |
Historical Fair Value Multiples (14-years) |
2021 |
2022 |
2023 |
2024 |
12-Month Forward Fair Value |
|
5-Year Average Yield |
2.71% |
$49.82 |
$50.92 |
$50.92 |
$56.46 |
|
|
13-Year Median Yield |
2.57% |
$52.53 |
$53.70 |
$53.70 |
$59.53 |
|
|
Earnings |
16.94 |
$49.97 |
$51.33 |
$57.60 |
$61.49 |
|
|
Average |
$50.74 |
$51.95 |
$53.93 |
$59.09 |
$52.49 |
|
|
Current Price |
$35.92 |
|||||
|
Discount To Fair Value |
29.21% |
30.86% |
33.40% |
39.21% |
31.56% |
|
|
Upside To Fair Value (NOT Including Dividends) |
41.27% |
44.64% |
50.15% |
64.50% |
46.12% (50% including dividends) |
|
|
2022 EPS |
2023 EPS |
2022 Weighted EPS |
2023 Weighted EPS |
12-Month Forward EPS |
12-Month Average Fair Value Forward PE |
Current Forward PE |
|
$3.03 |
$3.40 |
$2.21 |
$0.92 |
$3.13 |
16.8 |
11.5 |
UGI is historically worth about 16.8X earnings, and today trades at 11.5X.
-
9.4x cash-adjusted earnings
-
A bargain by even private equity standards
|
Analyst Median 12-Month Price Target |
Morningstar Fair Value Estimate |
|
$47.00 (13.6 PE) |
$40.58 (13.0 PE quant model) |
|
Discount To Price Target (Not A Fair Value Estimate) |
Discount To Fair Value |
|
23.57% |
11.48% |
|
Upside To Price Target (Not Including Dividend) |
Upside To Fair Value (Not Including Dividend) |
|
30.85% |
12.97% |
|
12-Month Median Total Return Price (Including Dividend) |
Fair Value + 12-Month Dividend |
|
$48.38 |
$41.96 |
|
Discount To Total Price Target (Not A Fair Value Estimate) |
Discount To Fair Value + 12-Month Dividend |
|
25.75% |
14.39% |
|
Upside To Price Target ( Including Dividend) |
Upside To Fair Value + Dividend |
|
34.09% |
16.82% |
Morningstar’s quant model compares UGI to its peers, not its own historical valuations.
Analysts expect UGI’s valuation to improve considerably in the next year generating 34% total returns.
Of course, we don’t care about 12-month price targets, only whether or not the current margin of safety adequately compensates investors for UGI’s risk profile.
|
Rating |
Margin Of Safety For Medium risk Speculative 12/13 quality companies |
2022 Price |
2023 Price |
12-Month Forward Fair Value |
|
Potentially Reasonable Buy |
0% |
$51.95 |
$53.93 |
$52.49 |
|
Potentially Good Buy |
15% |
$44.16 |
$45.84 |
$44.61 |
|
Potentially Strong Buy |
25% |
$38.97 |
$40.45 |
$39.37 |
|
Potentially Very Strong Buy |
35% |
$28.70 |
$35.06 |
$34.12 |
|
Potentially Ultra-Value Buy |
45% |
$28.57 |
$29.66 |
$28.87 |
|
Currently |
$36.04 |
30.63% |
33.18% |
31.34% |
|
Upside To Fair Value (Not Including Dividends) |
44.16% |
49.65% |
45.64% |
For anyone comfortable with its risk profile UGI is a potentially strong buy and here’s why.
UGI Investment Decision Score
Dividend Kings Dividend Kings
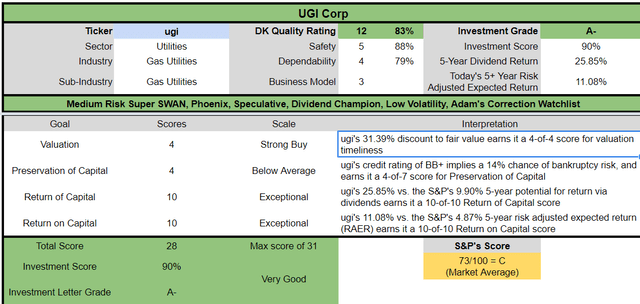
For anyone comfortable with its risk profile, UGI is one of the most reasonable and prudent high-yield aristocrats you can buy today.
-
26% discount vs 13% market premium = 39% better valuation
-
13% higher long-term return potential than S&P 500 over time
-
Almost 3x the risk-adjusted expected return for the next five years
Risk Profile: Why UGI Isn’t Right For Everyone
There are no risk-free companies, and no company is right for everyone. You have to be comfortable with the fundamental risk profile.
UGI’s Risk Profile Includes
-
Industry/economic cyclicality (gas and propane demand are more cyclical than other types of utilities)
-
Industry disruption risk (from shifting consumer and regulatory tastes)
-
Political/regulatory risk (rate cases and potential shift to electric heating)
-
Litigation risk (modest, for new midstream projects)
-
M&A execution risk (lots of tuck-in acquisitions over the years)
-
Talent retention risk in the tightest job market in 50 years
-
Supply chain disruption risk (causing havoc globally right now, makes completing new growth projects challenging)
-
Currency risk (36% of sales overseas)
-
Commodity price risk
-
Refinancing risk in a rising rate environment
UGI International had lower average LPG unit margins and lower energy marketing margins that were largely due to higher commodity costs.” – CEO, Q4 conference call
UGI uses hedges, but when energy prices soar, its propane margins can get squeezed.
How do we quantify, monitor, and track such a complex risk profile?
By doing what big institutions do.
Material Financial ESG Risk Analysis: How Large Institutions Measure Total Risk
Here is a special report that outlines the most important aspects of understanding long-term ESG financial risks for your investments.
-
ESG is NOT “political or personal ethics based investing”
-
It’s total long-term risk management analysis
“ESG is just normal risk by another name.” Simon MacMahon, head of ESG and corporate governance research, Sustainalytics” – Morningstar
ESG factors are taken into consideration, alongside all other credit factors, when we consider they are relevant to and have or may have a material influence on creditworthiness. – S&P
S&P, Fitch, Moody’s, DBRS (Canadian rating agency), AM Best (insurance rating agency), R&I Credit Rating (Japanese rating agency), and the Japan Credit Rating Agency have been using ESG models in their credit ratings for decades.
-
Credit and risk management ratings make up 42% of the DK safety and quality model
-
Dividend/balance sheet/risk ratings make up 82% of the DK safety and quality model
Dividend Aristocrats: 67th Industry Percentile On Risk Management (Above-Average, Medium Risk)
Morningstar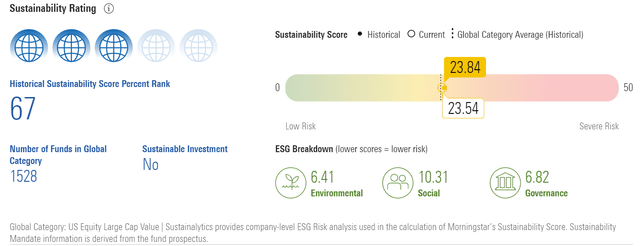
UGI Long-Term Risk Management Consensus
|
Rating Agency |
Industry Percentile |
Rating Agency Classification |
|
Morningstar/Sustainalytics 20 Metric Model |
52.5% |
34.0/100 high-Risk |
|
Reuters’/Refinitiv 500+ Metric Model |
69.0% |
Good |
|
S&P 1,000+ Metric Model |
71.0% |
Good, Positive Trend |
|
Just Capital 19 Metric Model |
26.3% |
Poor |
|
FactSet |
50.0% |
Average, Positive Trend |
|
Morningstar Global Percentile (All 15,000 Rated Companies) |
25.8% |
Poor |
|
Just Capital Global Percentile (All 954 Rated US Companies) |
70.5% |
Good |
|
Consensus |
52% |
Medium-Risk, Average Risk-Management, Positive Trend, |
(Sources: Morningstar, S&P, FactSet, Just Capital)
UGI’s Long-Term Risk Management Is The 360th Best In The Master List (28th Percentile)
|
Classification |
Average Consensus LT Risk-Management Industry Percentile |
Risk-Management Rating |
|
S&P Global (SPGI) #1 Risk Management In The Master List |
94 |
Exceptional |
|
Strong ESG Stocks |
78 |
Good – Bordering On Very Good |
|
Foreign Dividend Stocks |
75 |
Good |
|
Ultra SWANs |
71 |
Good |
|
Low Volatility Stocks |
68 |
Above-Average |
|
Dividend Aristocrats |
67 |
Above-Average |
|
Dividend Kings |
63 |
Above-Average |
|
Master List average |
62 |
Above-Average |
|
Hyper-Growth stocks |
61 |
Above-Average |
|
Monthly Dividend Stocks |
60 |
Above-Average |
|
Dividend Champions |
57 |
Average |
|
UGI Corp |
52 |
Average |
(Source: DK Research Terminal)
UGI’s risk-management consensus is in the bottom 28% of the world’s highest quality companies and similar to that of such other companies as
-
Nucor (NUE) – dividend aristocrat
-
Jack Henry & Associates (JKHY) – dividend champion
-
Cullen/Frost Bankers (CFR) – dividend champion
-
Nordson (NDSN) – dividend king
-
CVS Health (CVS)
-
Tesla (TSLA)
-
Amazon (AMZN)
The bottom line is that all companies have risks, and UGI is average at managing theirs.
How We Monitor UGI’s Risk Profile
-
4 analysts
-
1 credit rating agency
-
5 total risk rating agencies
-
9 experts who collectively know this business better than anyone other than management
“When the facts change, I change my mind. What do you do sir?” – John Maynard Keynes
There are no sacred cows at iREIT or Dividend Kings. Wherever the fundamentals lead we always follow. That’s the essence of disciplined financial science, the math behind retiring rich and staying rich in retirement.
Bottom Line: UGI Is A High-Yield Hidden Gem Dividend Aristocrat Bargain
We’re not market timers, trying to help score a quick 34% to 50% gain, though UGI is fundamentally capable of that.
We’re not here to give you “hot” stock tips to help you get rich quick.
Our goal at iREIT and Dividend Kings is to turn you into a stock market genius.
To paraphrase Napoleon, the definition of a stock market genius is
“The investor who can do the average thing when everyone else around him/her is losing their mind.”
And while we can’t tell you what UGI’s price will do tomorrow or even this year, here is what we can say.
Reasons To Potentially Buy UGI
-
83% quality medium-risk 12/13 quality speculative dividend champion
-
Very safe 3.8% yield (88% safety score)
-
0.5% average recession dividend cut risk
-
1.6% severe recession dividend cut risk
-
34-year dividend growth streak
-
31% conservatively undervalued (potential strong buy)
-
Fair Value: $52.53 (16.8x earnings)
-
11.5x earnings vs 16 to 18.5x historical
-
9.4 cash-adjusted earnings = bargain by private equity standards
-
Effective BB+ stable outlook credit rating = 13% 30-year bankruptcy risk
-
52nd industry percentile risk management consensus = average
-
5% to 9% CAGR margin-of-error growth consensus range
-
7.5% CAGR median growth consensus
-
6% to 10% CAGR management guidance
-
5-year consensus total return potential: 16% to 20% CAGR
-
Base-case 5-year consensus return potential: 17% CAGR (4x market consensus)
-
Consensus 12-month total return forecast: 39% (13.6 P/E, very conservative)
-
Fundamentally Justified 12-Month Returns: 50% CAGR
In an overvalued market, with rising interest rates, value stands to potentially be the safest strategy for the rest of 2022.
And when it comes to high quality, deep value high-yield aristocrats, they don’t come much better than UGI.
This truly is a hidden gem aristocrat bargain that deserves to be on your radar.
Be the first to comment