

Roger Asbury/iStock via Getty Images
Volckernomics
Paul Volcker is widely recognized as the Federal Reserve’s greatest Chairman. Far less well understood is that he was an outstanding economist with a deep strategic understanding of monetary relationships. The most critical conclusions are contained in his autobiography – Keeping At It: The Quest for Sound Money and Good Government – published in 2018. These observations apply directly to the monetary policy situation that the U.S. faces now. The most important passages occur on pages 117-18:
“I suppose if some Delphic Oracle had whispered in my ear that our policy would result in interest rates of 20 percent or more, I might have packed my bags and headed home. But that option wasn’t open. We had a message to deliver, a message to the public and ourselves.”
The message was that the Fed understood the critical role of money in causing inflation and that the Fed “could not back away from restraining money growth without risking a damaging loss of credibility, that once lost, would be hard to restore.” He goes on to say that due to the work of Nobel Laureate Milton Friedman the public understood the relationship between money growth and inflation. He adds “To overdramatize a bit, we were doomed to follow through. We were ‘lashed to the mast’ in pursuit of price stability.”
This section of Volcker’s book concludes: “Did I realize at the time how high interest rates might go before we could claim success? No. From today’s vantage point, was there a better path? Not to my knowledge-not then or now.”
This statement is very telling because earlier in the book, Volcker wrote that Friedman had acknowledged that the relationship between money (M) and economic activity was not as stable as when Volcker was chairman of the Fed. Thus, Volcker and Friedman were aware that the velocity of money is not stable.
To put this in technical terms that neither Volcker nor Friedman used, velocity (V) is an endogenous variable just as much as consumption, investment, GDP and interest rates are endogenous. Thus, to Volcker even though there was this important missing relationship in Friedman’s model, based on the equation that GDP = M x V, the best approach for the Fed to achieve price stability was to rely on this basic monetary model.
Powell v. Volcker
Two subjects are of over-riding importance in order to evaluate Powell against the high standard set by Volcker:
- the paramount importance of achieving price stability as a prerequisite of sustainable economic growth, and,
- the role of money in controlling inflation. Powell is clearly aligned with Volcker on inflation but not the role of money.
Inflation: Powell, like Volcker has clearly demonstrated than an economy cannot inflate away its problems and that such a strategy makes the overwhelming majority of Americans worse off. This is the way that Powell very clearly expressed this understanding in his speech at Jackson Hole on August 26:
“Without price stability, the economy does not work for anyone. Without price stability, we will not achieve a sustained period of strong labor market conditions that benefit all. The burdens of high inflation fall heaviest on those who are least able to bear them.“
Money: Powell, in testimony before the Senate Committee on Banking, Housing and Urban Affairs in February 2021, disagreed very sharply with Volcker on the role of money. In the same hearing in which he incorrectly said that inflation was not a problem anytime soon, he had an interchange with Senator Kennedy on money and inflation.
In response to Kennedy’s concern that rapid growth in money would lead to accelerating inflation, Powell replied “When you and I studied economics a million years ago M2 and monetary aggregates seemed to have a relationship to economic growth.” Then he added “Right now… …M2… does not really have important implications. So, something we have to unlearn, I guess.”
Powell’s statement is totally inconsistent with Paul Volcker’s final say on monetary economics shortly before he died. Moreover, Powell’s rejection of Volcker’s framework coincided with the Fed ignoring nearly unprecedented liquidity growth in 2020 and 2021, which in turn, led to the worst cost of living crisis in 42 years. 180 million Americans suffered the largest permanent decline in real wage, salary and retirement income since 1980. The size of this pain was far greater than the benefit gained from roughly 6 million new jobs.
This major difference is very significant since the Fed has constitutional responsibility for the supply of money. With effective but not total control, money is the closest variable in their arsenal to effect economic change. By ignoring money growth, as in recent years, the Fed is less likely to know when it is consistent with price stability.
Restoring Price Stability
Taking into explicit consideration of both monetary growth and velocity, it is possible to calculate when the three-year growth in liquidity will return to a range consistent with the economy’s production function and a 2% inflation rate.
This would be in line with Friedman’s optimum quantity of money except that Friedman incorrectly assumed velocity was stable and was not taken into consideration. Without accounting for velocity, Friedman’s optimum quantity of money is based upon the economy’s production (technology interacting with the factors of production – labor, capital and land) and an allowance for 2% inflation.
Currently, in that formulation money growth should be contained in a range of 3% to 5%. Velocity captures all of the following factors that could influence economic activity other than money. These would include the shadow banking economy, wealth, financial innovation and most importantly the productivity of debt and the shifting composition of bank assets between investments in government securities and loans to the private sector.
Based upon the calculation by the insightful young economic analyst Eric Basmajian, of EPB Macro Research, by the end of first quarter of next year the three-year rate of growth in Other Deposit Liabilities (ODL) of the banks, a superior alternative to M2, will be consistent with a longer-term trend rate of 2% inflation. Achieving the actual target will be later since inflation is a lagging indicator. This estimation allows for the fact that ODL velocity fell sharply in both 2020 and 2021 and remained depressed in the first two quarters of this year (Chart 1).
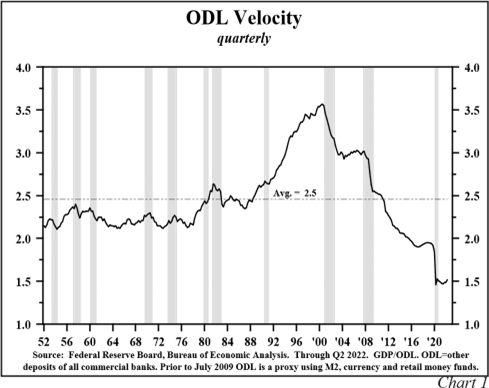
In 2020, 2021 and the first half of this year ODL velocity averaged 1.6, versus 2.5 since 1952. Also, Basmajian, assumes that the 1.6% annual rate of decline in ODL that occurred in the first eight months of this year will deepen due to a decrease in the Fed’s portfolio of government and agency securities that is now running off at $96 billion per month and a decline in total reserves due to increases in the policy rate, of which the central tendency median of the FOMC indicates that there will be three between now and next February.
ODL surged 28% from the end of 2019 to end of 2020, followed by a 13.5% increase on this same basis in 2021 (Table 1 below).
Recent Changes in the Monetary Base, Total Reserves and Other Deposit Liabilities
|
Quarterly |
|||
|
Total Reserves(y-o-y) |
Other Deposits of Commercial Banks (y-o-y) |
CPI (y-o-y) |
|
|
2020 |
84.6% |
28.0% |
2.1% |
|
2021 |
33.6% |
13.5% |
9.1% |
|
2022 |
-35.2% (39 week a.r.) |
-1.8% (38 week a.r.) |
5.8% (3 month a.r.) |
The Fed is making progress because they are chipping away the 2020-21 explosion of total reserves. After increases of 84.6% and 33.6% in those two years, a decline of 35.2% annual rate has occurred thus far this year. Although the Fed does not focus on these reserve and monetary aggregates, Fed operations will have consequences in the direction that reserve and monetary aggregates take.
If the Fed fails to complete the promising start to neutralizing the liquidity mountain of 2020-21, Fed actions will result in higher inflation, perpetuation of the cost-of-living crisis and a lower standard of living with greater and longer lasting job losses than if they stay their present course.
Surging, then reversing ODL combined with a very low level of velocity has three implications. First, inflation of goods, services, financial assets, property and other minor items prices simultaneously advanced. Some of the ODL may have been channeled into particularly risky assets. This process has historically led to bubbles and eventually their collapse. Thus, this effect may disrupt the economy in more subtle ways in the time to come. It will be difficult to connect such an outcome to money and velocity, but the effect will, nevertheless, be present.
Second, swings in U.S. money growth have correlated with changes in money growth in major foreign economies. Thus, in 2020/21 Fed policies increased global inflation. But now foreign central banks are tightening, and the Fed is reinforcing their efforts.
The third implication is from the renowned Swiss investor and financial markets strategist Felix Zulaf who observes that the U.S. banking system is eager to raise cash while shrinking its loans to foreign entities (in and outside the U.S.).
To quote directly: “The European banking system – which is an intermediary in this process … is doing the same thing.”
He goes on to point out that the big credit boom in China, particularly from about 2017-18 was at the margin carried on by important foreign funding because the Chinese banking system was unable to finance the high growth.
Now, loan growth in China is still high but for Felix this may be misleading: “despite large current account surpluses in China and Asia, Asian forex reserves have been declining sharply over the last 6-9 months. This quite likely suggests, USD borrowers are paying back their USD denominated loans that are not being rolled any longer – forced repayment.” He continues, “Thus, the credit growth in China may give a wrong impression of strong underlying economic growth which in fact is not true.”
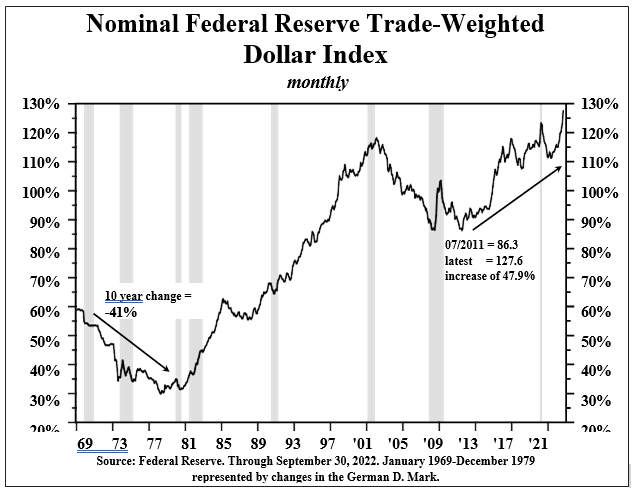
Later he discusses how the developing shortage of U.S. dollars is forcing USD short rates and the U.S. dollar higher. Thus he concludes, “The movie of the last 15 years is sort of running backwards. This means that the pool of U.S. dollars outside the U.S. is shrinking, which leads to a liquidity shortage.” Zulaf’s highly cogent argument is confirmed by the Fed’s nominal trade weighted dollar which has traded at the highest level since 1970, a time that roughly corresponds with the system of floating exchange rates (Chart 2 below). From the low point ten years ago to recent levels the dollar advanced 48%.
Recession On The Horizon
For the National Bureau of Economic Research (NBER) cycle dating committee recessions and expansions are determined by the seven indicators (Table 2 below).
Recession Monitor: Checking the NBER Indicators
|
Peak |
Latest |
||
|
A |
B |
||
|
1. |
Nonfarm employment |
153.0 |
153.0 |
|
2. |
Real personal income less transfer payments |
14,596 |
14,553 |
|
3. |
Industrial production |
104.7 |
104.5 |
|
4. |
Real manufacturing and trade sales |
1,585,920 |
1,545,452 |
|
5. |
Houshold employment |
158,936 |
158,936 |
|
6. |
Real personal consumption expenditures |
14,124.4 |
14,124.4 |
|
7. |
Real average of GDP and GDI |
20057.2 |
20022.6 |
| Source: Bureau of Economic Analysis, Federal Reserve Board, Bureau of Labor Statistics. |
All are based on monthly data points except the real average of quarterly GDP and GDI. The majority of these indicators – real income, real business sales, industrial production and the weighted average of real GDP and GDI – are already declining. Significantly, the average of real GDP and GDI declined in both the first and second quarters (Chart 3 below).
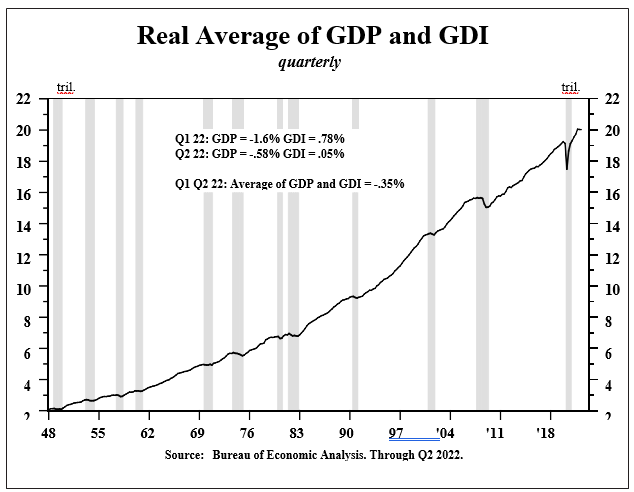
Declines in real GDP in both quarters of 2022 were greater absolutely than small increases in real GDI. This suggests the drop in real GDP in the first half of 2022 was not a fluke. The weighted average is the broadest measure of economic performance of the seven components in the NBER measuring standard. The most notable exceptions to the recessionary tendency are the two employment measures, but both are lagging rather than coincident indicators.
Also, with jobs rising and aggregate demand falling, productivity is slumping at a record pace. This is a sign of job hoarding, an effect that will sharply erode profits if continued. Real personal consumption expenditures are also still positive, but a very severe drop in the personal saving rate to 3.4% in the second quarter suggests a household budget under considerable distress and weakness in spending is coming (Chart 4 below).
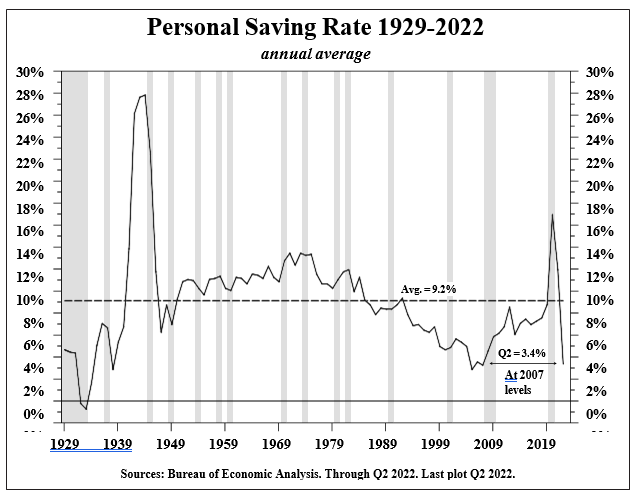
When the labor markets turn down, consumers will be faced with an even greater urgency to live within their means.
Based on preliminary and very incomplete third quarter information, real GDP has improved while real GDI deteriorated. The key elements of real domestic final demand – consumer durable purchases, housing and business fixed investment – all decreased in the third quarter. A significant reduction in the current account deficit is a sign of future economic weakness even though it is a plus in terms of the GDP calculation. Such disparities are a common occurrence at the turn from expansion to recession.
Other troubling signs confirm this view, including an across the board weakening in rail, trucking and ocean-going freight and a long and diversified list of corporate profit warnings. The index of leading economic indicators peaked in February and has declined for six consecutive months, resulting in a year over year decrease in the LEI. These developments point to a recession around the turn of the year. Additionally, the yield curve has inverted, a development consistent with a recession next year.
Conclusion
The FOMC greatly damaged their credibility when they allowed inflation to race far above their target. Sadly, the deteriorating economic prospects are a direct consequence of the Fed’s failure to execute their fiduciary responsibility to the American public.
Almost universally, the other members of the FOMC have supported the Fed chair’s position that low inflation is of paramount importance to deliver a rising standard of living for all. If the Fed were to abandon its commitment to the inflation target, the FOMC would suffer a major double blow to its integrity, which would be increasingly more difficult to restore as Volcker so cogently argued. Failure of the Fed to achieve its target would also have the consequence of allowing an emergent money/price/wage spiral to become entrenched, causing a dismal replay of the two- decade span from the early 1960s to the early 1980s.
The Fed’s mettle will be tested because highly over leveraged institutions will fail as they historically have done in such situations. Bad actors or their enablers should be directed to bring their collateral to the discount window or, if necessary, to the bankruptcy process rather than be given bailouts that have severely widened the income and wealth divides in the U.S. while causing the Fed to sacrifice price stability that’s so essential for broad-based economic gains.
These considerations suggest that the Fed’s current stance should continue. The long-term Treasury market is in the zone of digesting the rapid inflation of the past several quarters, and future Fed rate hikes. Barring any capitulation in the determination to quell inflation by the Fed, long Treasuries will increasingly reflect the looming recession and its deflationary circumstances.
Hoisington Investment Management
DisclosuresTo receive more information about Hoisington Investment Management Company (HIMCo) please contact V.R. Hoisington, Jr. at (800) 922-2755, or write HIMCo, 6836 Bee Caves Road, Building 2, Suite 100, Austin, TX 78746. Hoisington Investment Management Company (HIMCo) is a federally registered investment adviser located in Austin, Texas. HIMCo is not registered as an investment adviser in any other jurisdictions and is not soliciting investors outside the U.S. HIMCo specializes in the management of fixed income portfolios and is not affiliated with any parent organization. The Macroeconomic Fixed Income strategy invests solely in U.S. Treasury securities. Information herein has been obtained from sources believed to be reliable, but HIMCo does not warrant its completeness or accuracy; opinions and estimates constitute our judgment as of this date and are subject to change without notice. This memorandum expresses the views of the authors as of the date indicated and such views are subject to change without notice. HIMCo has no duty or obligation to update the information contained herein. This material is for informational purposes only and should not be used for any other purpose. Certain information contained herein concerning economic data is based on or derived from information provided by independent third-party sources. Charts and graphs provided herein are for illustrative purposes only. This memorandum, including the information contained herein, may not be copied, reproduced, republished, or posted in whole or in part, in any form without the prior written consent of HIMCo. |
Editor’s Note: The summary bullets for this article were chosen by Seeking Alpha editors.
Be the first to comment