

Kwangmoozaa/iStock via Getty Images
The S&P 500 had its worst start to a year since 1970. Vanguard S&P 500 ETF (NYSEARCA:VOO) was down 20%, including dividends, from January through June with only one sector finishing positive. Small-cap stocks were down even more. The first half of July, however, could provide a tailwind if seasonal stock market trends hold true.
Vanguard S&P 500 ETF Total Return In the First Half: -19.95%
StockCharts.com
A run-up into second quarter earnings season would be welcomed news for the bulls after such a sharp first-half plunge. In June alone, the SPX was off more than 8% for its second-worst June since 1950. The only stocks that seemed to hold up well in H1 were those in the Energy sector and firms that paid out big dividends. Everything from tech to retail to industrials was slammed, though a few big-cap health care names stood out in the black.
S&P 500 Returns: TMT Under Fire, High Dividend Stocks Strong
Finviz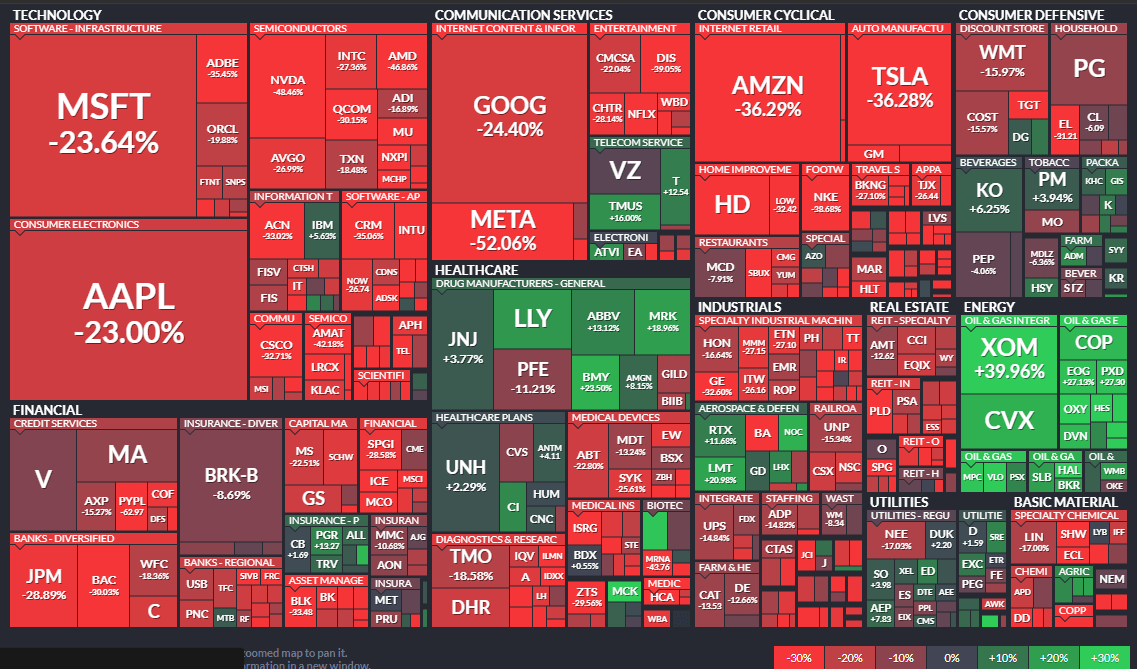
While the worst of the year could already be in the rearview mirror, it’s no cakewalk looking ahead. Seasonal trends during a mid-term election year are usually skittish through October. But there’s a narrow bullish window now through July 16 when averaging returns each year since 1950, according to research from Ryan Detrick.
S&P 500 Seasonality Since 1950: Strength During the First Half of July
Ryan Detrick
After that, though, all eyes will be on two key variables: Corporate earnings season and the July FOMC meeting. Expect volatility to continue running high – just look at reports from Restoration Hardware (RH) and Micron (MU). Recently, we have seen a more typical “risk-off” environment in which stocks sell off while Treasuries catch a bid. Interest rates may have peaked earlier this month when both the 2yr and 10yr yields rose to near 3.5%, according to The Wall Street Journal.
U.S. Treasury Yields: Rates May Have Peaked in Mid-June
Wall Street Journal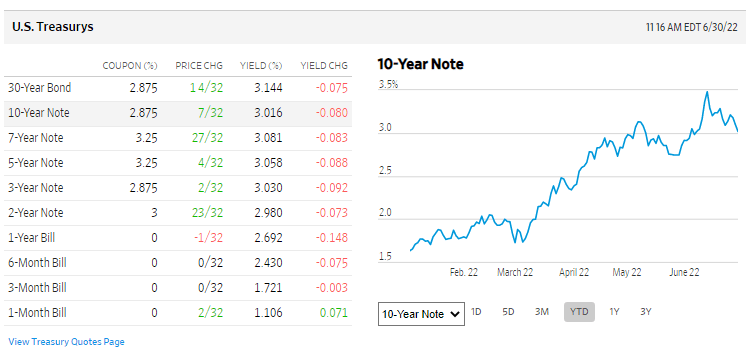
Digging in deeper, what parts of the market might we see some relief in the coming weeks? Once again, seasonal trends can help us find some winning pockets. There’s a great resource from Equity Clock that I like to reference regarding seasonality. Sector wise, defensive areas often show alpha in July. Consumer Staples stocks and the Healthcare sector are usually favored.
Sector Seasonality: Summer Suggests Staples and Health Care Favored
Equity Clock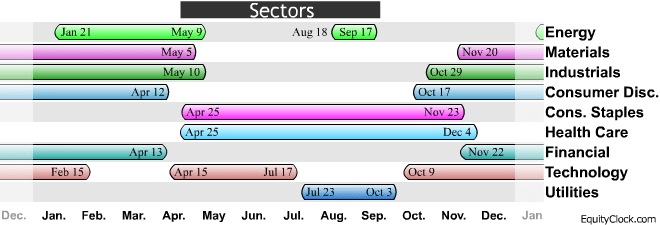
To wit, these are among the best groups over the last month. Perhaps these relative strength sectors will keep up their mojo. The bulls really want to see more cyclical and high-beta areas do well, though. When defensive sectors outperform, that’s a sign of a weak overall market. Expect more downside on the S&P 500 if “safety-trade” sectors attract flows.
First Half Sector Returns: Energy the Lone Winner
StockCharts.com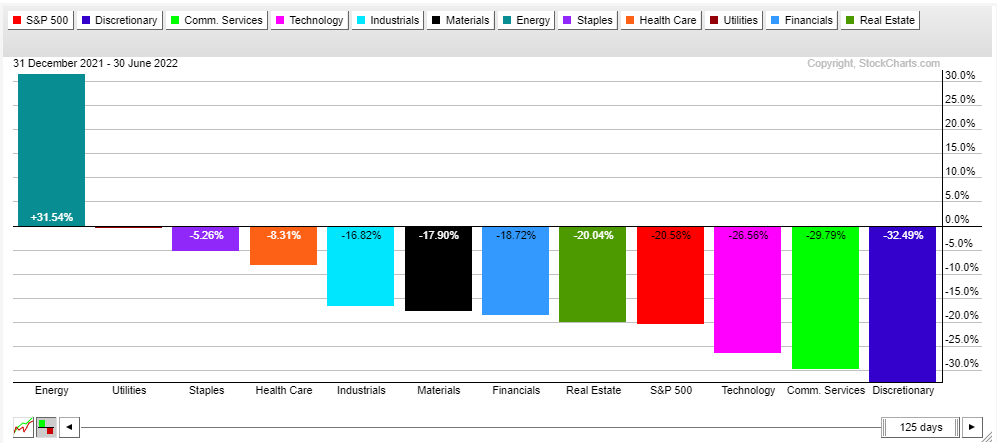
Sector rotation analysis suggests that when Staples, Healthcare, and Utilities rally on a relative basis vs the S&P 500, we are toward the “early recession” stage of the economic cycle (sound familiar?). For clues on when a sustained bullish turn might happen, as opposed to just a two-week seasonal rally, look for the Financials and Real Estate sector to turn higher.
Market Cycle (Orange) and Economic Cycle (Blue)
StockCharts.com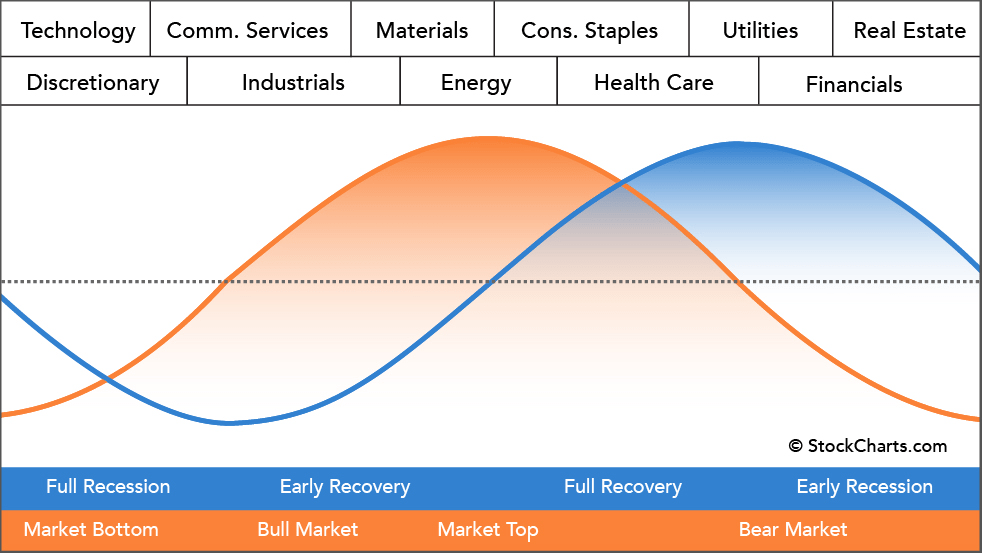
Beyond mid-July, fasten your seat belt! Once again using Equity Clock’s charts, we find that the Dow Jones Industrial Average has its fits and starts through mid-August before a particularly unsettled stretch from then through the end of the third quarter. Interestingly, large-cap U.S. stocks normally rally ahead of the mid-term election. Then the usual year-end ascent takes hold.
DJIA Election Cycle: Bullish End To 2022?
Equity Clock
The really good news for the bulls is that pre-election years are often fantastic periods. In fact, there has never been a negative return on the S&P 500 from a mid-term election over the ensuing 52 weeks, according to Capital Group.
The Bottom Line
Seasonal trends are a tailwind for the bulls in the near term. Earnings season and a Fed meeting will soon be the talk of the tape. Once Q2 reporting season passes, a bearish part of the calendar takes hold. That could be the final harsh stretch to endure before the most bullish part of the election cycle begins.
Be the first to comment