

imaginima
HF Sinclair Corporation (NYSE:DINO) is an interesting name that investors can consider accumulating as a hedge against high retail energy prices. It is currently generating windfall profits from high refining margins that could last longer than most analysts expect. It trades at a discount to peers on a P/E basis while sporting a 3.4% dividend.
Brief Overview
HF Sinclair Corporation is a mid-sized oil refiner with 7 refineries and a combined 678,000 bpd of refining capacity. It owns the iconic DINO brand and markets fuel in over 1,300 branded service stations across the U.S. HF Sinclair also has a renewable diesel business with capacity to produce 380 million gallons of diesel per year, as well as an integrated specialty lubricants business based in Mississauga, Ontario, with 34,000 bpd of production capacity. Finally, it owns 47% of the LP interest in Holly Energy Partners L.P. (HEP), an MLP focused on midstream assets surrounding HF Sinclair’s refineries. Figure 1 gives an executive summary of HF Sinclair’s business.
Figure 1 – DINO Overview (DINO investor presentation)
Investors may be unfamiliar with the name HF Sinclair, as it is a relatively new corporate entity, only established in March of 2022. HF Sinclair used to be known as HollyFrontier Corporation (“HollyFrontier”), and traded under the ticker (“HFC”).
In March, HollyFrontier and HEP established HF Sinclair Corporation as the new parent holding company for HollyFrontier, and announced the completion of the acquisition of Sinclair Oil assets.
DINO Refineries Have Pricing Advantage
The Refining of crude oil into gasoline and other petroleum products is HF Sinclair’s largest business segment, accounting for the vast majority of the company’s sales and earnings.
Due to the location of DINO’s refineries, they tend to have a pricing advantage versus gulf-coast refineries. For example, Western Canadian Select, a heavy sour blend of Canadian crude that feeds DINO’s mid-western refineries, typically trade at a $10 to $20 discount to WTI due to transportation bottlenecks. At the same time, regional gasoline markets served by DINO tend to have higher gasoline pricing than the gulf coast (Figure 2).
Figure 2 – DINO crude and product advantage (DINO investor presentation)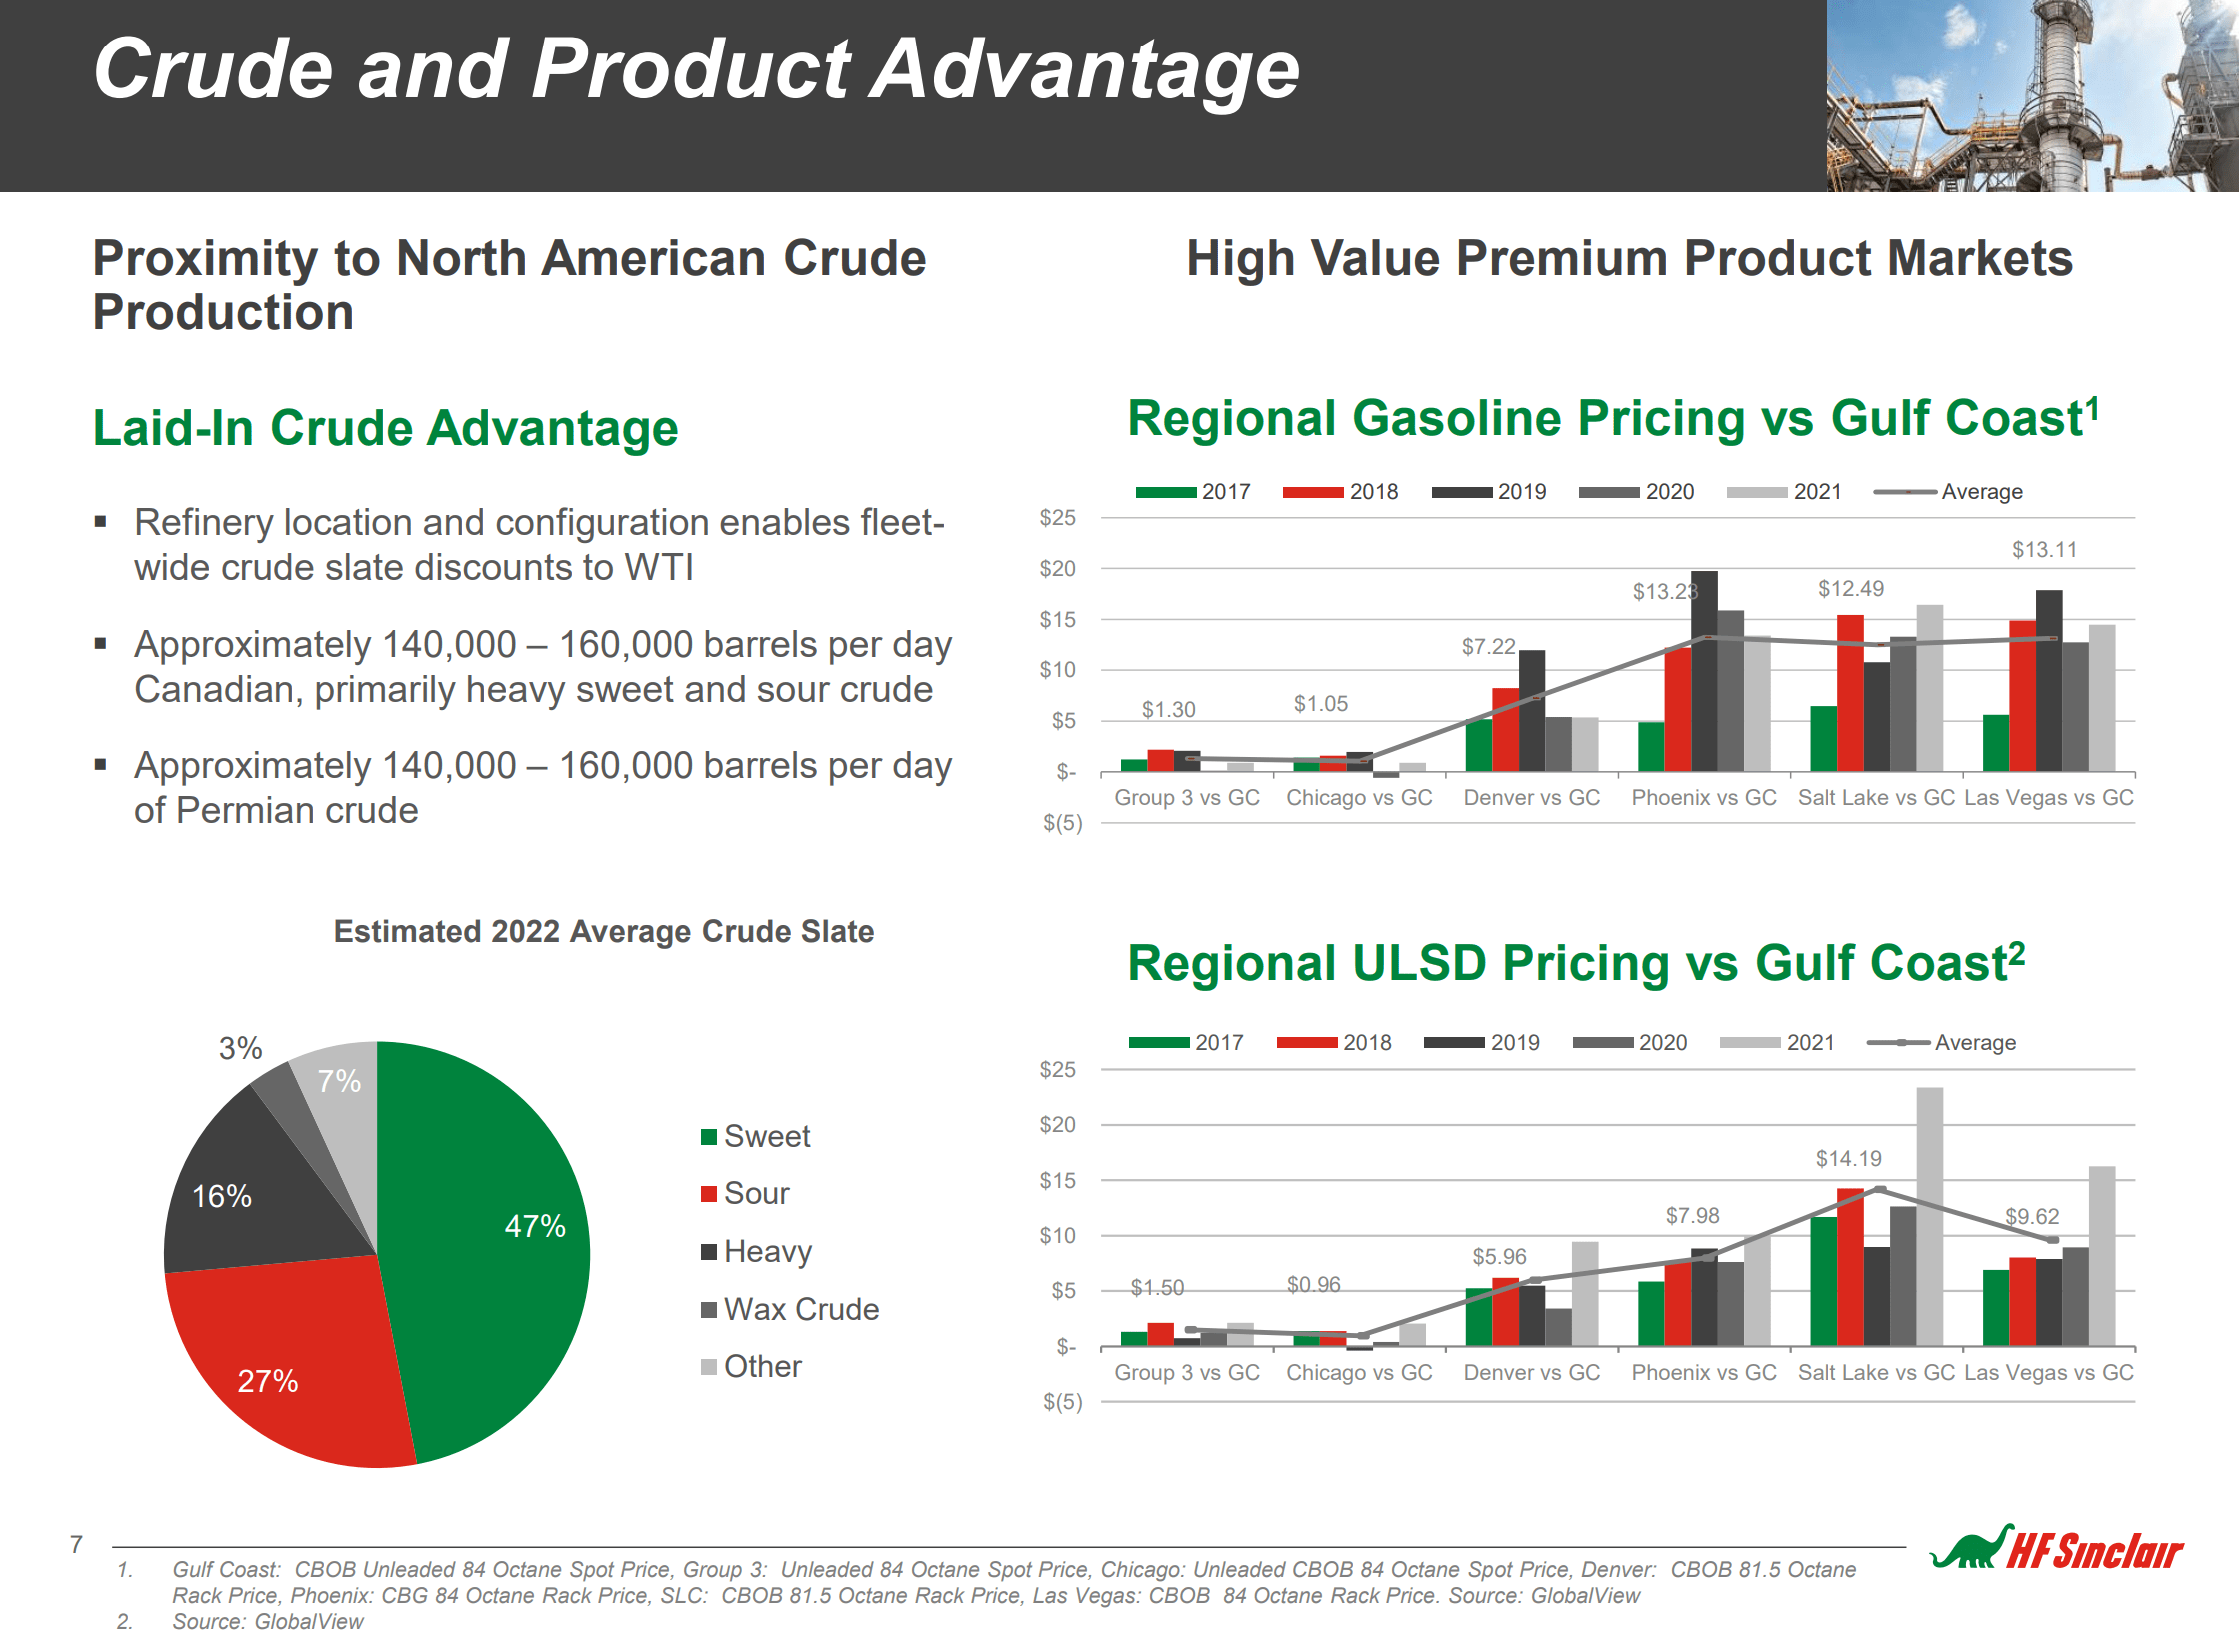
Refining Margins Have Normalized But Still Elevated
Refining margins are cyclical and depend on a variety of factors such as product demand, crude supplies, and capacity utilizations. Historically, the 321-Crack Spread, a measure of refinery profitability, averaged between $10 to $20 since the early 2000s, with periodic spikes and troughs (Figure 3). However, in recent months, crack spreads went on an epic surge, as Russian refined products were taken off the market and post-COVID consumers returned to the roads with a vengeance.
Figure 3 – 321-Crack Spreads surged on Russian oil bans (Seeking Alpha)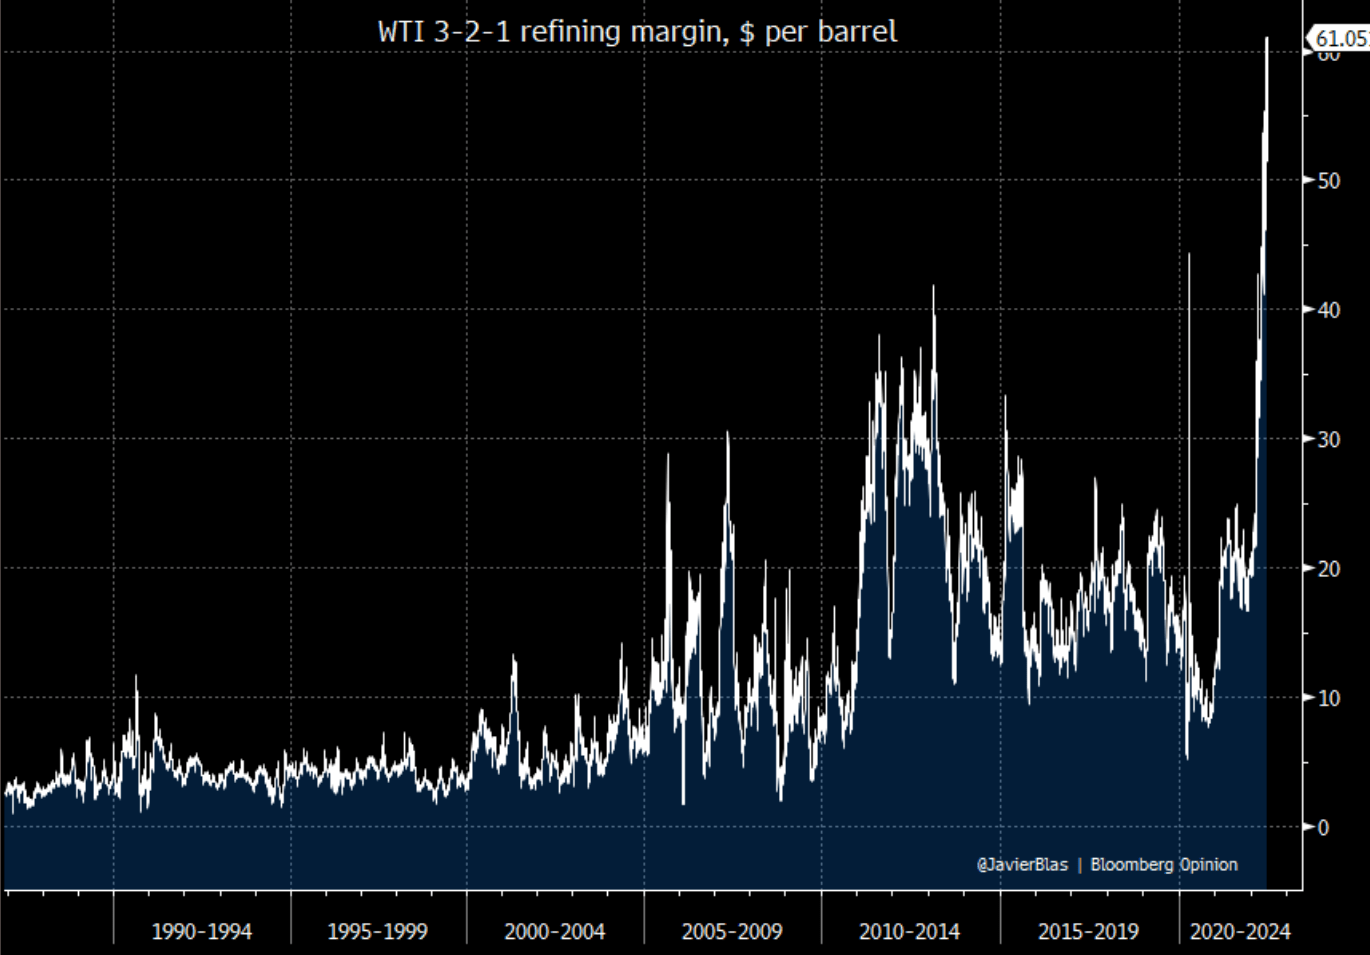
In June, the 321-Crack Spread topped $60 a barrel, prompting President Biden to publicly criticize refiners for their profits and bemoaning $5 per gallon gasoline prices across the country.
At the time, I publicly tweeted that President Biden’s rhetoric was much ado about nothing, as gasoline’s strong seasonality means prices were set to rapidly deflate post the Fourth of July holidays (Figure 4).
Figure 4 – Gasoline shows strong seasonality (Equityclock.com)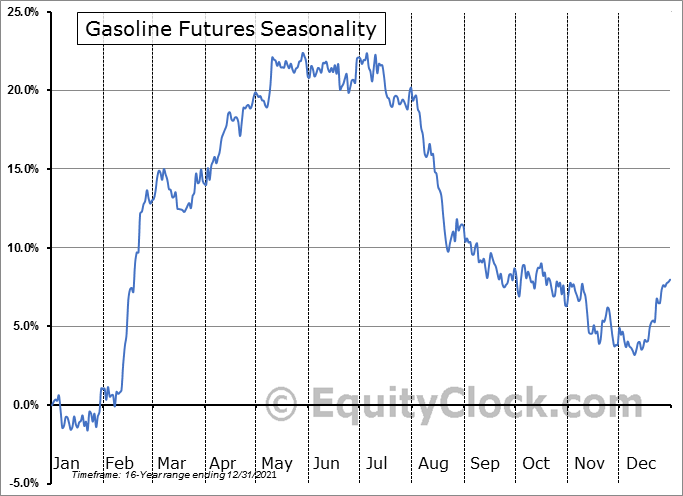
Sure enough, wholesale gasoline prices have since declined by 25% from the early June peak (Figure 5). Refiner margins have also come back to earth, with 321-Crack Spreads recently trading at $38 a barrel.
Figure 5 – Gasoline prices are down 25% from peak (tradingeconomics.com)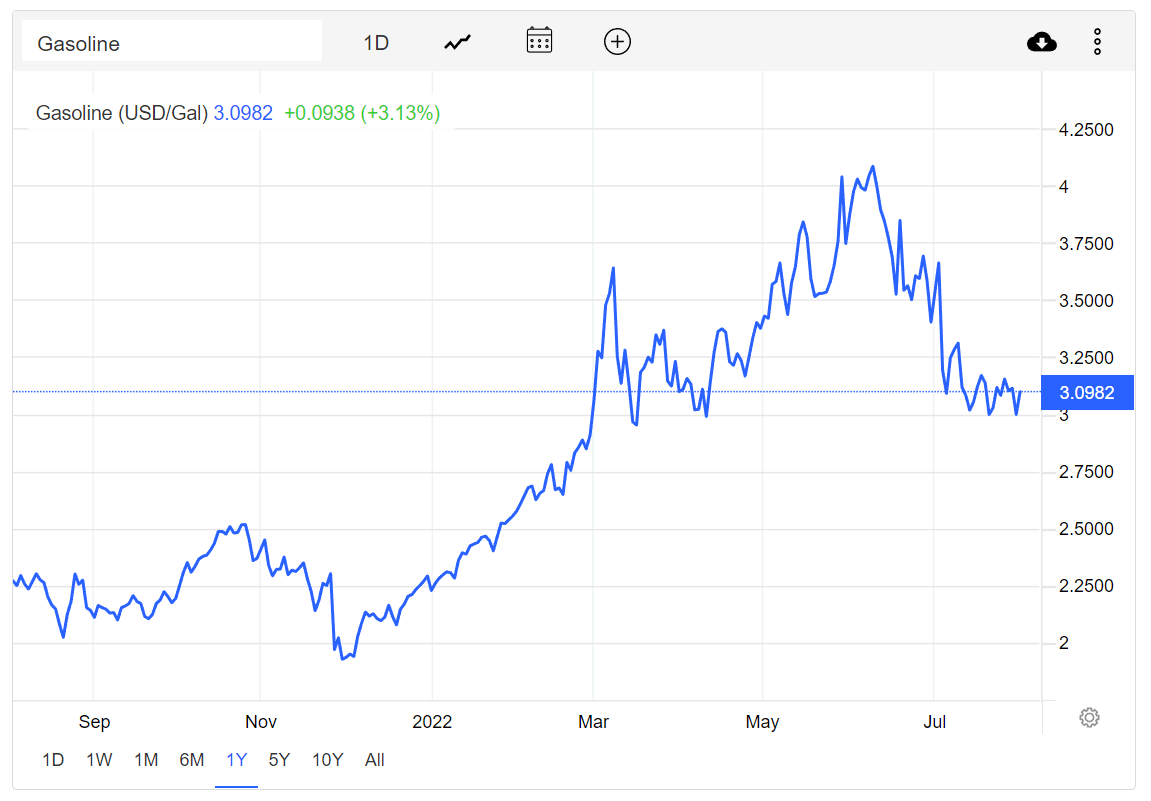
Although refiner margins have contracted significantly, it is still at historically high levels of profitability. For example, HF Sinclair had a slide in their March investor presentation on mid-cycle refining profitability (Figure 6). Assuming a mid-cycle $10 Gulf Coast 321-Crack Spreads, HF Sinclair expects to generate $1.35 billion in refining EBITDA.
Figure 6 – DINO refining mid-cycle EBITDA (DINO investor presentation)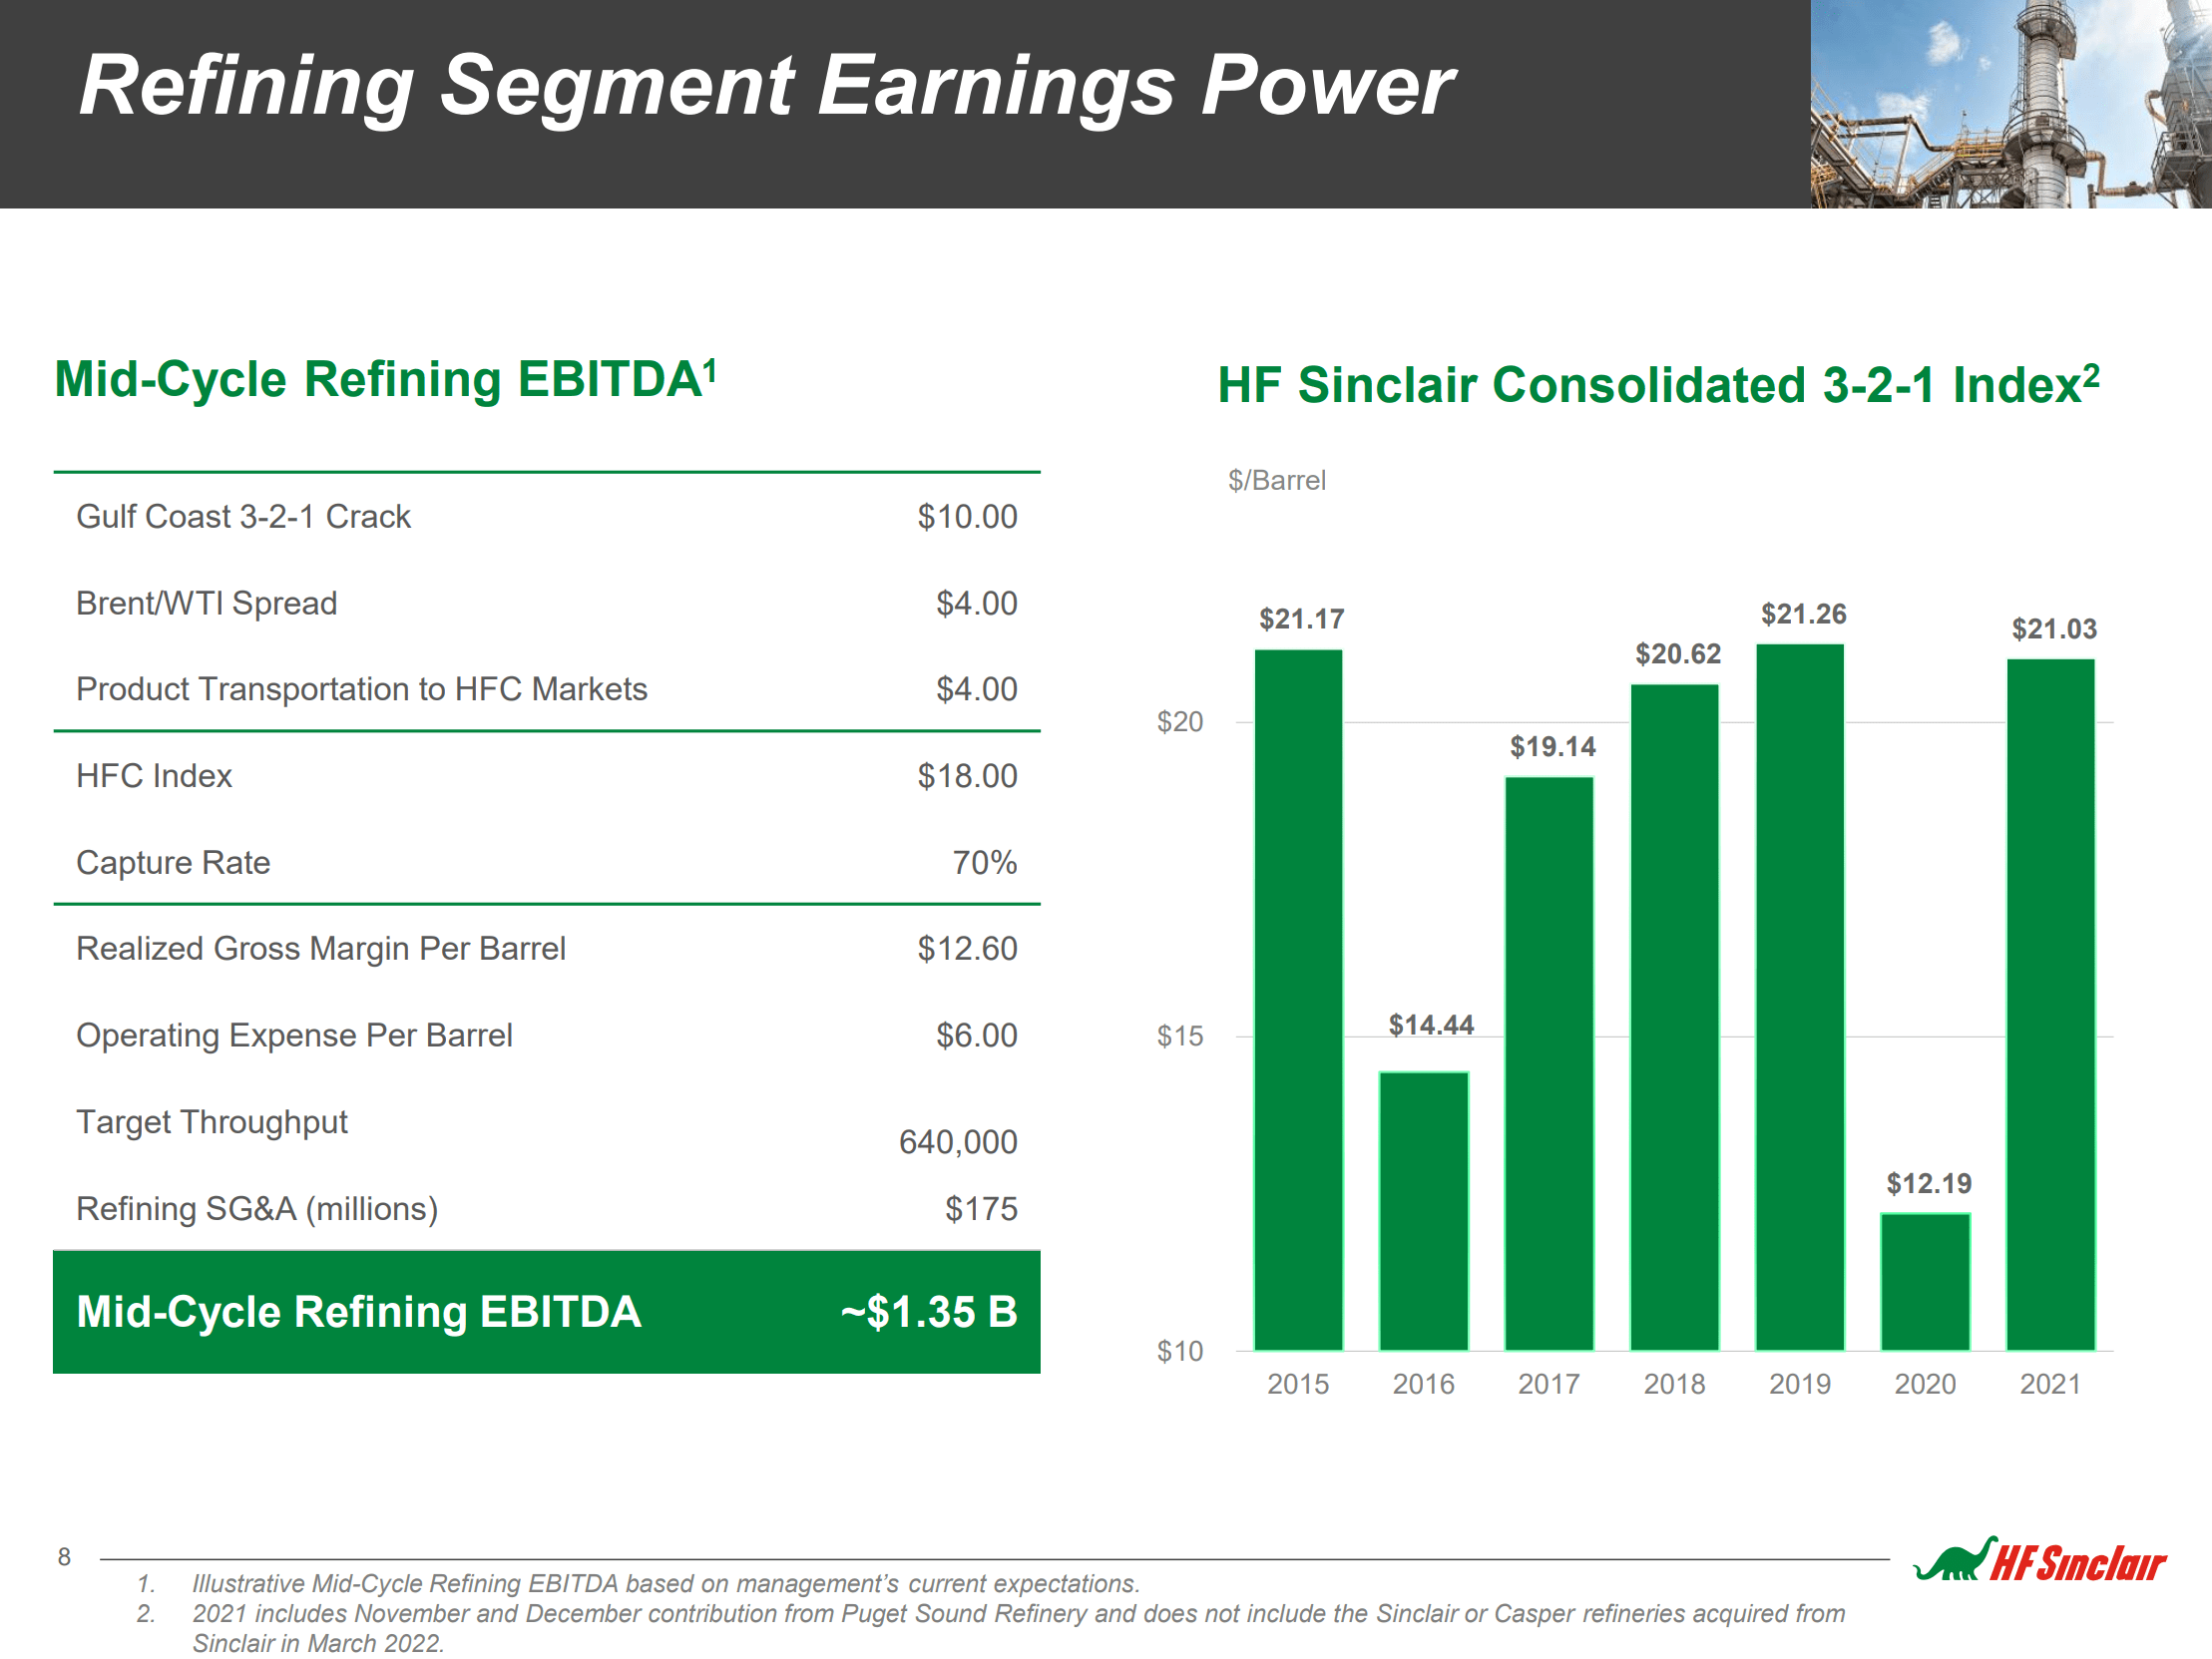
If we plug in current crack spreads and Brent/WTI spreads into the above equation, we can come up with a current run-rate refining EBITDA of over $6 billion. Even if we conservatively model crack spreads declining a further 48% from current levels to $20 per barrel, DINO should still generate almost $3 billion in refining EBITDA (Figure 7).
Figure 7 – DINO refining EBITDA sensitivity to crack spreads (Author created)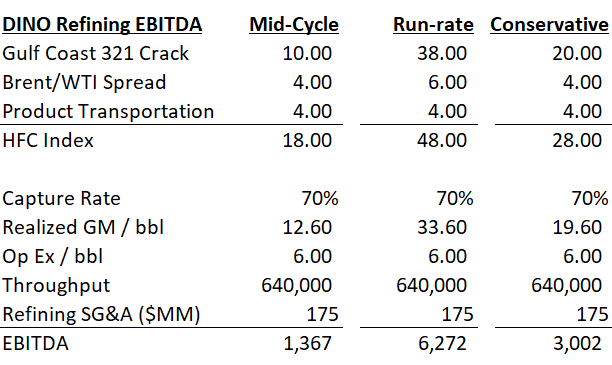
Refining Margins Could Stay Elevated For Awhile
There is reason to believe a higher than historical level of refining profitability should be sustainable in the medium term. According to American Fuel and Petrochemical Manufacturers (“AFPM”), a trade association representing the US refiners, global refining capacity fell by 3.3 mmbpd since 2020. Approximately 1/3 of this reduction in capacity was in the U.S., as old refineries were converted to produce renewable fuel or were shuttered due to poor profitability and tightening regulations. This represents almost 6% of the U.S. refining capacity of 19 mmbpd at the beginning of 2020.
In general, less capacity means existing refineries must run at higher utilizations and crack spreads.
Furthermore, as we mentioned above, Russian sanctions took out an important global exporter of oil and petroleum products. As Russian sanctions are unlikely to be lifted in the medium term, we can expect western countries, particularly Europe, to be short on refined products such as gasoline.
Finally, due to alleged fuel supply concerns, China has decided to drastically reduce refined fuel exports for 2022. Therefore, it appears likely that refiner margins are expected to remain elevated in the medium term.
Financials Should Beat Analyst Forecasts
However, Wall Street appears to expect elevated earnings to be short-lived, as it forecast DINO to earn $10.52 per share in 2022 but only $5.90 per share in 2023 (Figure 8). This compares to EPS of $3.39 in 2021 and a loss of ($3.72) in 2020. Note, historical EPS figures are not entirely comparable as DINO acquired the 149,000 bpd Puget refinery in November of 2021 and also completed the Sinclair acquisition in March of this year.
Figure 8 – Analyst estimates are modest (tikr.com)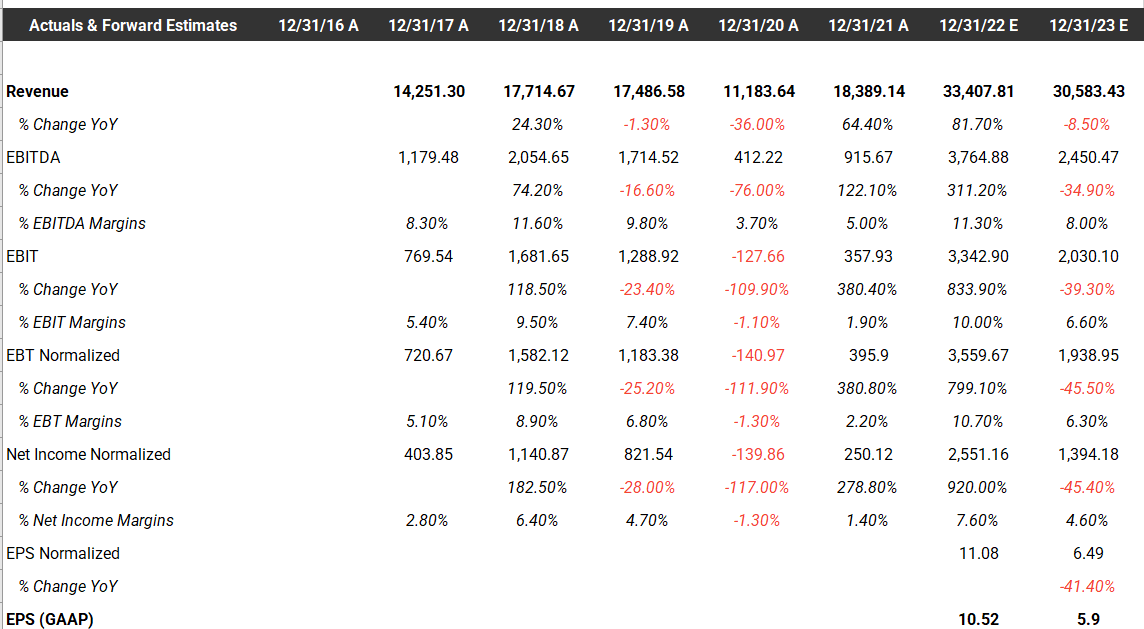
In fact, I think Wall Street estimates are overly cautious with respect to DINO. In Figure 9 below, we can see that management expects DINO to generate approximately $2.6 billion in consolidated mid-cycle EBITDA. Given almost $1 billion of the EBITDA figure is from the midstream, renewable diesel, and lubricant businesses, one can argue that Wall Street’s estimates of $3.8 billion in 2022 EBITDA is only assuming a crack spread of ~$20 per barrel (backed into using the conservative scenario in Figure 7).
Figure 9 – Mid cycle Adjusted Earnings (DINO investor presentation)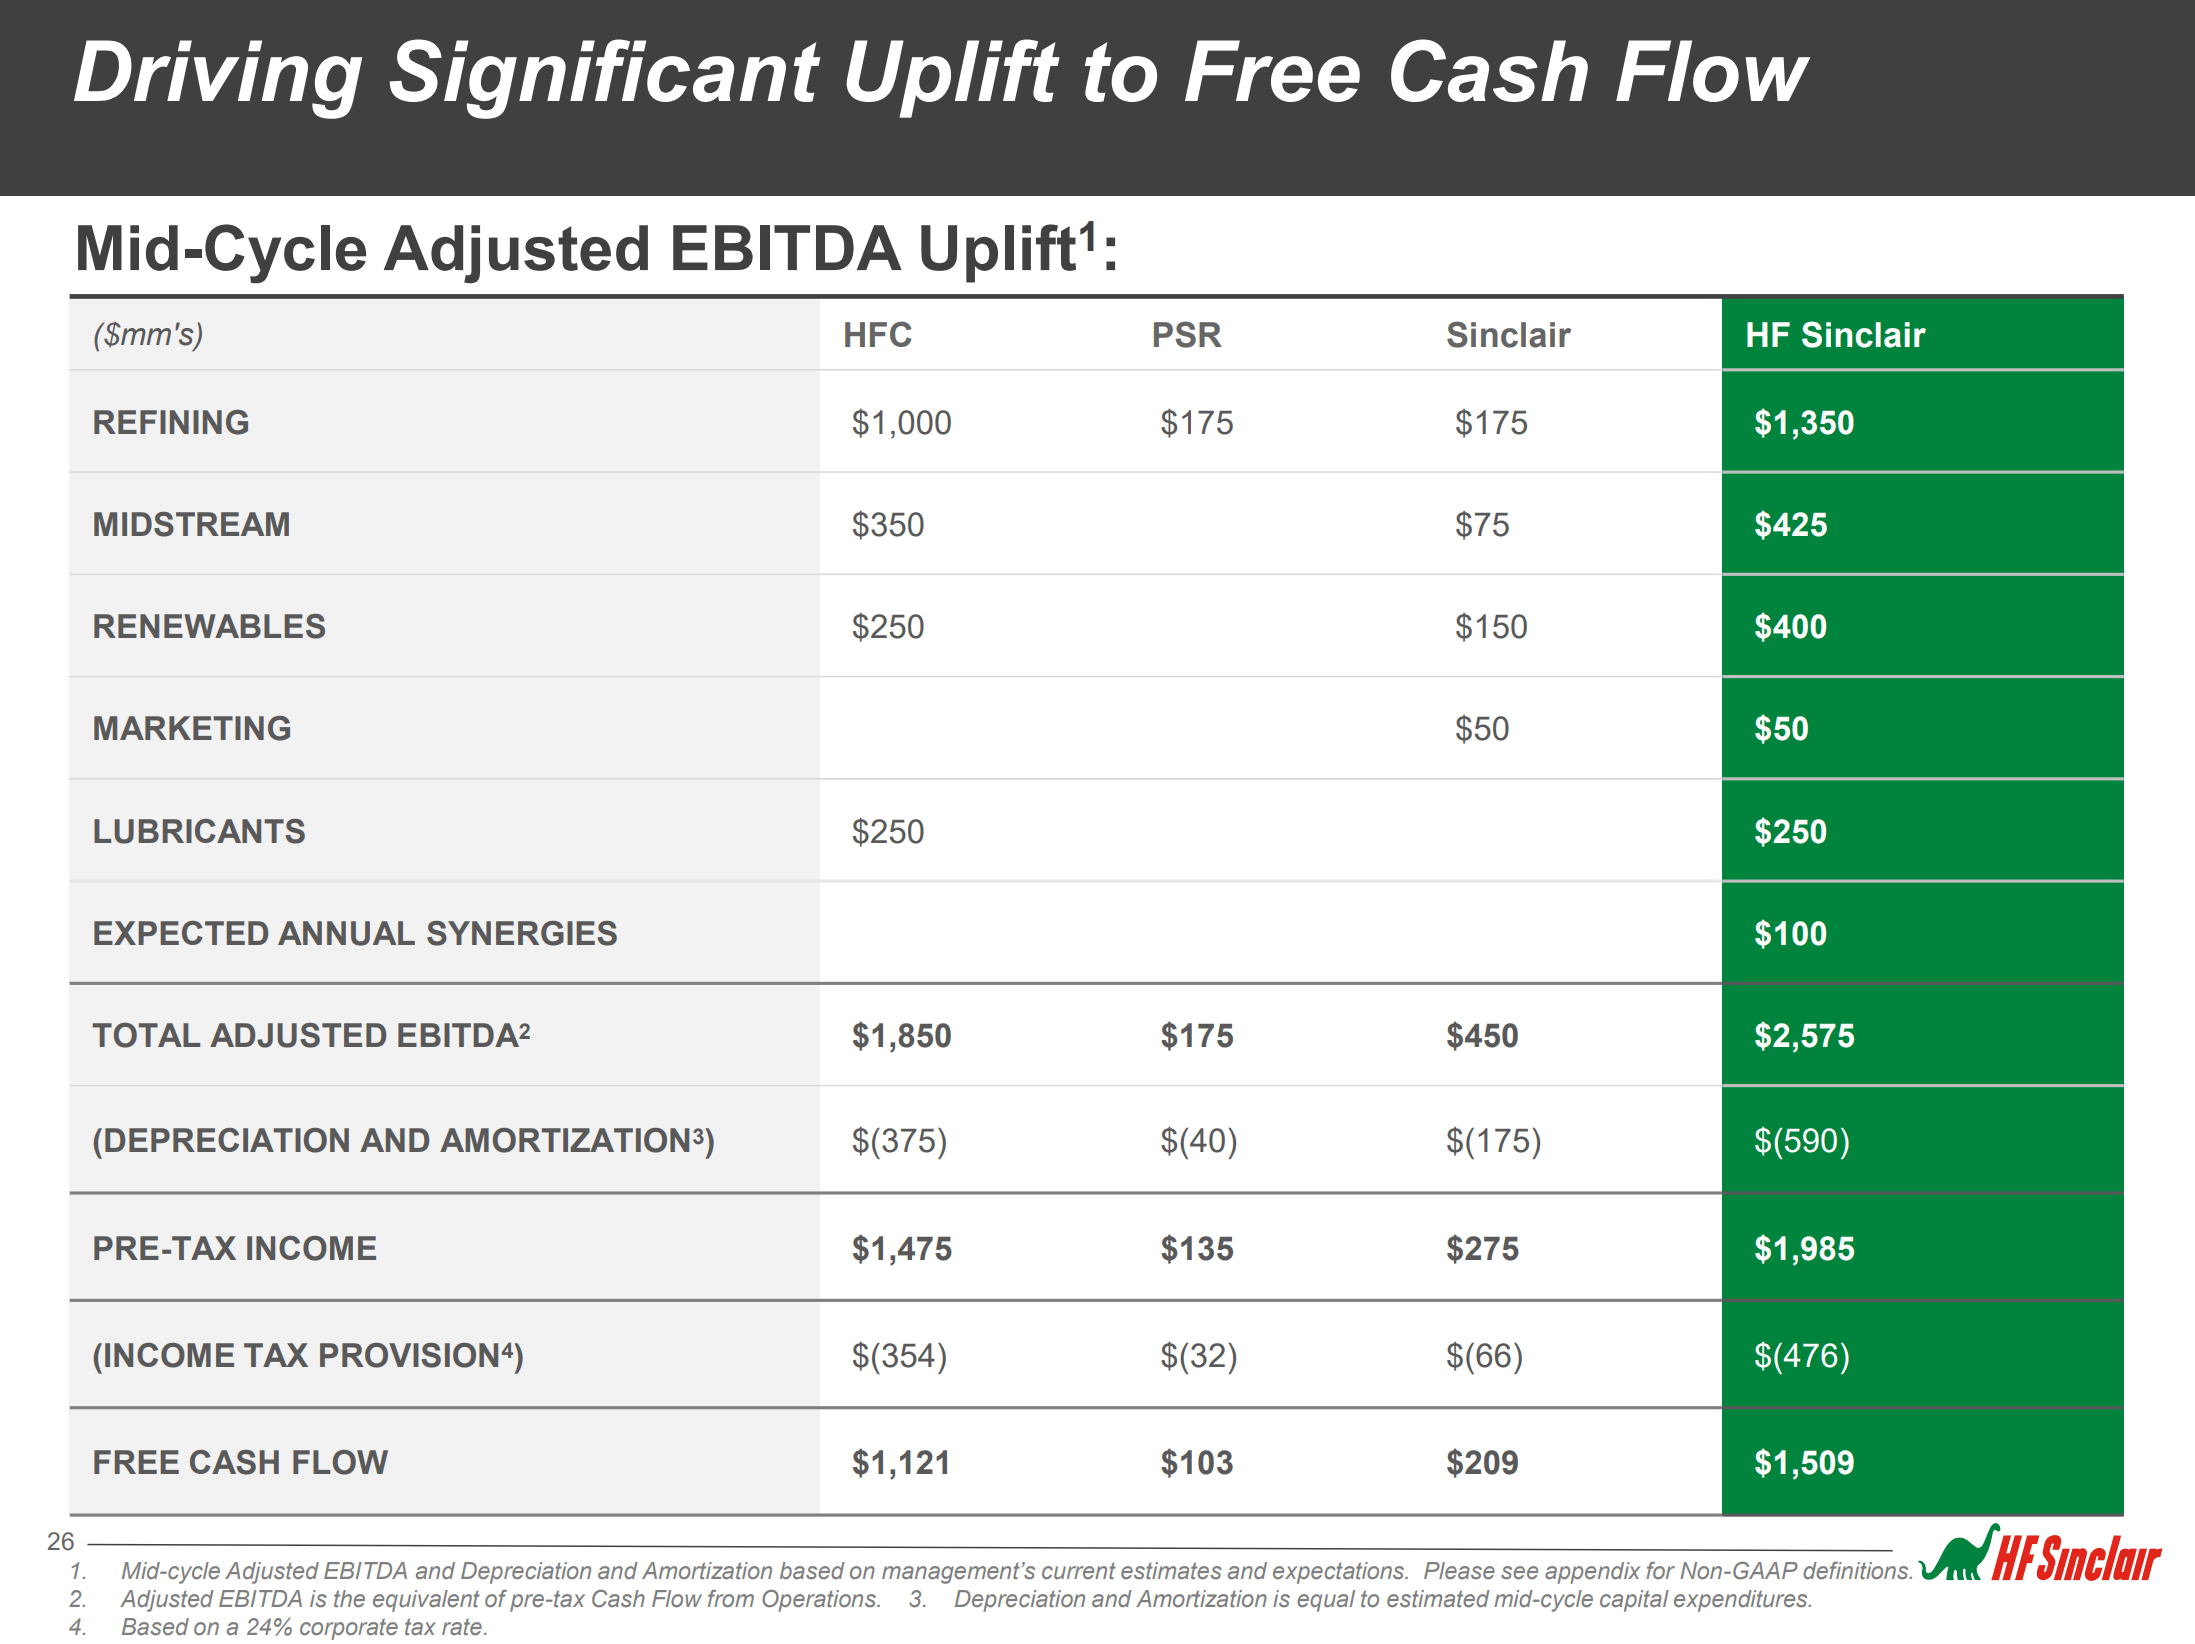
With half the year already over and average crack spreads over $30 YTD (Figure 10), it will take a steep collapse in the second half of the year for HF Sinclair to not average greater than $20 crack spreads for 2022. In addition, analyst estimates for 2023 appear to be based on mid-cycle crack spreads of $10, since analysts are only expecting consolidated EBITDA of $2.5 billion, which is the mid-cycle EBITDA figure provided by management. This mid-cycle figure does not account for the potential for tight refining margins to extend beyond 2022.
Figure 10 – DINO posted monthly refining index (DINO investor relations website)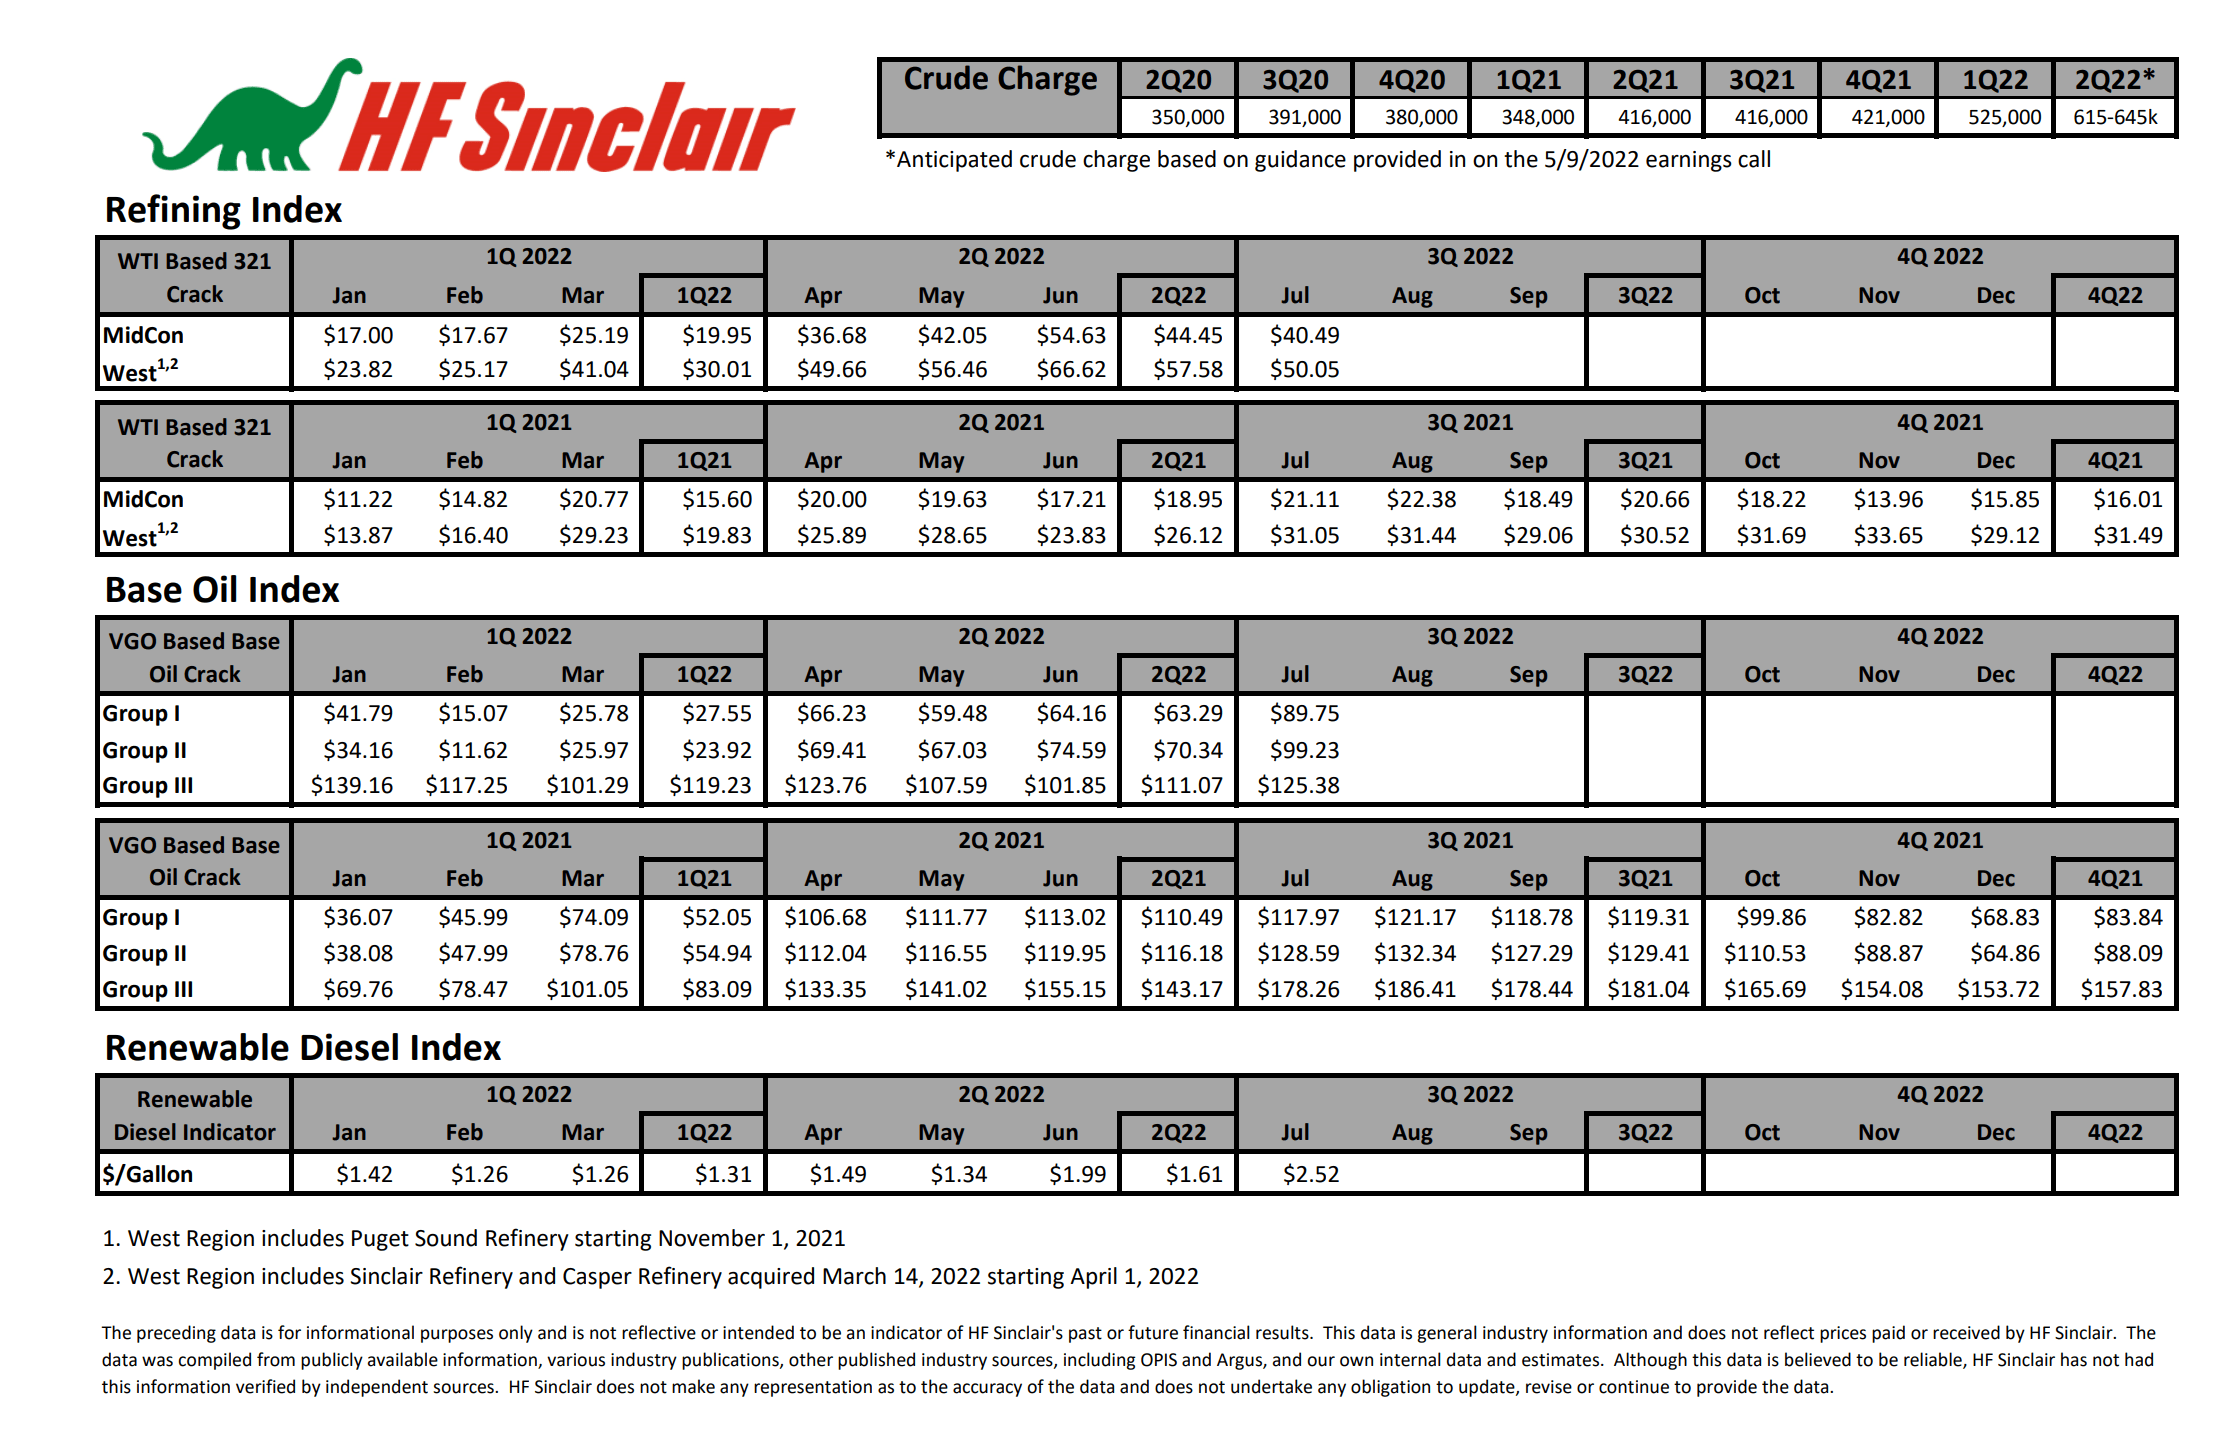
Valuation Attractive Vs. Peers
Given DINO’s current windfall profits from elevated refiner margins, it is no surprise that the stock trades at a low P/E valuation, at 4.3x 2022 P/E. However, we believe this figure is simply too low given the high likelihood that DINO will beat analyst estimates on the earnings front.
Furthermore, if we compare DINO to its refiner peers, we see that it trades at the low end of valuations, with the peer group trading at an average 5.0x 2022 P/E and 9.9x 2023 P/E versus 4.3x and 7.3x for DINO.
Figure 11 – DINO peers (Seeking Alpha)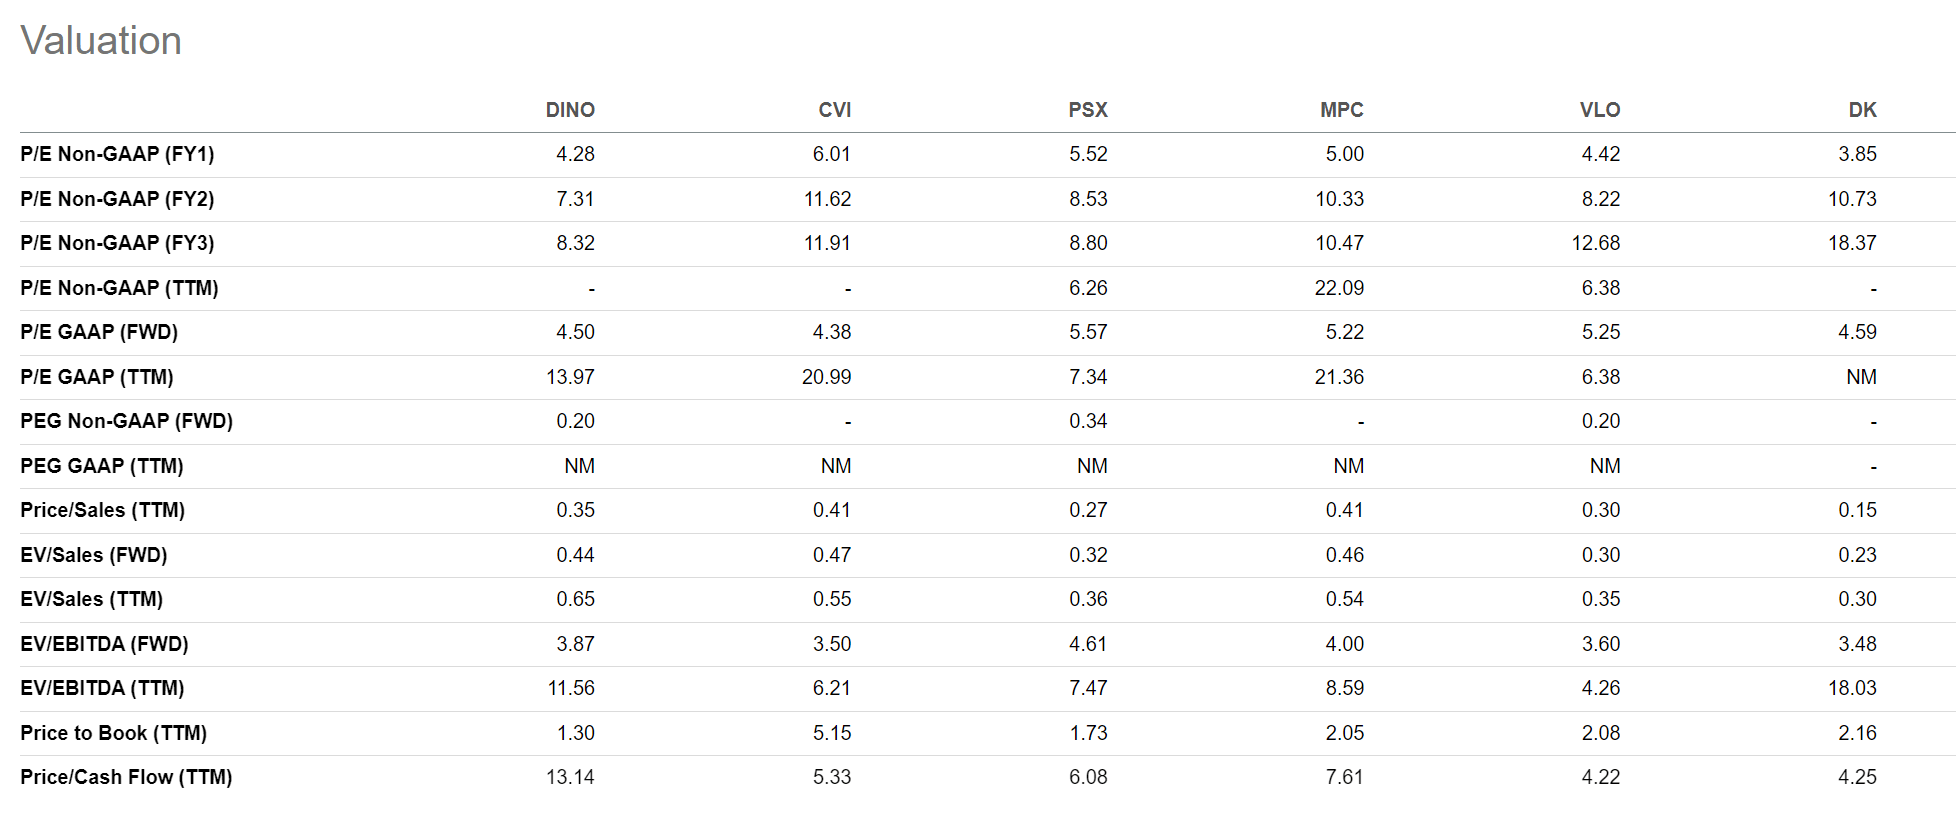
Capital Returns Could Be Significant
With the release of its Q1 earnings, HF Sinclair reinstated its quarterly dividend at $0.40 per quarter and committed to returning $1 billion to shareholders over the next 12 months. Given the expected windfall earnings in 2022, we could see an acceleration of capital returns to shareholders. In the long-term, management expects to return 50% of earnings to shareholders via dividends and repurchases (Figure 12).
Figure 12 – DINO capital allocation strategy (DINO investor presentation)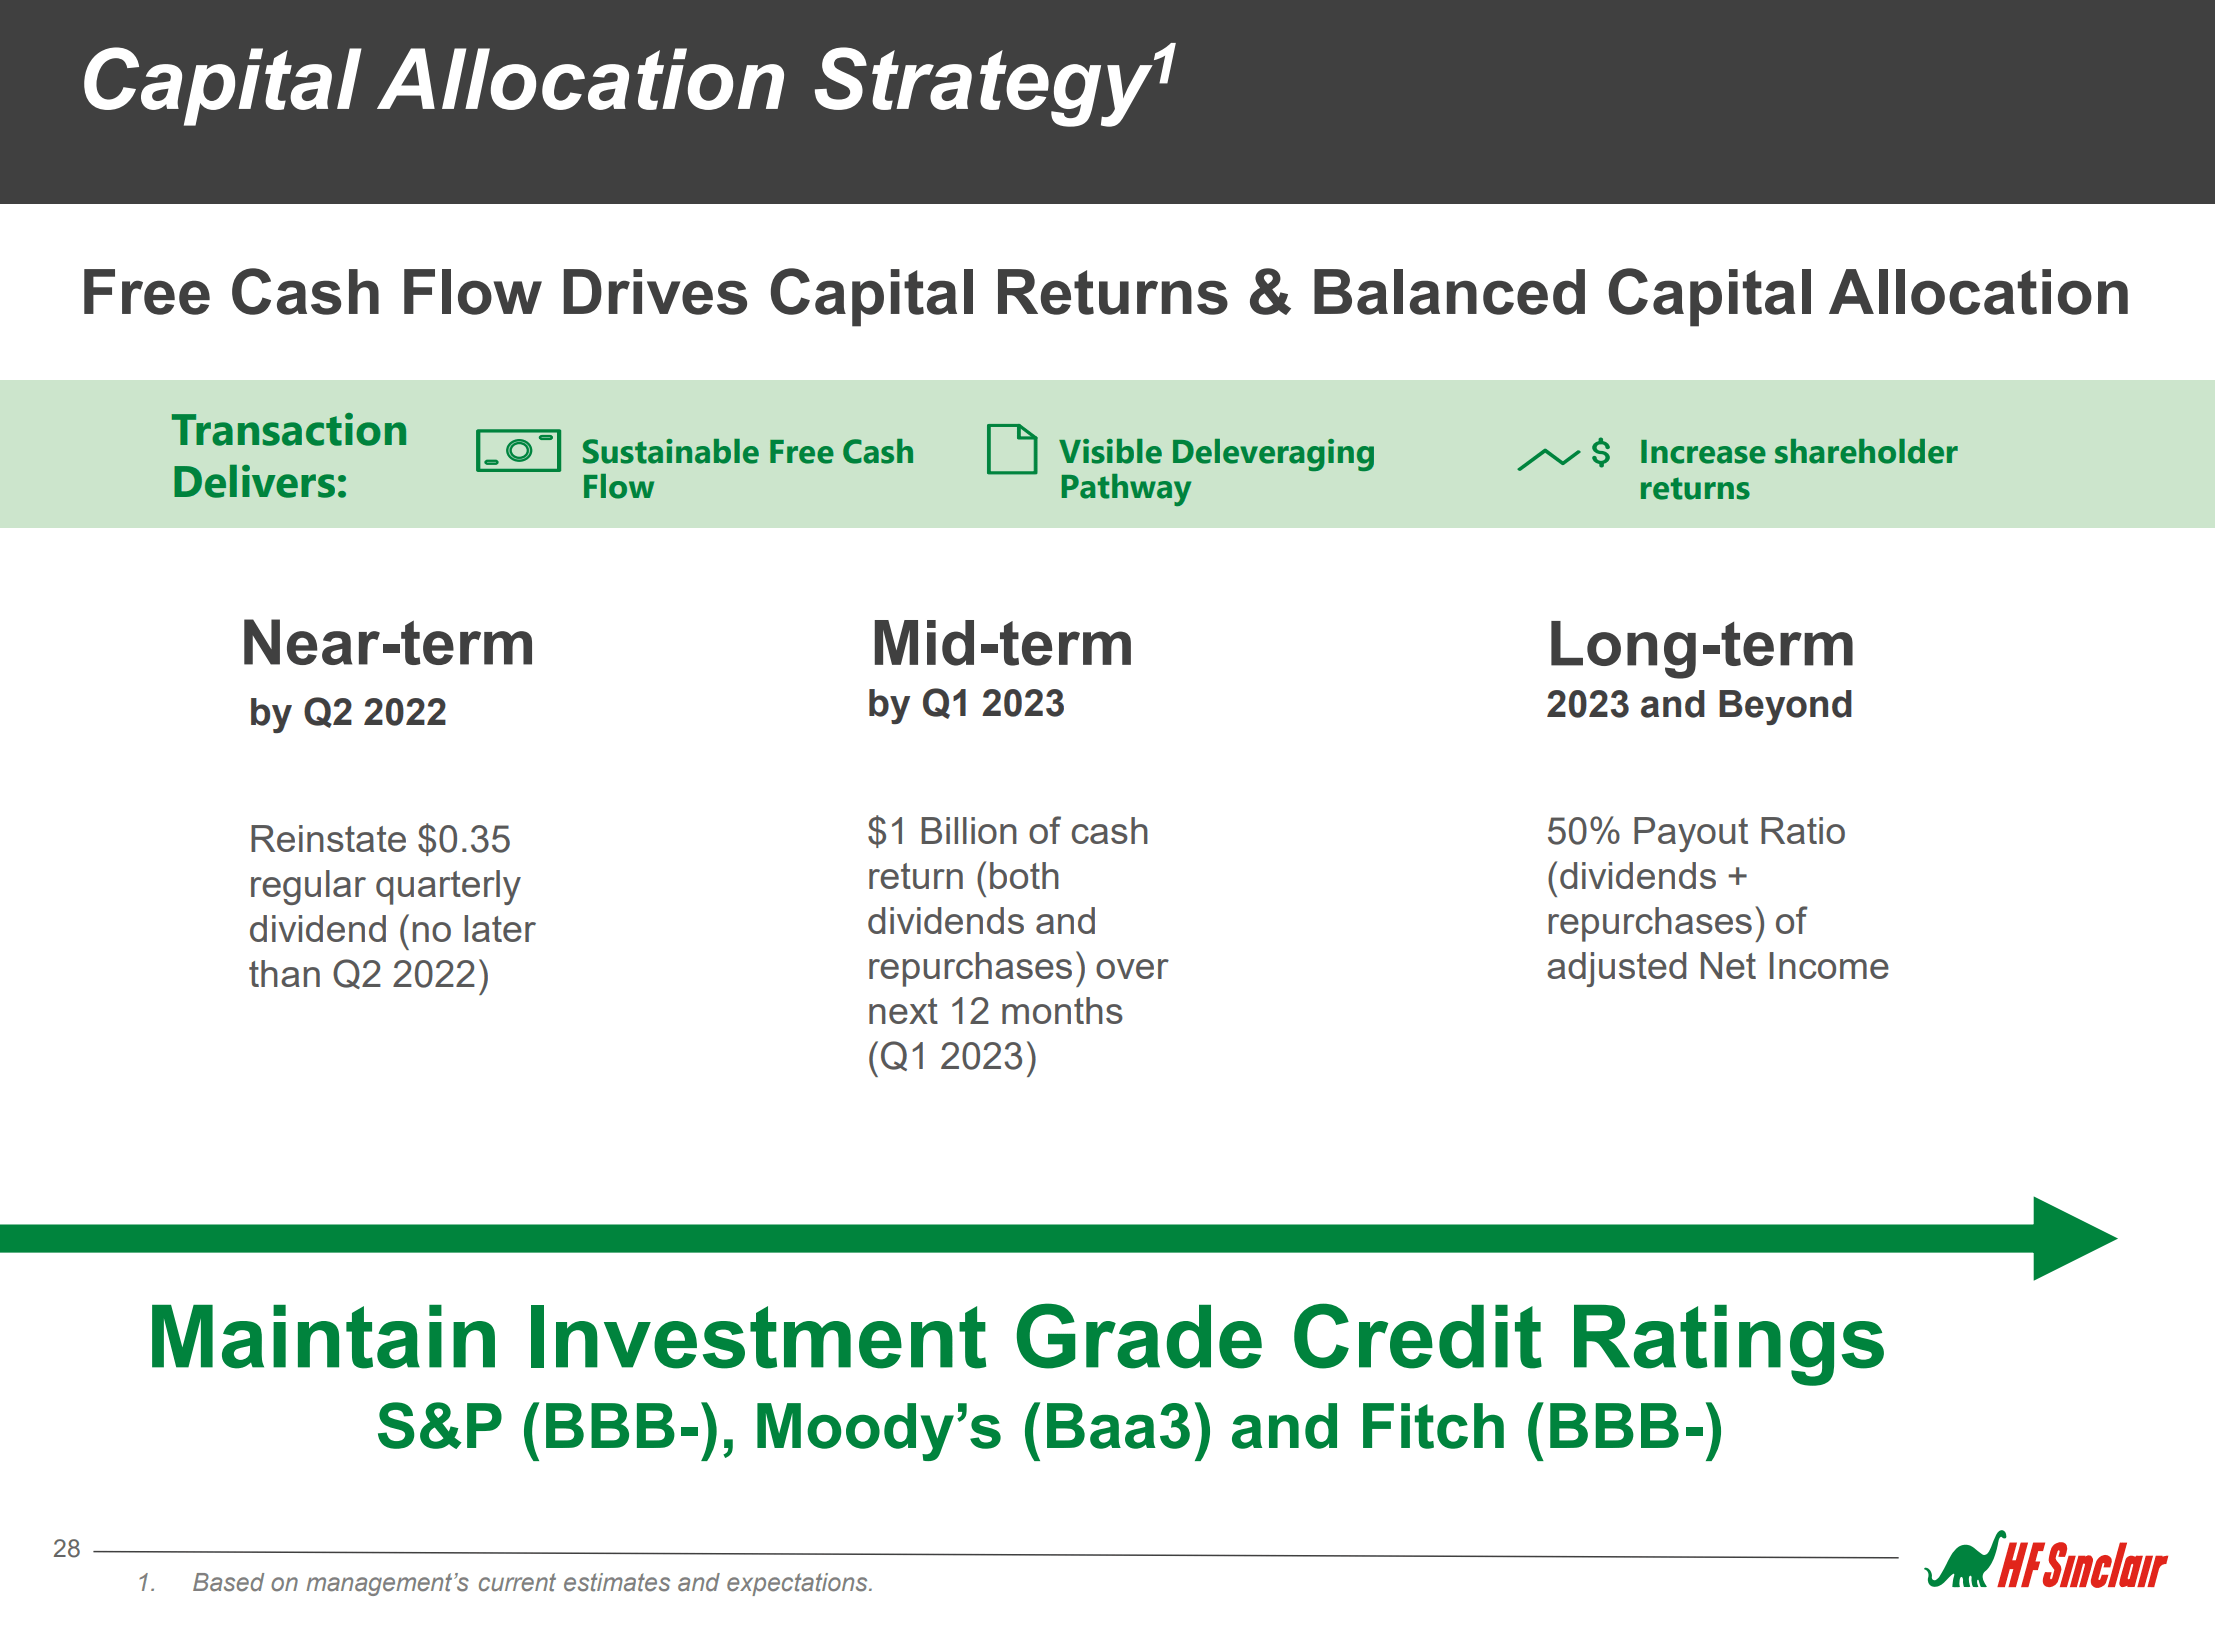
Risks To HF Sinclair
The major risk to HF Sinclair is a collapse in refining margins, perhaps on the back of the economy entering a recession. The risk is mitigated somewhat by the U.S. domestic refinery shutdowns in the past 2 years, which means U.S. fuel supply/demand is tighter. Also, there are the Russian sanctions and Chinese export decrease supporting refining margins.
Another risk to DINO is its relatively high levels of debt. To acquire the Puget refinery and Sinclair Oil, DINO moderately levered its balance sheet, with $3.4 billion of long-term debt as of March 31, 2022. High levels of debt may constrain management’s flexibility, especially if credit markets seize up and the company is not able to refinance maturing debt at favorable rates.
Technical
Technically, HF Sinclair’s stock suffered a steep pullback from June highs of $58.50. However, it held breakout levels at $42 and recently triggered a mechanical MACD buy signal (Figure ).
Figure 13 – DINO held $42 support (Author created with price chart from stockcharts.com)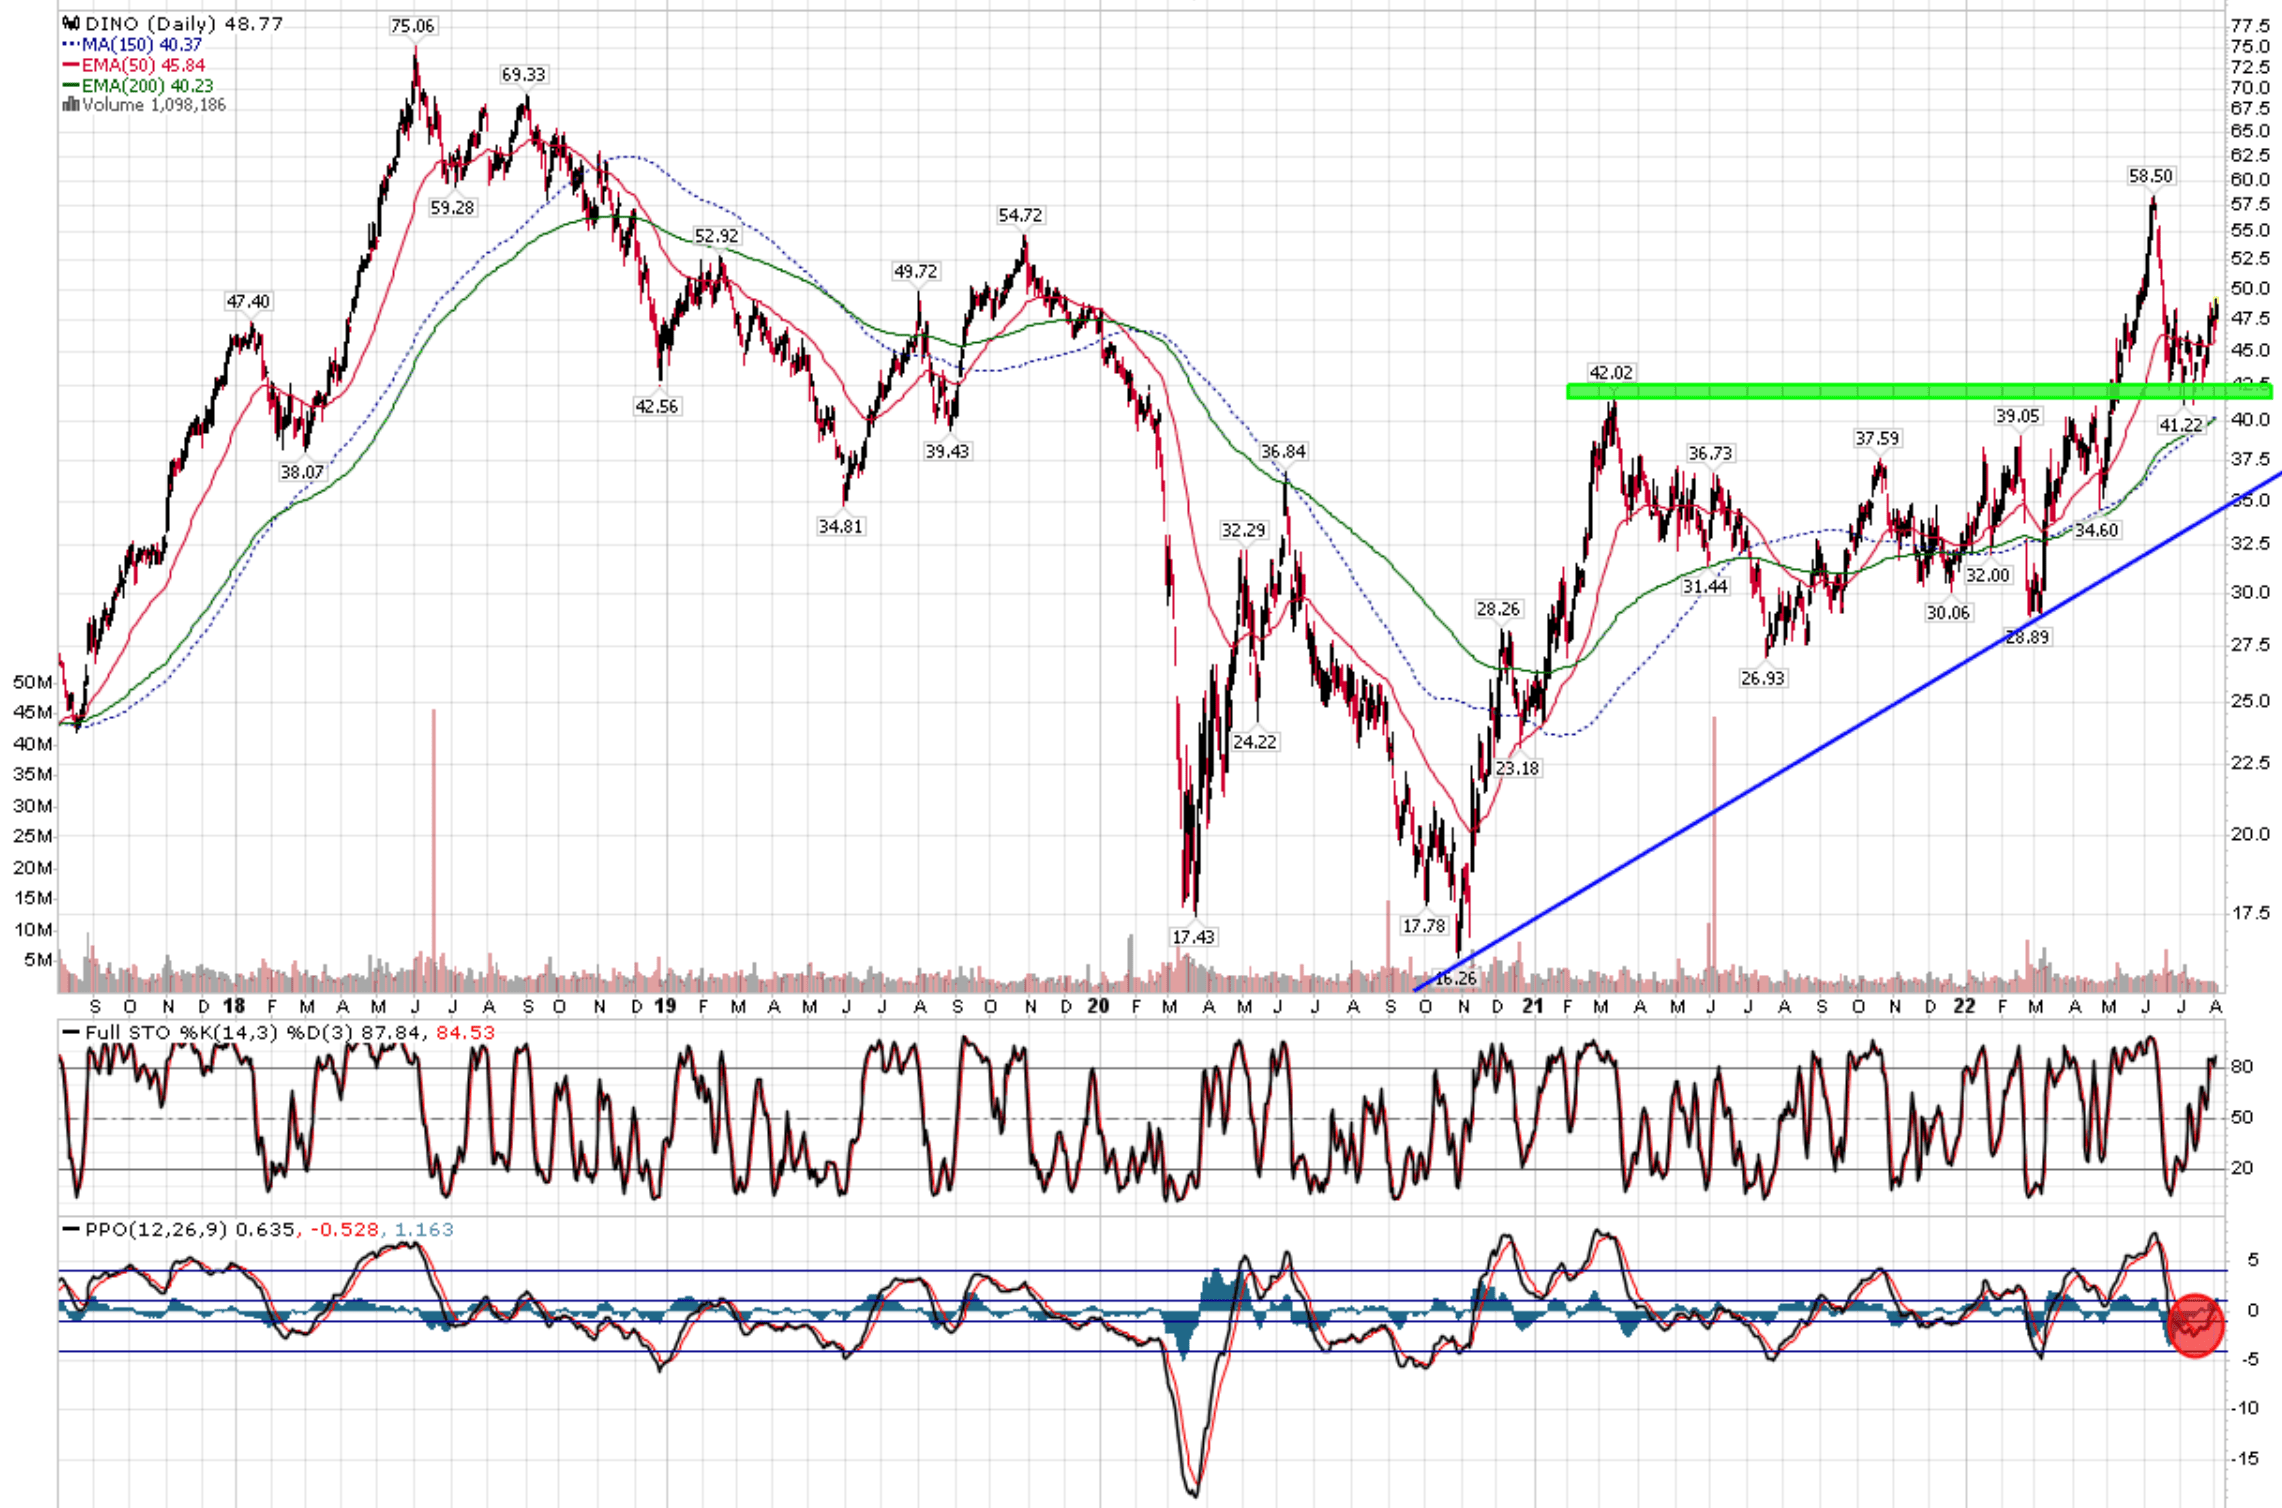
Conclusion
In summary, HF Sinclair is an interesting name that investors can accumulate as a hedge against high retail energy prices. I expect refining margins to remain elevated for 2022 and 2023, potentially generating windfall capital returns. HF Sinclair trades at a modest discount to its refiner peers and sports a 3.4% dividend yield.
Be the first to comment