

Takako Hatayama-Phillips
Earnings of Heritage Commerce Corp (NASDAQ:HTBK) will likely continue to grow this year thanks to the rising interest-rate environment and a highly rate-sensitive net interest margin. Further, subdued loan growth will likely boost the bottom line. On the other hand, provision normalization amid headwinds will likely limit earnings growth. Overall, I’m expecting Heritage Commerce to report earnings of $0.89 per share for 2022, up 13.7% year-over-year. Compared to my last report on Heritage Commerce, I’ve tweaked upwards my earnings estimate mostly because I’ve increased my net interest margin estimate. The year-end target price suggests a high upside from the current market price. Based on the total expected return, I’m upgrading Heritage Commerce to a buy rating.
California’s Economy To Play Pivotal Role In Loan Growth
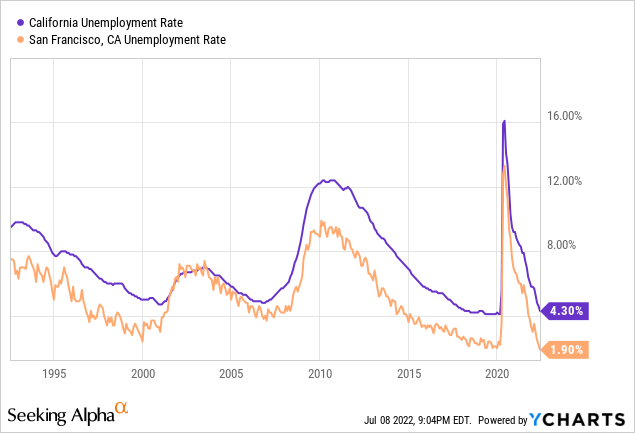
After growing strongly through most of 2021, the loan portfolio declined by 2.1% during the first quarter of 2022. The portfolio will likely resume its upward trend in the remainder of 2022 thanks to certain economic factors. Heritage Commerce operates in California, with concentration in the San Francisco Bay area, where the job market has continued to go from strength to strength and has yet to show any signs of slowing. The state’s unemployment rate is currently near multi-decade lows, as shown below. The labor market’s strength bodes well for loan demand in the year ahead.
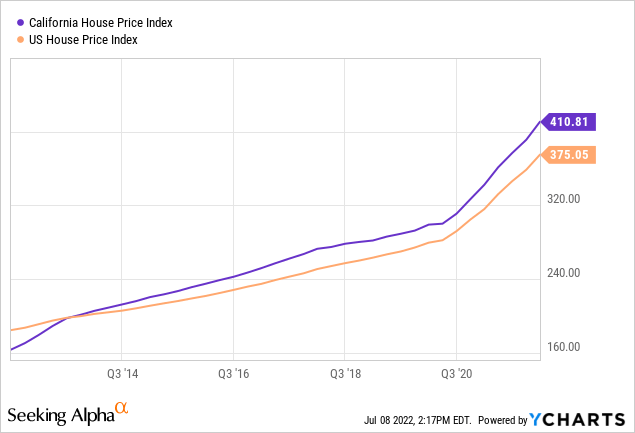
On the flip side, Heritage Commerce has an extremely large cash balance on its books, which raises questions over the management’s ability to deploy it into loans. Further, the heightened interest rates are likely to dampen demand for credit products. Moreover, house prices in California have had a steeper growth in the last year than the national average, as seen below. The sharp rise in house prices, combined with high interest rates, can dampen the demand for residential mortgages.
Considering these factors, I’m expecting the loan book to increase by 1.7% by the end of December 2022 from the end of 2021. In my last report on Heritage Commerce, I projected loan growth of 5.1%. I’ve now reduced my loan estimate because of the poor performance in the first quarter and a deterioration in the loan growth outlook.
Meanwhile, deposits will likely grow mostly in line with loans for the last three quarters of 2022. The following table shows my balance sheet estimates.
| FY17 | FY18 | FY19 | FY20 | FY21 | FY22E | ||
| Financial Position | |||||||
| Net Loans | 1,563 | 1,859 | 2,511 | 2,575 | 3,044 | 3,094 | |
| Growth of Net Loans | 5.4% | 18.9% | 35.1% | 2.6% | 18.2% | 1.7% | |
| Other Earning Assets | 1,078 | 973 | 1,180 | 1,635 | 2,054 | 2,114 | |
| Deposits | 2,483 | 2,638 | 3,415 | 3,914 | 4,759 | 4,868 | |
| Borrowings and Sub-Debt | 39 | 39 | 40 | 40 | 40 | 42 | |
| Common equity | 271 | 367 | 577 | 578 | 598 | 619 | |
| Book Value Per Share ($) | 7.0 | 8.7 | 12.0 | 9.6 | 9.9 | 10.2 | |
| Tangible BVPS ($) | 5.7 | 6.4 | 8.1 | 6.5 | 6.9 | 7.2 | |
|
Source: SEC Filings, Author’s Estimates (In USD million unless otherwise specified) |
|||||||
High Rate Sensitivity to Boost Net Interest Income
Heritage Commerce’s net interest margin is highly sensitive to interest rate changes. The results of the management’s interest-rate sensitivity analysis show that a 200-basis points increase in interest rates can boost the net interest income by a whopping 17.4% over twelve months.
Heritage Commerce has a very large cash and cash equivalents balance, which totaled $1.2 billion at the end of March 2022, representing 22% of total assets. While the bloated cash balance gives Heritage the opportunity to quickly improve its asset mix and benefit from rising rates, it also raises concerns over the management’s capabilities to seize such opportunities.
In case Heritage Commerce is unable to grab the opportunity to improve its asset mix, the company can still benefit from rising rates, albeit to a much lower degree. The yield curve has shifted upwards, which means Heritage can earn greater income on its cash balances. However, this incremental income will be much below the income foregone by maintaining a sub-optimal asset mix.
The U.S. Treasury Department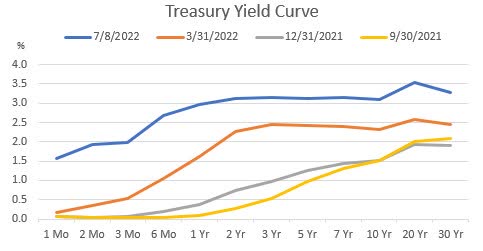
Considering these factors, I’m expecting the margin to increase by 35 basis points in the last three quarters of 2022 from 3.05% in the first quarter of the year. Compared to my last report on Heritage Commerce, I have significantly increased my margin estimate mostly because my interest rate outlook is now more hawkish than before.
Provisioning Likely To Normalize After Material Provision Reversals
Heritage Commerce reported a net provision reversal of $0.6 million for the first quarter of 2022, which was the sixth consecutive quarter of net provision reversals. I’m expecting provisioning to normalize in the last three quarters of 2022 due to the following factors.
- Loan Additions. The anticipated loan growth discussed above will require additional provisioning for expected loan losses.
- High interest rates. Higher borrowing costs will hurt borrowers’ financial strength and could push some of the borrowers into default.
- Threats of recession. I don’t believe we’ll see a recession, but the management may want to bolster its loan loss reserves just in case.
Overall, I’m expecting the provision expense to return to a normal level during the last three quarters of 2022. However, combined with the first quarter’s net provision reversals, the full-year net provision expense will likely be below normal. I’m expecting the net provision expense to make up 0.10% of total loans in 2022. In comparison, the net provision expense averaged 0.15% of total loans from 2017 to 2019.
Expecting Earnings To Increase by 13.7%
The anticipated jump in the net interest margin will likely be the chief driver of earnings this year. Subdued loan growth will also contribute toward earnings growth. On the other hand, the anticipated provision normalization will likely limit the increase in earnings. Overall, I’m expecting Heritage Commerce to report earnings of $0.89 per share for 2022, up 13.7% year-over-year. The following table shows my income statement estimates.
| FY17 | FY18 | FY19 | FY20 | FY21 | FY22E | ||
| Income Statement | |||||||
| Net interest income | 102 | 122 | 132 | 142 | 146 | 166 | |
| Provision for loan losses | 0 | 7 | 1 | 13 | (3) | 3 | |
| Non-interest income | 10 | 10 | 10 | 10 | 10 | 10 | |
| Non-interest expense | 61 | 76 | 85 | 90 | 93 | 97 | |
| Net income – Common Sh. | 24 | 35 | 40 | 35 | 48 | 54 | |
| EPS – Diluted ($) | 0.62 | 0.84 | 0.84 | 0.59 | 0.79 | 0.89 | |
|
Source: SEC Filings, Earnings Releases, Author’s Estimates (In USD million unless otherwise specified) |
|||||||
In my last report in Heritage Commerce, I estimated earnings of $0.83 per share for 2022. I’ve tweaked up my earnings estimate mostly because I’ve revised upwards my net interest margin estimate.
Actual earnings may differ materially from estimates because of the risks and uncertainties related to inflation, and consequently the timing and magnitude of interest rate hikes. Further, the threat of a recession can increase the provisioning for expected loan losses beyond my expectation.
Upgrading To A Buy Rating
Heritage Commerce is offering a dividend yield of 4.7% at the current quarterly dividend rate of $0.13 per share. The earnings estimate and current dividend suggest a payout ratio of 58% for 2022, which is the same as the average from 2017 to 2019. Heritage Commerce has maintained its dividend at $0.13 per share since 2020. Given the payout ratio, now doesn’t seem like a good time to return to the pre-pandemic trend of annual dividend hikes. Therefore, I’m expecting Heritage to maintain its dividend at $0.13 per share for the remainder of this year.
I’m using the historical price-to-tangible book (“P/TB”) and price-to-earnings (“P/E”) multiples to value Heritage Commerce. The stock has traded at an average P/TB ratio of 1.72 in the past, as shown below.
| FY18 | FY19 | FY20 | FY21 | Average | ||
| T. Book Value per Share ($) | 6.4 | 8.1 | 6.5 | 6.9 | ||
| Average Market Price ($) | 15.7 | 12.3 | 8.3 | 11.2 | ||
| Historical P/TB | 2.44x | 1.52x | 1.28x | 1.63x | 1.72x | |
| Source: Company Financials, Yahoo Finance, Author’s Estimates | ||||||
Multiplying the average P/TB multiple with the forecast tangible book value per share of $7.2 gives a target price of $12.4 for the end of 2022. This price target implies a 12.8% upside from the July 8 closing price. The following table shows the sensitivity of the target price to the P/TB ratio.
| P/TB Multiple | 1.52x | 1.62x | 1.72x | 1.82x | 1.92x |
| TBVPS – Dec 2022 ($) | 7.2 | 7.2 | 7.2 | 7.2 | 7.2 |
| Target Price ($) | 10.9 | 11.6 | 12.4 | 13.1 | 13.8 |
| Market Price ($) | 11.0 | 11.0 | 11.0 | 11.0 | 11.0 |
| Upside/(Downside) | (0.3)% | 6.3% | 12.8% | 19.4% | 26.0% |
| Source: Author’s Estimates |
The stock has traded at an average P/E ratio of around 15.5x in the past, as shown below.
| FY18 | FY19 | FY20 | FY21 | Average | ||
| Earnings per Share ($) | 0.84 | 0.84 | 0.59 | 0.79 | ||
| Average Market Price ($) | 15.7 | 12.3 | 8.3 | 11.2 | ||
| Historical P/E | 18.8x | 14.6x | 14.2x | 14.2x | 15.5x | |
| Source: Company Financials, Yahoo Finance, Author’s Estimates | ||||||
Multiplying the average P/E multiple with the forecast earnings per share of $0.89 gives a target price of $13.8 for the end of 2022. This price target implies a 26.2% upside from the July 8 closing price. The following table shows the sensitivity of the target price to the P/E ratio.
| P/E Multiple | 13.5x | 14.5x | 15.5x | 16.5x | 17.5x |
| EPS – 2022 ($) | 0.89 | 0.89 | 0.89 | 0.89 | 0.89 |
| Target Price ($) | 12.0 | 12.9 | 13.8 | 14.7 | 15.6 |
| Market Price ($) | 11.0 | 11.0 | 11.0 | 11.0 | 11.0 |
| Upside/(Downside) | 9.9% | 18.0% | 26.2% | 34.3% | 42.5% |
| Source: Author’s Estimates |
Equally weighting the target prices from the two valuation methods gives a combined target price of $13.1, which implies a 19.5% upside from the current market price. Adding the forward dividend yield gives a total expected return of 24.3%.
In my last report, I adopted a hold rating on Heritage Commerce. Since then, the stock price has plunged, leaving a good upside to the target price. Further, I have tweaked upwards my target price for December 2022, which has also increased the upside. Based on the total expected return, I’m upgrading Heritage Commerce to a buy rating.
Be the first to comment