

cemagraphics
The S&P 500 (NYSEARCA:SPY/ SP500) has gradually climbed more than 12% since the fourth quarter began, and closed at a two-month high during Wednesday’s (November 23) session after a flurry of economic data released in recent weeks pointed to easing price pressures and market slowdown that could harbinger a dovish Fed policy stance over coming months. October CPI and PPI showed a stronger reduction in prices than expected, while recent data on jobless claims, retail sales, and business activity also pointed to a slowdown in demand, especially for discretionary goods.
Despite hawkish commentary from Fed officials still, investors are responding positively to remarks that the pace of rate hikes might be moderating from the recent slew of jumbo 75 bps increases. This has compounded market optimism on a potential shift on the Fed’s policy tightening trajectory to a more dovish stance, with investors’ now focusing more on a potential slowdown in the pace of coming rate hikes than where the terminal rate might land (i.e. when the Fed might actually pivot).
But from a valuation and fundamental perspective, continued rate hikes are poised to squeeze multiples further into contraction, while ensuing deteriorating of financial conditions put corporate earnings at risk. With slowing demand, and mounting macroeconomic uncertainties over the Fed’s tightening trajectory, when inflation would peak, and whether a recession is imminently still at large, volatility will likely continue to overpower markets. While it is difficult to gauge when exactly markets might bottom as macro deterioration gains momentum, the following analysis will turn to past tightening cycles and inflation environments, as well as basic valuation theory to explore where the market climate stands today and what to potentially expect over coming months.
Recent Economic Overview
The drumbeat for moderating inflation grew after CPI and PPI figures came in lower than expected. October CPI rose 7.7% y/y and 0.4% m/m (core +6.3% y/y, +0.3% m/m), marking the “smallest annual advance since the start of the year” and coming in under economist estimates of 7.9% y/y and 0.6% m/m. U.S. PPI also eased in October, advancing 8% y/y (core +6.7% y/) and 0.2% m/m (core 0% m/m) compared with economist estimates of 8.3% y/y and 0.4% m/m. The back-to-back indication of easing price pressures pushed the S&P 500 higher in early November, as markets saw it as an encouraging sign that the Fed might resort to less aggressive tightening in the months ahead and potentially achieve a soft-landing that could be beneficial to the valuation of risky assets that have been roiled across the board this year.
But investors were quickly sent back to the sidelines after stronger-than-expected U.S. retail sales data for October indicated that the economy was still running hot, while Fed officials rushed to warn markets that “inflation remains much too high for comfort” and there is “still a long way to go” on keeping decades-high price increases under control. But a deeper look into the drivers of retail sales increases would suggest that consumer purchasing power is starting to feel the pinch of both rising inflation and interest rates, and the volume of sales is likely deteriorating too since the October figure of 1.3% is not adjusted for inflation.
As discussed in one of our recent coverages, the biggest driver of October’s retail sales growth was on basic necessities like food and energy. Meanwhile, spending on discretionary goods like consumer electronics and apparel saw a marked decline, indicating that consumer purchasing power is waning on the back of surging inflation and tightening financial conditions:
Meanwhile, retailers of discretionary goods such as apparel, consumer electronics, and sporting goods saw a sales decline of more than 2% over the same period. The results imply continued weakening in consumer purchasing power as inflationary pressures persist, while retailers of discretionary goods are looking to lure buyers ahead of the holiday shopping season with price cuts and steep discounts in an attempt to clear inventories.
Source: “2 Retail Stocks to Watch After Retail Sales Rose in October – We are Watching Amazon and Apple“
The shift in consumer behavior in response to mounting macroeconomic uncertainties ahead is also telling of the impending demand slowdown over coming months. Consumer credit card debt is fast approaching the pre-pandemic peak of $916 billion as of the end of September, and the continuation of this trend is further corroborated by recent observations by retailer Macy’s (M), which saw its customers “building larger balances on credit cards”. The latest data shows that Americans’ credit card debt has increased by 15% y/y, the fastest pace in two decades while card borrowing costs topped 19%, a level not seen in 40 years.
The impending slowdown in demand and spending is further supported by the recent rise in jobless claims and contraction in business activity. U.S. jobless claims topped 240,000 during the week ended November 19th, topping consensus estimates of 225,000 and up from 17,000 in the prior week. The jump was the highest in months, a potential sign that the labor market might be cooling as a result of recent mass layoffs across big tech, though economists are also cautioning effects of seasonal attrition, which introduces a “great deal of volatility into this data”. The U.S. job market has remained stubbornly resilient despite the Fed’s implementation of aggressive tools to slow the economy this year, with the jobless rate still at a 50-year low of 3.7%:
Tech companies represent about 2% of all employment in the country, said Richardson. That compares with 11% for the leisure and hospitality industry, which is still struggling to hire workers, she added.
Source: Bloomberg
The broad takeaway is a job market that’s cooling albeit not very quickly. That lines up with Jerome Powell’s characterization earlier this week, when the Fed chair acknowledged conditions haven’t softened yet in an “obvious” way and said the central bank is eyeing a higher peak interest rate than it was two months ago.
Source: Bloomberg
But added softness in business activity indicates that even “some of the more resilient parts of the economy” are undoubtedly showing cracks as a result of the Fed’s aggressive policy stance deployed this year. The S&P Global Flash U.S. Composite PMI, which measures activity across the American private sector, saw a “solid contraction” this month. The index reached the “second lowest level” since the onset of the pandemic and imitates the dire business environment in 2009. Managers reported slowing demand and new orders due to the effects of “rising interest rates, economic uncertainty and the lingering effects of still elevated inflation”. Consistent with commentary gathered in the latest third quarter earnings season, promotional offers are gaining momentum across suppliers, factories and service providers to “help boost flagging sales”, which is poised to weigh on private sector earnings over coming months.
Although easing inflationary pressures is a welcomed sight, recent data points to rapid unravelling of an economy that is likely headed towards recession. Minutes from the FOMC meeting in November indicated that policymakers are now seeing a 50/50 risk of recession within the next year, compared with a more aggressive forecast of 65% on Wall Street and as much as 100% by a Bloomberg Economics model.
What the Fed Says
Amidst the paradox between recent market optimism and a rapidly deteriorating macro backdrop, the Federal Reserve is sticking to its hawkish policy stance in hopes of preventing an unravelling of the work done to date to quell inflation. Recall Fed Chair Jerome Powell’s stern remarks on managing market expectations during the post-meeting conference in November:
CHRISTOPHER RUGABER. Great, and just a quick follow. It looks like stock and bond markets are reacting positively to your announcement so far. Is that something you wanted to see? Is that a problem or what-how that might affect your future policy to see this positive reaction?
CHAIR POWELL. We’re not targeting any one or two particular things. Our message should be-what I’m trying to do is make sure that our message is clear, which is that we think we have a ways to go, we have some ground to cover with interest rates before we get to, before we get to that level of interest rates that we think is sufficiently restrictive…If you look at the-I have a table of the last 12 months of 12-month readings, and there’s really no pattern there. We’re exactly where we were a year ago. So I would also say, it’s premature to discuss pausing. And it’s not something that we’re thinking about. That’s really not a conversation to be had now. We have a ways to go. And the last thing I’ll say is that I would want people to understand our commitment to getting this done and to not making the mistake of not doing enough or the mistake of withdrawing our strong policy and doing that too soon. So those-I control those messages, and that’s my job.
Source: Transcript of Chair Powell’s Press Conference, November 2, 2022
And the same policy stance has been proclaimed unanimously across commentary from Fed officials as of late, with many sticking to the narrative that there is still “a long way to go” when it comes to quelling inflation. Despite acknowledging that the “lags with which monetary policy affects economic activity and inflation” are now materializing, which draws the need to start considering a slowdown in the pace of rate hikes, policymakers remain fixed on tightening policy into restrictive territory, nonetheless. The hawkish commentary maintained indicates that “the Fed is likely to lean against easing financial conditions” despite recent data supporting that the economy is slowing. Specifically, a slowing economy is what the Fed essentially wants to ensure inflation is reined in. The intention of continued hawkishness is to prevent markets from mistaking any potential near-term deceleration in the pace of rate increases with a reversal of the economy’s current slowdown.:
The big picture illustrates that the Fed intends to slow down in order to allow more time for lags to operate and cumulative tightening to date to show up in the data. The hawkish talk from Chair Powell and many Fed officials subsequently is likely intended to provide air cover for the slowing to take place without an excessive easing of financial conditions.
Source: Bloomberg
What the Past Says
While continued market volatility in the near-term is almost certain, when the market might bottom remains a big question mark. The Fed’s monetary policy tightening campaign implemented this year is the most aggressive in 40-years, but the economy’s relative resilience this time around when compared to the past suggests that some macroeconomic factors have inevitably changed.
For instance, technology plays a bigger role in today’s economic development, while simpler factors like consumer behavior and the social construct’s role in the global macroeconomy have also evolved significantly in the past decade alone. The recent COVID pandemic and the ensuing disruptions to businesses and global supply chains has also injected further complexity into today’s macroeconomic conditions compared to past economic downturns, inflationary environments, and monetary policy tightening cycles. Yet, there are also many overlapping similarities between today’s inflationary environment and monetary policy tightening cycles compared to ones in the past that could potentially shed some light on where the economy stands today and what potentially lies ahead.
The “Global Recession” in the 1970s to 1980s
Context. Inflation reached double-digits in the U.S. and across major economies during the 1980s. Similar to today’s situation, soaring food and energy prices were culprit to runaway inflation at the time. The back-to-back energy crisis stemming from the Arab oil embargo in the early 1970s and the Iranian Revolution later the same decade, which resulted in a rapid decline in supplies, pushed oil prices up by as much as fourfold at the time.
Inflation topped 12% in 1974 with the Fed funds rate rising from 7% to 16% by early 1975, pushing the economy into recession. A stark Fed pivot followed with the Fed funds rate cut to 5.25% by April 1975, causing inflation to return while growth remained stagnate. By the time the second energy crisis came around, accommodative policies were deployed by the Fed in hopes of countering unemployment, but backfired by worsening the pace of price increases – inflation rose from below 5% in early 1976 prior to the second energy crisis resulting from the Iranian Revolution, to 7% by 1979. The Federal Funds Rate was pushed from 6.9% to 10% over the same period in hopes of stamping out inflationary pressure without “stifling fragile economic growth” at the time, but to no avail, which led to an extended period of stagflation instead and pushed the economy into recession again.
Timeline of quantitative tightening. The so-called “stop-go policy” during the 1970s came to an end when Paul Volcker took office as Fed Chair in 1979. Volcker made quelling inflation a priority, “even if it came at the detriment of short-term employment”. To some extent, this is similar to Fed Chair Powell’s commitment to arresting decades-high inflation “even if doing so risks an economic downturn”.
Inflation had already entered double-digits at 11% when Volcker became Fed Chair, while America’s jobless rate was inching close to 6% near the end of the 1970s. Fed rate hikes continued, pushing the economy into deep recession by 1982 with the unemployment rate reaching 11%. Over a three-year span, the Volker-led Fed pushed its benchmark rate as high as 20% and stayed in the double-digit range until inflation had fallen to 5% by late 1982. The Fed pivoted then with rates declining to single-digits, alleviating unemployment from the peak of 11% to 8% by 1983.
S&P 500 Bottom. The S&P 500 traded at single-digit (7.4x to 9.0x) estimated earnings when Volcker led an aggressive quantitative tightening cycle, which was reflective of the lower value of future cash flows. The market subsequently recovered when it became structurally clear that double-digit inflation was put away for good in the latter half of the 1980s.
Policy mistakes. The stop-go monetary policy implemented in the 1970s has been largely viewed as a policy mistake today:
In the 1970s, the Fed pursued what economists would call “stop-go” monetary policy, which alternated between fighting high unemployment and high inflation. During the “go” periods, the Fed lowered interest rates to loosen the money supply and target lower unemployment. During the “stop” periods, when inflation mounted, the Fed would raise interest rates to reduce inflationary pressure.
Source: Federal Reserve History
The on-and-off tightening eventually let inflation and unemployment run loose through the decade. Today, Fed Chair Powell looks to be taking a page from the 1970s on managing risks of runaway inflation, cautioning against a premature loosening of monetary policies even if economic recession is becoming a certain possibility.
We are not trying to provoke, and I don’t think we will need to provoke, a recession,” Powell said at a hearing before the U.S. Senate Banking Committee, although he acknowledged that a recession was “certainly a possibility” and events in the last few months around the world had made it more difficult to reduce inflation without causing one
Source: Reuters
Greenspan Tightening 1999 to 2000
Context. The Federal Reserve had resorted to monetary easing in 1998 as a pre-emptive measure to shore up U.S. growth “in the face of economic turmoil overseas” at the time, even though unemployment was at a historical low rate of 4.5%. But by 1999, it was clear the U.S. economy was booming, exhibiting a combination of robust consumer demand and job market, while inflation remained in check. This led the Fed to reverse course under Alan Greenspan leadership, and aboard a rate hike cycle that consisted of a 175 bps increases in 1999 from 4.75% to 6.5% by mid-2000.
Timeline of quantitative tightening. The 1999 tightening cycle was largely viewed as the Fed’s intention to “protect consumers and financial markets from something it has yet to see – a substantial rise in inflationary pressures”. Inflation was largely flat at the time, while GDP growth almost halved from 4.3% in the first quarter to 2.3% in the second quarter at the time.
By mid-2000, the Fed funds rate had reached 6.5%. Coinciding with the dotcom bubble burst that led to severe market instability, fears that continued tightening would slow the U.S. economy into recession had escalated. A Fed pivot ensued with rates cutting back to the 3% range, followed by further reductions in 2001 after the 9-11 World Trade Center terrorist attack that took the Fed funds rate to the 1% range.
S&P 500 Bottom. Over the course of the Greenspan-led “flip-flop on interest rates” between 1999 and 2001, stocks actually sold off even when the Fed pivoted to monetary easing. The selloff continued into late 2002 to levels not seen since 1998.
Market instability was marked by a combination of lofty valuations in internet stocks that fell to shambles after a slew of fraudulent reporting (cue Enron) and bankruptcies surfaced, underscoring rapid erosion of investors’ confidence. The 9-11 terrorist attack also escalated uncertainties over the U.S. economic outlook at the time, adding pressure to the market downturn at the time. The S&P 500 bottomed by late 2002, trading at double-digit (~30x) estimated earnings – a stark contrast to observations in the 1980s – which was consistent with record-low borrowing costs at the time.
Policy mistakes. The low interest rates embraced by Greenspan to arrest market instability and declines was largely known as the “Greenspan put“, which is viewed today as a key factor that led the run-up to the 2008 housing market collapse. The Greenspan put instilled a mentality that the Fed would restore market stability in the event of declines – essentially, moral hazard – which caused “excessive risk-taking in stock markets”. This eventually led to high-flying valuations, particularly in internet stocks, that crashed in the 2000s. Similar happened again when financial markets collapsed in 2008.
The “Great Recession” of 2007 to 2009 and the 2008 Financial Crisis
Context. Rate hikes resumed under Greenspan’s leadership in 2004 when GDP growth was pushing 4% while inflation was at 2.7% and unemployment 5.4%, showing signs of an overheating economy. Interest rates rose from 1.0% to 5.25% over the course of 17 incremental hikes between 2004 and 2006, when inflation surpassed 3%.
By 2007, GDP growth had fallen to 2%, and deteriorated rapidly to 0.1% the following year with unemployment surpassing 7% and inflation pushing 4%. The U.S. economy had effectively entered recession at the time, with unemployment reaching 10% by late 2009 fuelled by the housing bubble burst in 2008 (i.e. 2008 financial crisis). The S&P 500 fell 57% over the same period, wiping out close to $15 trillion in American’s net worth.
Timeline of quantitative tightening. The 2004 to 2006 tightening cycle peaked with the Fed funds rate at 5.25%, but was insufficient in stamping out inflation and keeping unemployment at bay. This effectively drove the U.S. economy into recession by 2007, with a combination of fiscal and monetary policy easing implemented under the leadership of then-president George W. Bush and then-Fed-Chair Ben Bernanke with aims of shoring up the economy. The 2008 financial crisis ensuing from the housing bubble burst that left “trillions of dollars of worthless investments in subprime mortgages” also compounded pains.
By the end of 2008, the Fed funds rate had already been cut to the 0% to 0.25% range to stem the economy from unravelling further. The FOMC had intended to keep the Fed funds rate “at exceptionally low levels for some time and then for an extended period” at the time, and the near-zero range eventually held until 2015. Monetary policy under Bernanke’s leadership was focused on the “use [of the FOMC’s] policy statement to provide forward guidance for the federal funds rate”, which helped manage market’s understanding of economic and financial conditions during the Great Recession.
The Fed also implemented “large scale asset purchase” (“LSAP”) programs at the time to ensure “longer-term public and private borrowing rates” were kept at low levels in alignment with the near-zero Fed funds rate. This included the Fed’s buyback of mortgage-backed securities (“MBS”) and Treasuries at the time to “reduce the cost and increase the availability of credit for home purchases” – a detrimental corner of the market during the financial crisis. The LSAP program is also similar to the MBS and Treasury buybacks implemented by the Fed at the onset of the COVID pandemic in 2020 to “help ensure chaotic markets function properly [and] ensure credit flows to corporations as well as state and local governments”.
S&P 500 Bottom. The S&P 500 fell 57% between October 2007 and March 2009, though the economy remained weak with unemployment still on the run towards 9.5% in June 2009 before peaking at 10% in October 2009. The index was trading at more than 70x estimated earnings at its trough in March 2009, which was consistent with the hit on corporate fundamental performance across the board, as well as record-low borrowing costs at the 0% to 0.25% range. The valuation multiple moderated to the 20x-range of forward earnings by 2010 as corporate fundamentals started to recover, while the Fed funds rate was held steady at the near-zero range.
Policy mistakes. As discussed in the earlier section, the housing bubble burst that also contributed to the Global Recession from 2007 to 2009 was likely partially driven by market moral hazard instilled by the Greenspan put. Recall that Bernanke also sought to rapid rate cuts between 2007 and 2008 in response to deteriorating macro conditions and the sliding market, adopting a similar strategy as Greenspan that “may have been a catalyst contributing to the conditions of the 2008 financial crisis”.
However, Bernanke’s subsequent adherence to low interest rates for an extended period, as well as bank bailouts that cost as much as $700 billion, and other monetary easing policies such as the LSAP program ($1.75 trillion) was key to the long, yet stable market recovery in the years that followed.
The COVID Pandemic
Context. Fed rate hikes resumed in 2015 under Fed Chair Janet Yellen after economic growth showed an extended period of stabilization in the 2% range, while inflation was flat with unemployment at 5%. The hikes continued even after Jerome Powell took over as Fed Chair in 2018 until the Fed funds rate reached 2.5% by the end of the same year.
Timeline of quantitative tightening. The Federal Reserve resumed monetary policy tightening in 2015 upon evidence of “improvement in the labor market [and reasonable confidence] that inflation would move back to its 2% objective over the medium term”. As mentioned in the earlier section, unemployment had fallen to 5% in 2015 from the peak of 10% during late 2009. The intention was to pursue rate hikes while also maintaining an accommodative policy stance to “support further improvement in labor market conditions and a return to 2% inflation”.
The Fed pivoted to rate cuts by the summer of 2019 after the global equity market lost close to $7 trillion of its value by the end of 2018. However, GDP maintained at the 2%-range at the time, while unemployment was at 3.5% and inflation inched up to 1.9%, which stoked concerns of an eventual economic downturn. Rates were cut from the peak of 2.5% in late 2018 to 1.75% by late 2019. Rapid easing took place with rates sliding to the 0% to 0.25% range at the onset of the COVID pandemic in March 2020.
S&P 500 Bottom. More than $7 trillion in global market value was lost in 2018, with the S&P 500 giving up close to 10% of its value (or almost 18% from the 2018 peak in September) before finding bottom near year-end. The index was trading at about 20x forward earnings at the time, which was consistent with rising, yet still low, interest rates at the time, relative to past financial crises.
Policy mistakes. Market critics have viewed the 2015 rate hike cycle as “premature”, given inflation was still struggling to climb back towards the 2% Fed target at the time. It was not until 2018 when inflation topped 2%, which also coincided with market’s negative reaction to rising borrowing costs following the preceding years of a near-zero Fed funds rate.
What Exactly is Valuation Composed of?
Before drawing on past economic cycles to gauge forward expectations, we turn to basic valuation theory to understand the interaction between key driving factors, including interest rates, inflation, unemployment and GDP. Most of the time, when we think of valuation, we think of the fundamental leg (e.g. growth, earnings, cash flows, etc.) and the valuation multiple (which is influenced by cost of capital / discount rate). But in economic theory, valuation can also be split into the following two components: steady-state firm value + future value creation.
Steady-State Firm Value
The steady-state value is defined as the value of the firm when “NOPAT (net operating profit after tax) is sustainable indefinitely and incremental investments will neither add, nor subtract, value”. This does not necessarily mean the point at which a company grows at 0% forever, but rather the point of growth that stays constant regardless of whether incremental investments are made (i.e. it could be a steady-state perpetual growth or declining rate).
Steady-State Value Formula (Valuation Theory)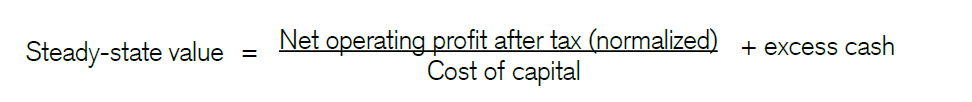
One way to depict steady-state value is via the steady-state firm value P/E ratio, which is defined as 1 divided by cost of capital:
A company can continue to grow earnings as it invests at the cost of capital. It will just fail to create value, and hence should trade at its steady-state worth. We can readily translate from the steady-state value to a steady-state price-earnings multiple, which is the reciprocal of the cost of [capital].
Source: Credit Suisse
The intuition is to find the valuation multiple (i.e. P/E ratio, in this case) reflective of the point at which continued investments at the cost of capital will continue to drive earnings growth, but not necessarily yield any incremental value creation, and hence stay at a steady-state of “1”.
To gauge where the market’s steady-state value might be headed, we turn to key driving factor, cost of capital. Cost of capital is essentially the borrowing cost, which can be benchmarked against the Fed funds rate. Based on an understanding of past economic cycles, the Federal Reserve today is likely leaning towards the Volcker era, with a sprinkle of Bernanke.
What this means is that the Fed’s commitment to taming inflation – even if it comes at the cost of some near-term economic pain – will eventually lead to more rate hikes in coming months, especially as inflation today remains far from the 2% target. This is consistent with the growing drumbeat of calls by Fed officials to raise rates into “restrictive territory” and holding it there until there is structural evidence inflation is back on track towards the committee’s target range. To prevent further policy mistakes (we say “further” since the whole “transitory inflation” narrative last year obviously did not work out), responding to recent signs of slowing demand with a Fed pivot is essentially off the table, as implementing such as policy would likely be begging for a repeat of the “stop-go” disaster in the 1970s before Volcker. At best, the Fed will likely stick to what it has been doing at recent meetings – setting clean and clear forward expectations for markets like Bernanke had. In today’s case, this means there will be more tightening in financial conditions that could potentially push the terminal rate higher, while keeping in mind of the “effects of lags in monetary policy” and start considering a moderation in the pace of coming rate hikes.
Traders are largely expecting a moderation in the pace of rate hikes from the jumbo 75 bps seen over the summer and fall, to a half-point increase at the coming December meeting, which would bring the Fed funds rate range from the current 3.75% to 4%, to 4.25% to 4.5%. The terminal rate is expected to reach 5% to 5.25% based on current prices on 1H23 Fed swaps. Substituting the estimated terminal rate of about 5% plus an additional percentage point to account for forward market risk premium (reflective of difference between 1-year Treasury yield of about 4.75% today and the current Fed funds rate range of 3.75% and 4%) as proxy for market cost of capital in gauging the steady-state firm value P/E ratio would yield about 17x. The S&P 500, which can be viewed as a proxy for the weighted average of its constituents’ respective valuations, currently trades at about 20x estimated earnings. If market steady-state firm value is to be adjusted as a result of continued Fed policy tightening, the S&P 500 could potentially move another leg lower by as much as 15% between now and when the Fed funds rate peaks in the current tightening cycle, which is estimated to occur by mid-2023.
But there are a myriad of other factors that could impact where the so-called steady-state firm value is headed as Fed tightening continues over coming months, including economic growth and investor sentiment on a broader basis. This is consistent with the observation discussed in earlier sections that market bottomed in March 2009 even though the economy continued to deteriorate with unemployment hitting trough at 10% seven months later in October 2009. This could both be reflective of the fact that market is forward looking (or priced at estimated earnings and forward macro expectations) and/or the lag effect in which monetary policy works, among other factors. What this essentially means is that while rate hikes are expected to peak by mid-2023, it does not necessarily mean that is also when the market will bottom. But nonetheless, even if it is almost impossible to gauge the exact timing, it is more likely that not that the market is skewed towards further downside risks through the first quarter of 2023 at the minimum.
In addition to the steady-state P/E ratio method, the Gordon growth model is another way to gauge steady-state firm value.
Gordon Growth Model (Valuation Theory)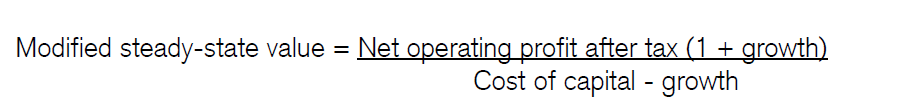
The key assumption here other than cost of capital is GDP growth. GDP growth is typically used as a key benchmark to gauge the implied perpetual growth of a company, with addition consideration of the maturity of its industry as well as other company-specific factors such as market leadership, competitive advantages, and/or market share:
Companies operating in industries that are higher growth in nature are typically valued at a perpetual growth rate closer to or more than GDP, given their greater contributions to economic growth. Alternatively, companies operating in lower growth and/or mature industries are typically allocated a lower perpetual growth rate.
Source: “Shorting Tesla: Bridging Lofty Valuations to Economics“
As discussed in the earlier section, demand is likely to show a marked slowdown in coming months as consumer purchasing power wanes, especially if unemployment worsens, which will lead to further deteriorating in economic growth. Even though the labor market has remained largely resilient despite the recent slew of high-paid tech layoffs (accounts for only ~2% of total U.S. employment), consumer weakness is expected to tame demand further and eventually hit corporate earnings, potentially resulting in more cost-driven job cuts. This is further corroborated by the gradual uptick in recent jobless claims as well as jobless rate to “3.7% from a more than five-decade low”. This means GDP is likely to slow as interest rates increase, widening the spread between cost of capital and growth in the denominator of the Gordon growth model, and inadvertently, diminishing the steady-state firm value.
Future Value Creation Premium
The future value creation premium accounts for the incremental value that additional investments at the cost of capital would earn (i.e. return on capital), and also takes into consideration the time period in which this value-creating opportunity would last.
Future Value Creation Formula (Valuation Theory)
This is essentially a premium to the steady-state firm value, and explains the lofty valuations relative to broader markets observed in certain stocks, such as Apple (AAPL), Tesla (TSLA) and Snowflake (SNOW), today. Admittedly, these companies have either or all of outperforming balance sheets, profit margins, and/or growth prospects relative to peers, but not all are valued in proportion to the mean growth-valuation ratio observed among their respective peer groups.
In addition to the “competitive advantage period”, which measures the anticipated time period in which the added value-creating opportunity would last, key assumptions in deriving future value creation premium is return on capital and cost of capital. And return on capital can be substituted by anticipated economic expansion, or GDP growth – when the economy is good, growth and profit margins will likely perform better, and vice versa. But as discussed in the earlier section, GDP growth is likely skewed to the downside within the foreseeable future as demand continues to slow and profit margins get squeezed as a result of high input costs, and near-term requirements for more-than-usual promotional offers to offload excess product inventories.
Paired with the anticipation for greater increases to the cost of capital as a result of Fed hawkishness that will more likely than not continue for a while longer, the cost-return spread in the numerator of the future value creation component of valuation is poised to narrow. And as cost of capital continues to increase, the denominator will also expand, hence diminishing the future value creation component of broader market valuations, which corroborates the expectation for more downside potential within the near-term.
Implications for the S&P 500 and Nasdaq 100 – Is the Bottom Near?
Based on valuation theory, and the anticipation for sustained hawkish Fed sentiment drawn from historical observations, the broader market is likely to see further volatility ahead as valuations adjust to rising rates and declining demand. While the timing at which markets will bottom remains uncertain, we are of the view that company fundamentals are only just starting to feel the impact of consumer weakness, which points to further value erosion through 1H23.
Specifically, consumer spending has remained resilient through the first half of 2022 despite deteriorating sentiment due to surging inflation and rising borrowing costs. But headed into the first half of the fourth quarter, declining business activity and warnings of a marked slowdown among consumer-centric industries such as retail underscore that waning consumer sentiment is now really materializing into real weakness. This is further supported by the consistent drop in American household savings and rise in credit card debt, among other observations, discussed earlier on in this analysis.
And a specific note to the tech-heavy Nasdaq 100 (NASDAQ:QQQ / NDX), constituents’ valuations are likely to be hit harder compared to those in the S&P 500 given their cash flows are further out (with some still in pre-revenue phase and/or unprofitable) from realization and subject to a heavier discount as costs of capital increase. The index also consists of constituents with some of the biggest valuation premiums given lofty forward growth expectations previously priced in that may not materialize as expected within the foreseeable future, thus pointing to greater vulnerability to downside risks ahead.
And given risks of further macro deterioration are now skewed higher with recent economic data pointing to a moderation in the labor market, while monetary policy tightening continues to flow through different corners of the economy, the ensuing rise in the likelihood of a recession will likely take the market a leg lower through the first half of 2023, even if we start to see structural easing in price pressures.
Be the first to comment