

Surendra Sharma/iStock via Getty Images
Introduction
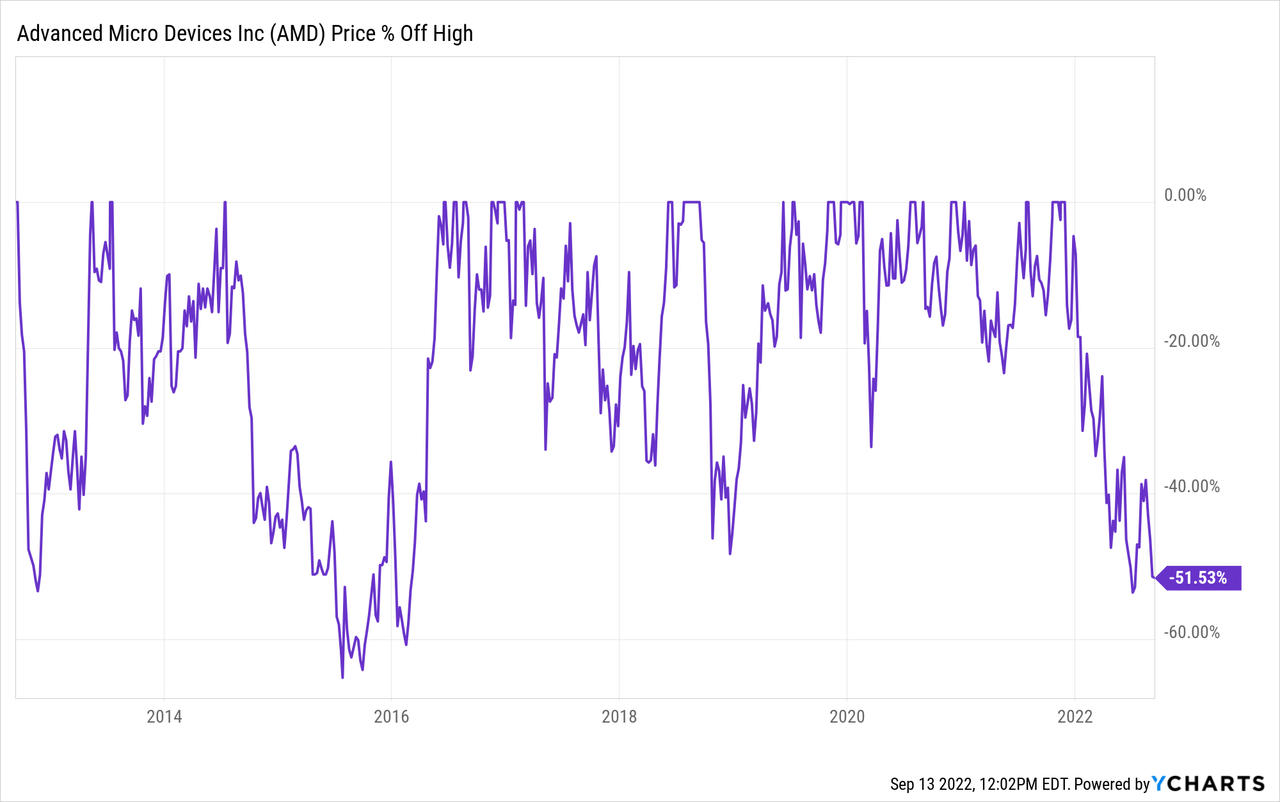
This will be the first article I’ve written on Advanced Micro Devices (NASDAQ:NASDAQ:AMD). As I’ll show in the article, AMD stock’s long-term historical track record has been inconsistent and difficult to predict. However, I think the time has come to start giving AMD the benefit of the doubt in terms of the general quality and competitiveness of their business, and, because of the improvement in their business, they need to be considered as part of any investor’s potential semiconductor exposure. The difficulty is determining what price to pay so that there is a high probability of producing above-average returns. My assumption in this article is that most readers will generally agree that the quality of the business is good. So that’s not the main thing I will be examining. For example, AMD’s business is just as good now as it was in December of last year (perhaps even better), but that doesn’t explain this price performance of the stock:
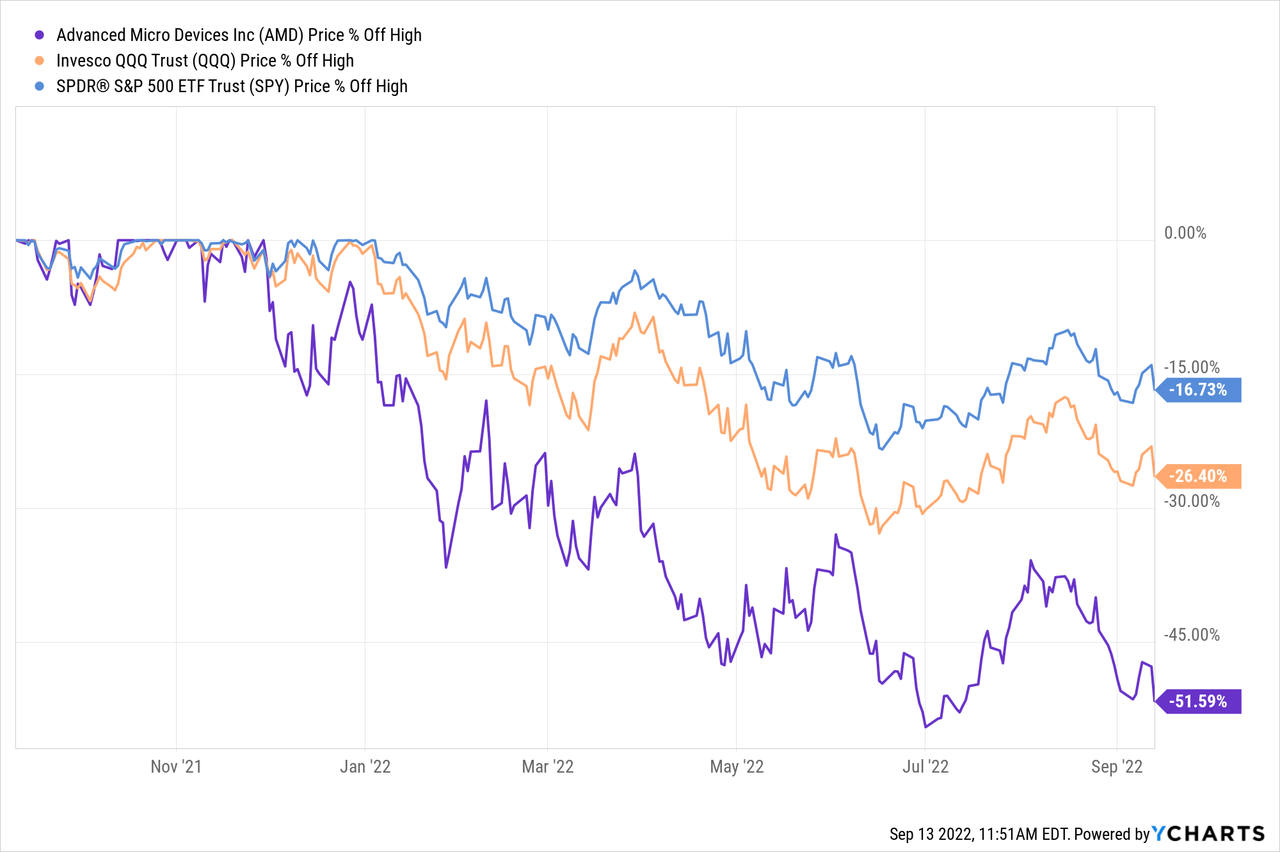
AMD is currently more than 50% off its highs, while QQQ is down half that amount and the S&P 500 ETF (SPY) is only down 17% off its high, all of which were made about the same time in late 2021. Furthermore, just about everyone who bought AMD during the past two years is now roughly flat, or down, on their investment. My hope is that this poor performance is enough for AMD shareholders to realize that AMD’s general quality as a business is not the primary issue they need to worry about, and even high-quality semiconductor stocks are subject to very big swings and stock price volatility.
The real question is when will AMD stock be cheap enough to buy so that the investor has a high probability of producing above-average returns over the medium-term of 2-5 years? And that is what I will explore in this article.
AMD’s Historical Earnings Cyclicality
The first thing I check for every stock I analyze is to see what its historical earnings cyclicality looks like. The reason I do this is because I want to know if this is a stock that fits the profile of a stock I would consider investing in, and also I want to know which strategy and techniques are the most appropriate to analyze the stock in question.
FAST Graphs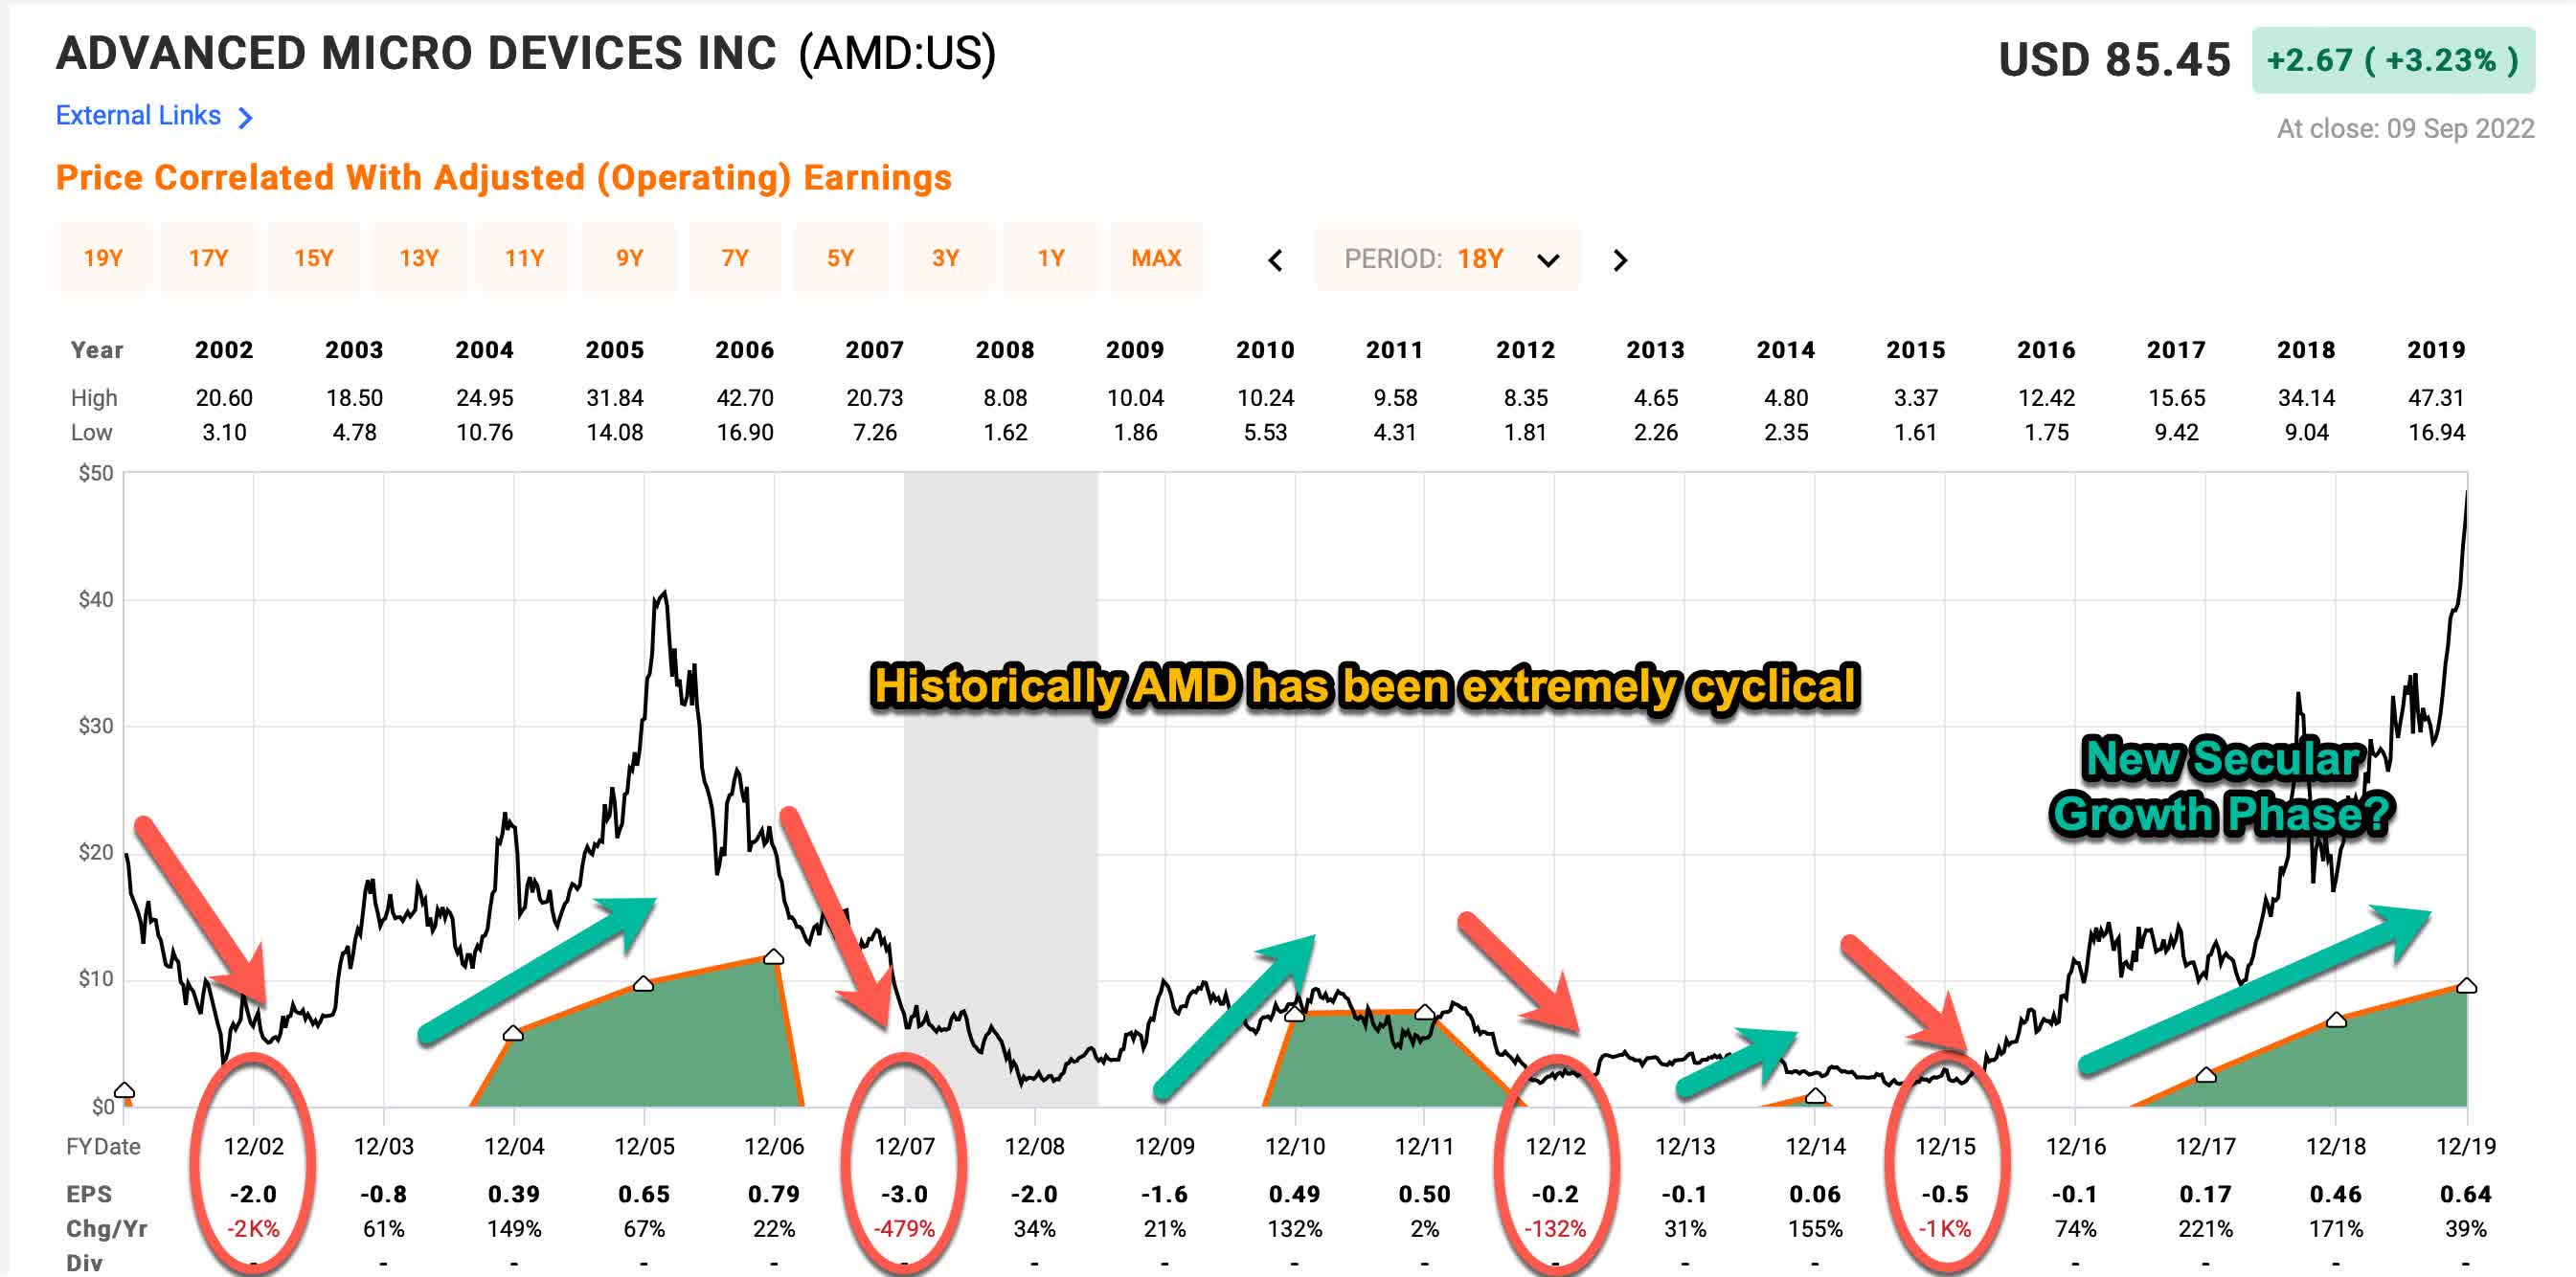
The dark green shaded area in the FAST Graph above represents AMD’s historical earnings per share. I’ve circled the years in red in which earnings were negative compared to the previous year. In AMD’s case, these negative EPS years were extremely deep. But AMD’s earnings typically returned to positive territory within 3-4 years. The primary reason I check earnings cyclicality is so that I can determine what sort of strategy is appropriate to use for a stock. My basic guideline is that if EPS has fallen more than 50% in the past, then I do not use an earnings-based analysis to value the stock because earnings fluctuate too much to be a reliable guide for when to buy. AMD clearly falls into that category.
The larger concern for me historically regarding AMD and its very deep earnings cyclicality, is that, before I invest, I prefer to see a deep cyclical stock’s earnings upcycles to be stronger than what AMD’s have historically been in the past. For this reason, I have not considered buying AMD stock during previous down cycles. However, I think there is reason to believe that AMD has recently found a way to improve its earnings capabilities during the upcycles. I ended the FAST graph above in 2020 so that I could fit all of the long-term historical data in the graph. Now let’s look at a more recent time frame.
FAST Graphs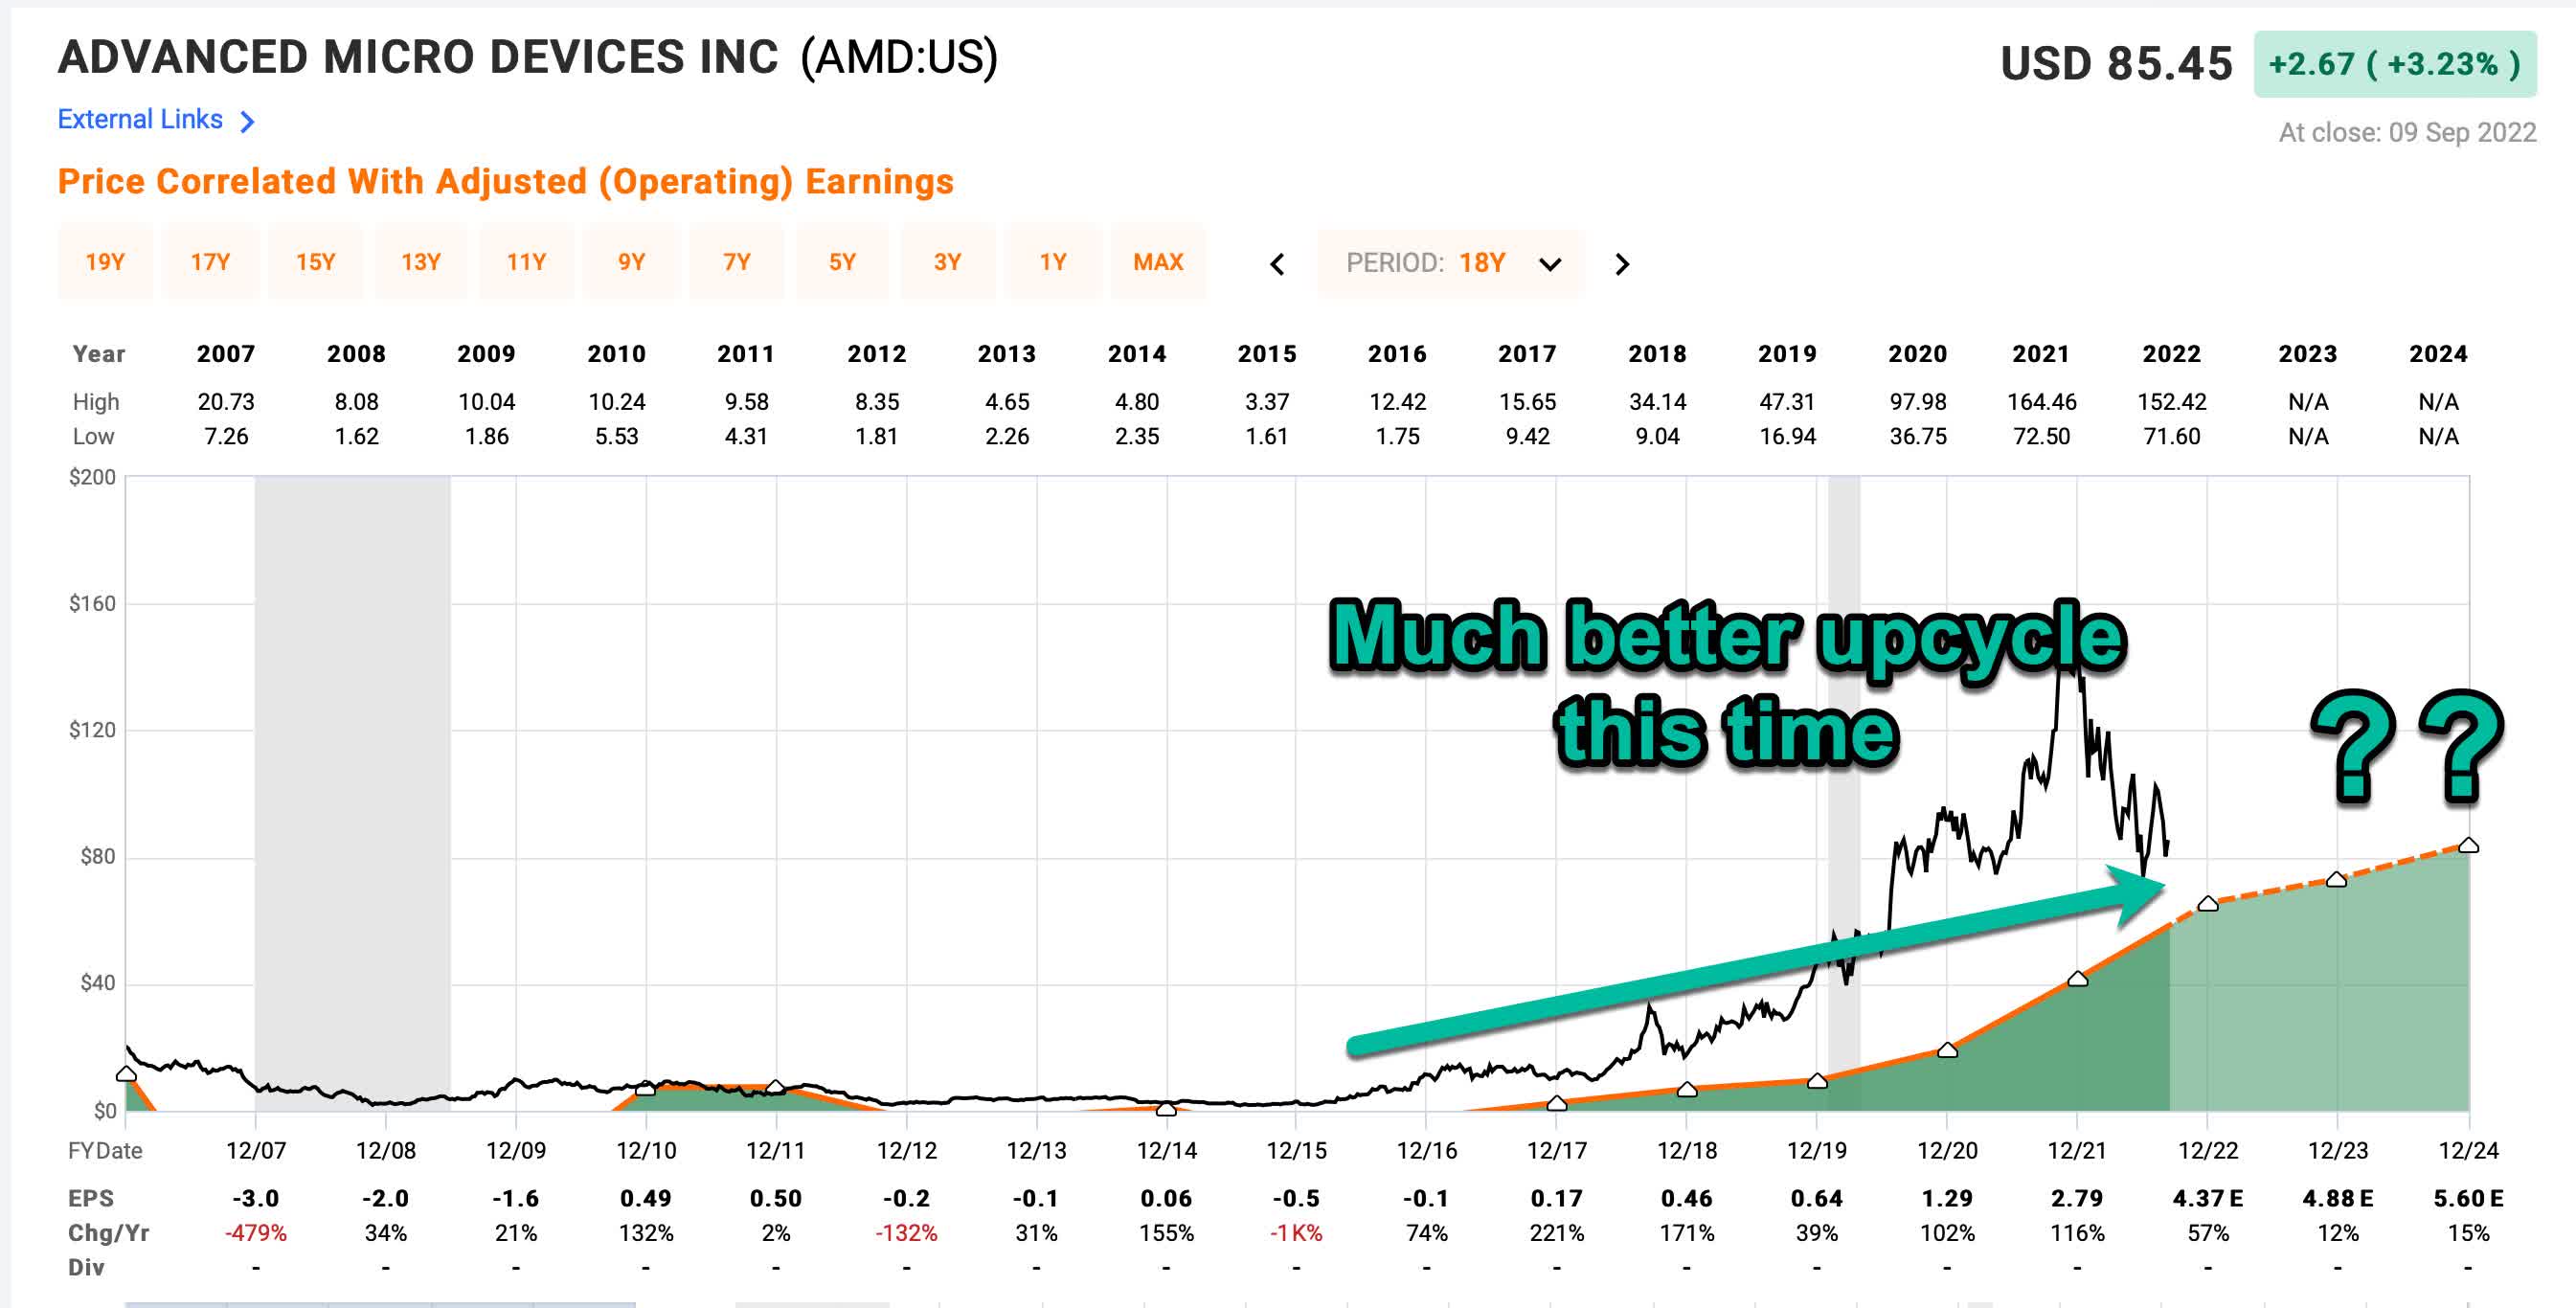
We can see that the current earnings upcycle is much, much stronger than AMD has experienced in the past. Now, some of this can certainly be attributed to the unique situation regarding COVID and the massive amounts of stimulus that were issued by the US government. But, even before that stimulus, AMD was already on track to have a record upcycle and was looking pretty strong, and most industry experts seem to agree that AMD’s success is coming at a cost to Intel (INTC). So I think it’s fair to assume there is at least some structural or secular shift happening in AMD’s favor.
The part of the graph I am more skeptical about is 2023’s and 2024’s forward earnings expectations. These expectations imply that AMD’s down cycles have disappeared and won’t happen anymore. I think that’s a dangerous assumption to make, and we already see AMD’s stock price effectively telling us that these assumptions from analysts for uninterrupted earnings growth without a downcycle are likely to be wrong. The question is how wrong will they be?
I don’t really have an answer to that question, but it’s worth examining the past to at least establish a broad framework from which to make some estimates.
Advanced Micro Devices Historical Price Cyclicality
Next, I’m going to examine Advanced Micro Devices’ historical price cyclicality in order to help guide a potential purchase price of the stock. While patterns don’t offer a perfect map to the future, they at least offer pretty good guideposts that have a high probability of producing good medium-term returns over the course of 2-5 years.
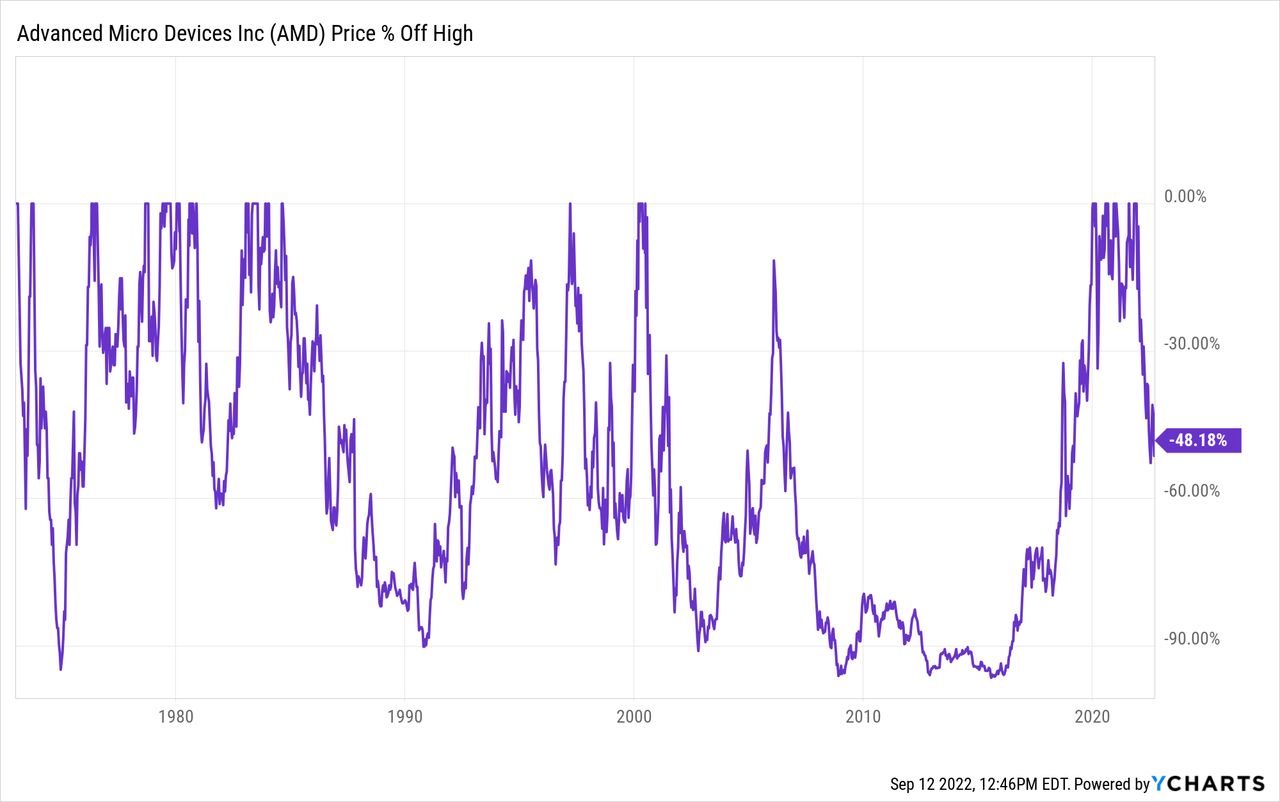
As we can see in the drawdown chart above, historically, AMD has experienced extremely deep price drawdowns in excess of -90%. These levels of decline can be absolutely soul-crushing for investors. But what has concerned me more is that historically the recovery periods can sometimes be quite long as well. Buying after an approximate -80% decline around 2008 would have taken an investor about a decade to recover from. That’s too long for my taste, and it’s why I have avoided buying AMD in the past. So, I am taking a bit of a leap of faith and assuming that AMD will probably recover from the current downturn, whenever it eventually bottoms, within five years. The idea behind this assumption is that we will remain in a secular growth trend for semiconductors even if we are heading into a recession and down cycle in 2023. So, while the short-term outlook is pretty bleak, the medium-term of 3-5 years can still look pretty good.
Next, let’s shorten the time frame of the graph above to get a more current read on the situation to see if there is any information there that might be useful to us.
Above is a more current drawdown time frame from the past 10 years. Here we can see that the 2018 drawdown was approximately -50%. And that the 2014 drawdown was roughly -65%. Importantly, these did not occur during recessionary periods. So, these would be the types of declines one should expect from the stock during what I call “mid-cycle” declines, meaning they occur in the middle of a wider economic cycle and not at the same time as an economic recession. That means our expectations in terms of drawdowns should probably be in the range of -50% to -65% off the high if we do not experience a recession. Currently, the stock is in this range. So, if an investor was very optimistic about AMD’s future and they didn’t think we were going to have a recession within the next 18 months, then they wouldn’t be crazy for starting to buy the stock today. I, however, do expect a recession in 2023, so I actually think that the deeper end of this range is where I would start to buy if the recession turns out to be a mild one and indeed AMD is a stronger business than it has been in the past.
Putting all this together, I think establishing a buy price at about -65% off the highs in a situation where AMD is in a secular growth business and a mild recessionary downcycle, is reasonable. And that is where I am aiming for my first purchase. I run an unconcentrated portfolio, so my initial weightings, especially for deeply cyclical stocks like this, are about 1% of the portfolio.
Because AMD does have a very well-established past of dropping more than -90% off its highs during a recession, I am also prepared to buy a second position should the stock price fall that far. Unlike my first position, which I currently have enough cash on the sidelines to buy (I’m in between 25% and 30% cash right now.) I will probably have all of my cash into the market if we have a market decline deep enough to push AMD -90% off its highs. So, if that happens, I will probably rotate out of a low-beta position like Altria (MO) into AMD, or rotate out of what I consider to be a lower-quality position right now like Intel (INTC) (which I bought in October 2020) into AMD. So, I won’t be sitting around in cash hoping for the huge decline, but I will be prepared for it both mentally and strategically, should it happen. (And I think we have to admit that something that has happened four times in the past could happen again.)
My investing approach for deep cyclicals attempts to find historical patterns and then assume they will roughly repeat. However, I do check several things in order to see if there are obvious signs that this cycle really might be different this time and not repeat. I call these checks “impairment tests” and usually they take the form of questions. In the next section, I will run through this list of tests with AMD stock.
Impairment Tests
Are revenues this cyclical peak higher than the last one?
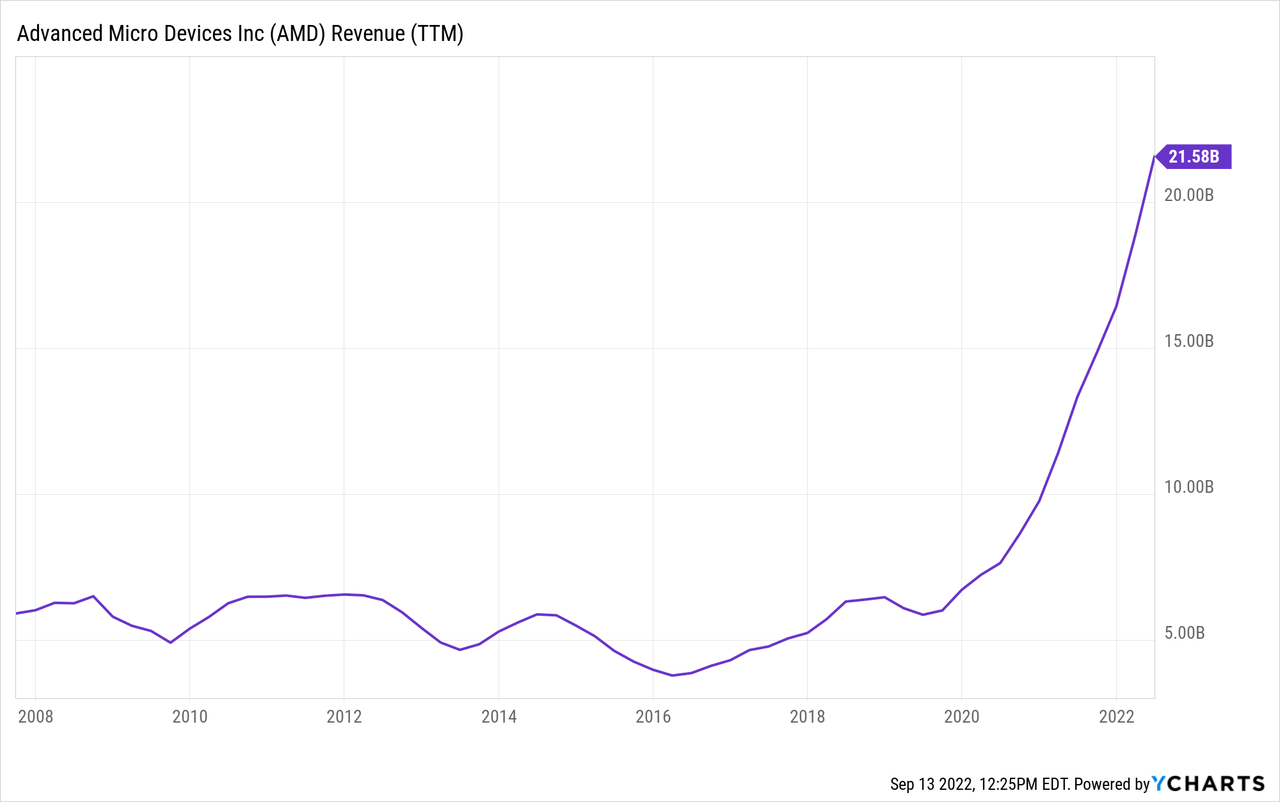
Revenues are much higher than they have been before. Part of this could be part of a pandemic/stimulus boom, which could turn into a bust, however, AMD had already reached new highs in terms of revenue before the pandemic started, so I think we are good here.
Could the business have a hidden fatal flaw?
Since, by definition, the fatal flaw in the business model is “hidden” and cannot be easily seen, my test for this is whether the cyclical business in question has experienced two full business cycles because, typically, recessions are where the flaws are exposed, and sometimes businesses can get lucky and avoid trouble in one recession but have the flaw eventually catch up to them during the next. AMD has found a way to survive for a very long time even when the business was fundamentally weaker, so I’m not really concerned about this.
Is there a clear and disruptive threat to its core business?
Frankly, as far as I can tell, they are likely the disruptor rather than the business that is being disrupted, so this isn’t something I’m worried about over the next 2-5 years.
Has AMD stock experienced a recent super-cycle?
Generally speaking, I think the wider market could certainly have experienced a 2000-like super-cyclical peak at the end of 2021. This can cause a problem for a strategy like mine that measures declines from peak prices because if the peak prices are ridiculously high, then a stock might fall -65% or more off its highs and still not exactly be a good value.
I don’t have a clear way to identify super-cycles. It’s kind of an “I’ll know it when I see it” sort of thing. But my quick way to check is to look at a log-scale version of a long-term historical price chart. Super-cycles tend to show up pretty well on these charts without giving as many false positives as a normal long-term price chart might.
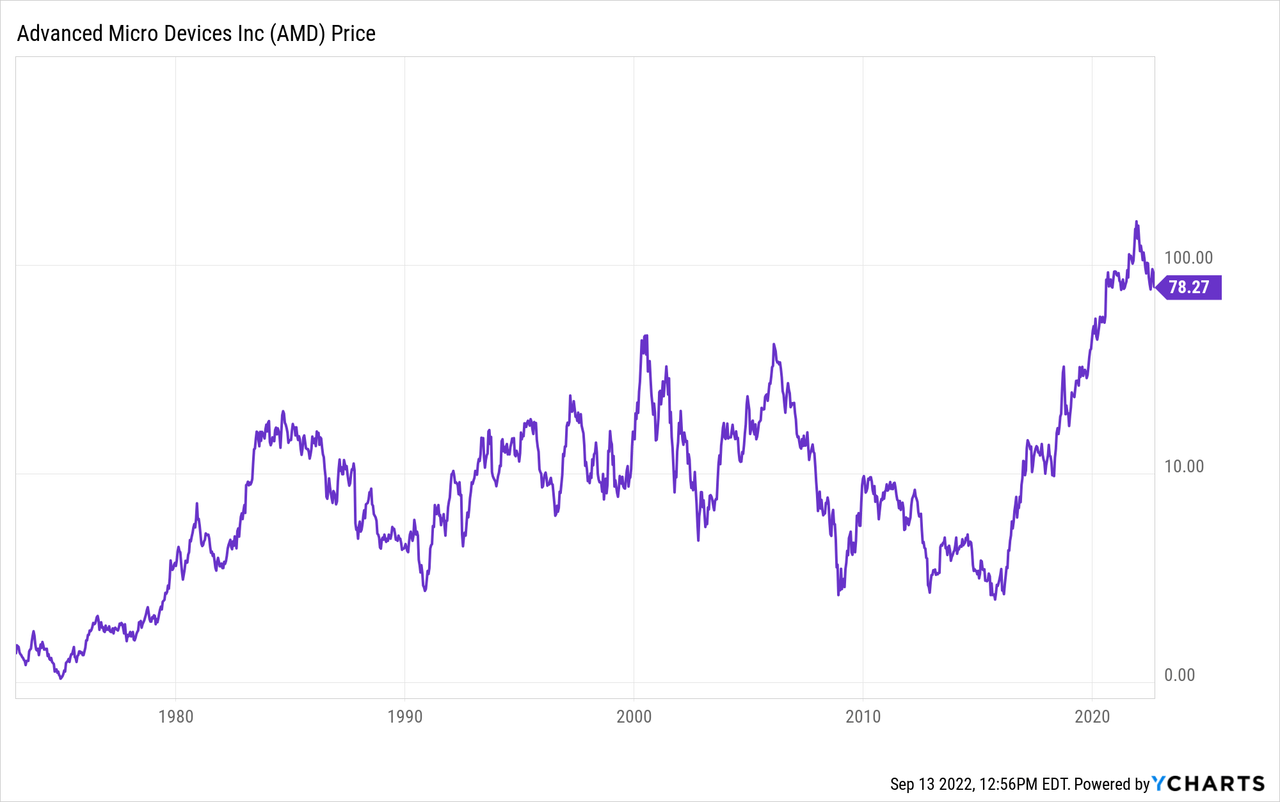
Even taking into account AMD’s improved business position, I think the odds are high that AMD has experienced a super-cycle over the past 5-7 years. Basically, everything that could go in their favor, did go in their favor, including macro-conditions and low interest rates. So, investors need to be very careful here. The way I typically approach cyclical stocks that appear to have had a super-upcycle is to wait for a double bottom before buying the stock. And so for investors who cannot stomach a deep drawdown, or who can’t wait up to five years for the price to recover, I would wait and look for some kind of a technical bottom, wherever it might occur (but not before the stock is at least -65% off its highs) before buying.
In my case, since I purposefully take low-weighted positions and I know I can handle a deep drawdown should it occur, I’m in a little bit different position. I am mentally prepared for the stock to potentially fall -90% off its highs, which means, that even if the stock has experienced a super-cycle, the price will fall low enough to account for that before I make my second purchase. So, at least with my second potential purchase, I will be getting a good price no matter what, as long as AMD eventually recovers.
This will not be painless for me, should it happen, though.
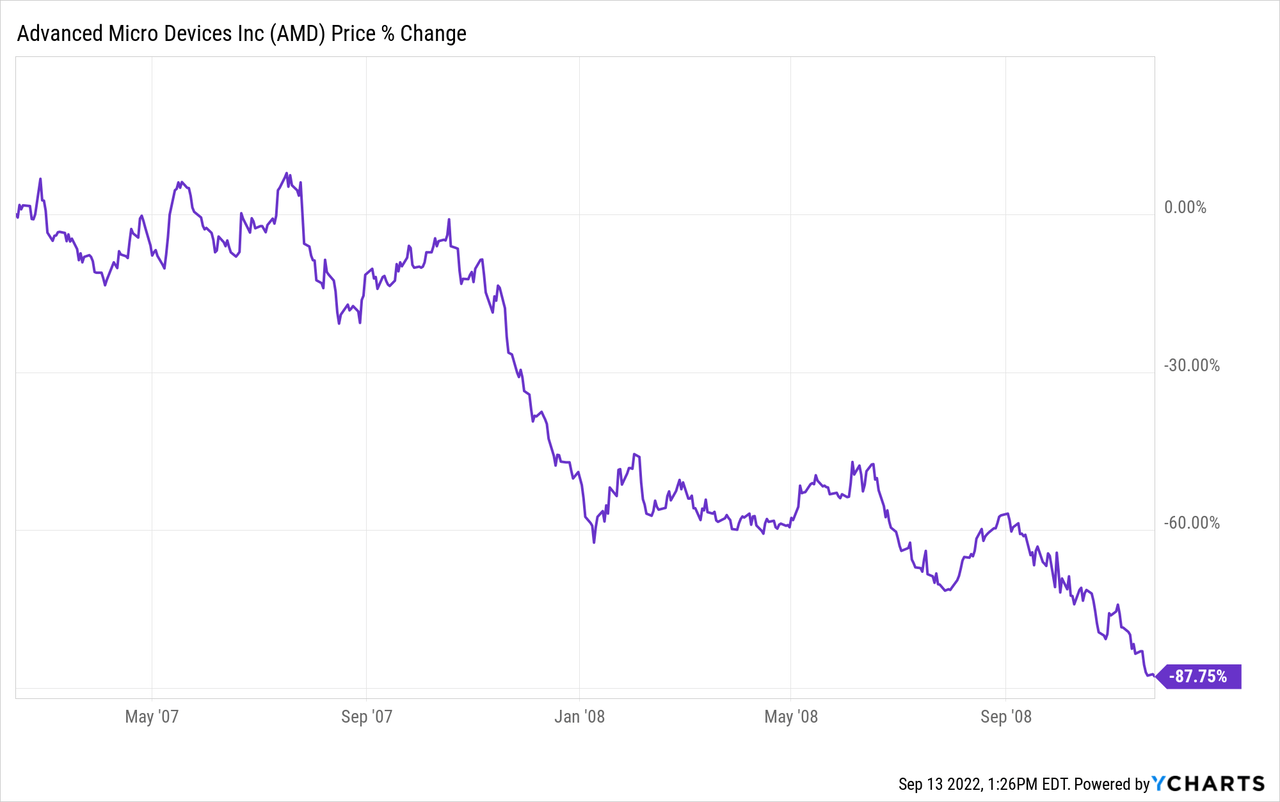
An investor who bought AMD 65% off its highs in 2007 would have suffered through an 87% additional decline in the price of AMD. So, basically, if AMD falls over 90% again, any investor who bought the stock during the past several years, or on the way down, will probably be 80% or more underwater. These are not easy drawdowns to experience for anyone and if a person isn’t prepared for them ahead of time, they are sure to be miserable.
In the end, the current supercycle isn’t enough to prevent me from buying my initial position and taking a chance we have only a mild recession, and assuming some part of the supercycle was justified by the secular bull conditions. But I am very aware of the risk I will be taking.
Is management corrupt or incompetent?
Great management as far as I can tell.
How is the company’s debt-to-equity compared to previous cycles?
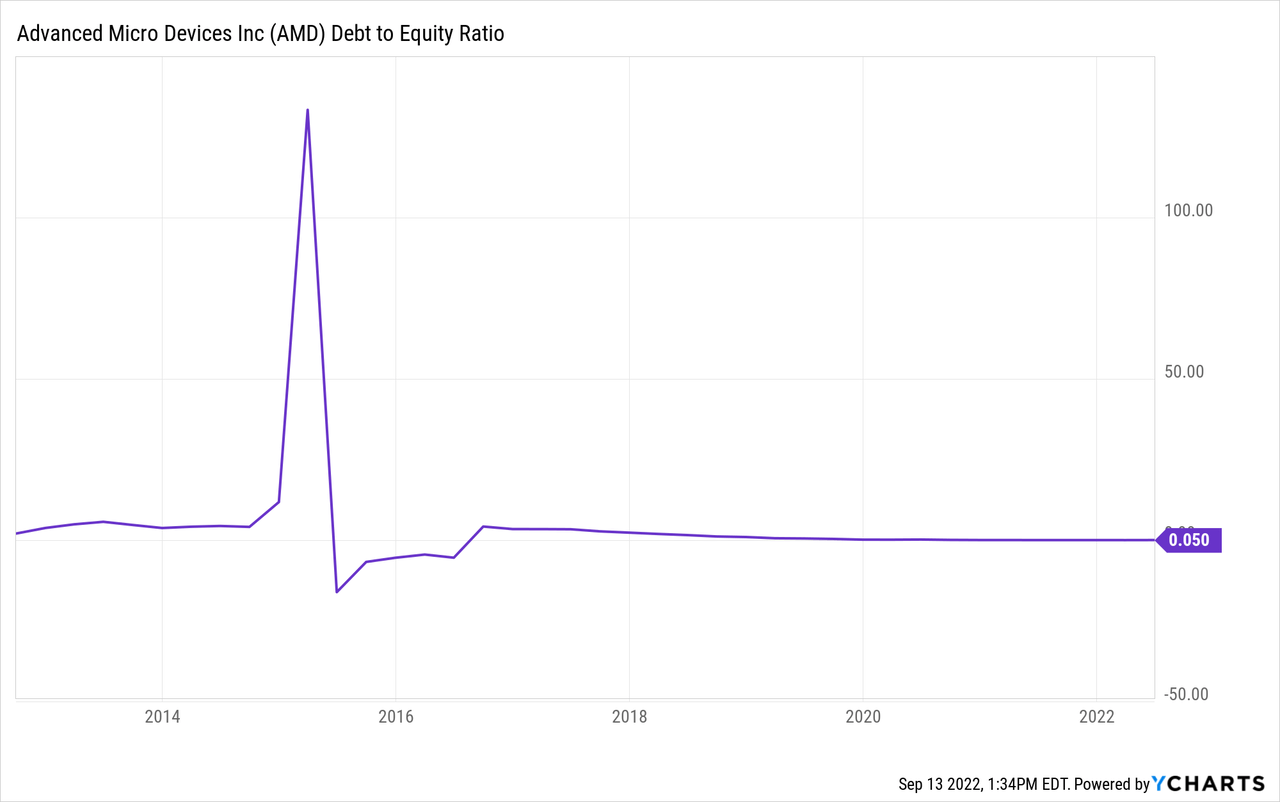
Usually, I take pause if I see a debt-to-equity ratio over 1.0 and also elevated compared to where it has been historically. In this case, I see neither, so not much of an issue for me.
Has the price dropped enough to produce alpha in the past?
If you’ve read my recent articles on Micron (MU) or NVIDIA (NVDA), then you are aware that in this section I typically backtest the results of what would have happened if we had purchased the stock at my buy prices during previous drawdowns. Since I expect this cycle to be a little bit more positive for AMD, what I will do instead is share the numbers of what sort of return an investor will get over five years and 10 years, if AMD’s price one day recovers its highs.
If an investor buys AMD when it’s 65% off its highs, and the stock price takes five years to recover its old highs, that will produce a +23.36% CAGR. This is probably my base case of what is likely to happen, and I am perfectly happy with those returns. If the stock were to take 10 years to fully recover (which has happened in the past) then the CAGR would be +11.07%. Not great, but still acceptable, and perhaps even better than the market average. But, an investor will need to be patient and may have to hold through an extremely deep drawdown in the process.
If an investor buys AMD 90% off its highs, and the stock price takes five years to recover its old highs, then it will produce a +58.49% CAGR. (I would suggest holding this one in a tax-sheltered account if you can because it will be tempting to hold onto it and not sell it at this point, but my policy is to take profits when deep cyclicals make new highs.) If it takes 10 years to recover its old highs, then it will produce a +25.89% CAGR. Still very good.
Hopefully, this gives some context for the types of returns that are possible when you buy at a good price and AMD eventually recovers (even if it takes a long time).
Conclusion
AMD stock peaked at a price of $164.46, which puts my first buy price at $57.56 per share, and my second, deeper buy price at $16.45 per share. As I noted above, these initial positions would be about a 1% portfolio weighting each. I have cash set aside right now that I would likely use for the first purchase, but if we do see that second buy price, I would likely raise cash from a combination of lower-beta and lower-quality positions in my portfolio that wouldn’t offer the same sort of potential upside that AMD does.
Be the first to comment