

Khanchit Khirisutchalual
I’ve been covering AMD (NASDAQ:AMD) in my public articles since I called AMD the new semi-chip bellwether a year ago. I argued Intel (INTC) had too many internal problems to gauge the health of the industry at large, whereas AMD was giving us the pulse on the market and market share shifts through fabless insight. Since then, AMD and Intel’s stocks have been hit hard, but only one is a real investment opportunity. And with AMD’s stock chart showing signs a near-term bottom has been put in, I’ve been adding to my position. In fact, AMD has an upside to $100, or 25% from the $79 area based on the same chart pattern. So the opportunity to accumulate shares or purchase near-the-money calls is here.
Subscribers of Tech Cache get a healthy dose of technical chart analysis. In fact, the last call was AMD dropping from $110 to $73 here and here. It was as clear as day for me as I analyzed the chart and provided guidance for when it would be time to buy puts. Naturally, there are signals to enact a strategy; in this case, it was to wait to see a rejection on the upper side of the channel. That’s precisely what took place, and my subscribers had the opportunity to buy cheap out-of-the-money puts and find insanely massive gains of 500% or more in just four weeks.
The next phase is happening today as AMD bounces off the $73 bottom and heads toward $100 again. To understand this, a picture is worth a thousand words (and maybe a thousand dollars), so let me get right to the chart.
Notice the red circle where the $110 target was hit and the green circle where the $73 target was hit.
stockcharts.com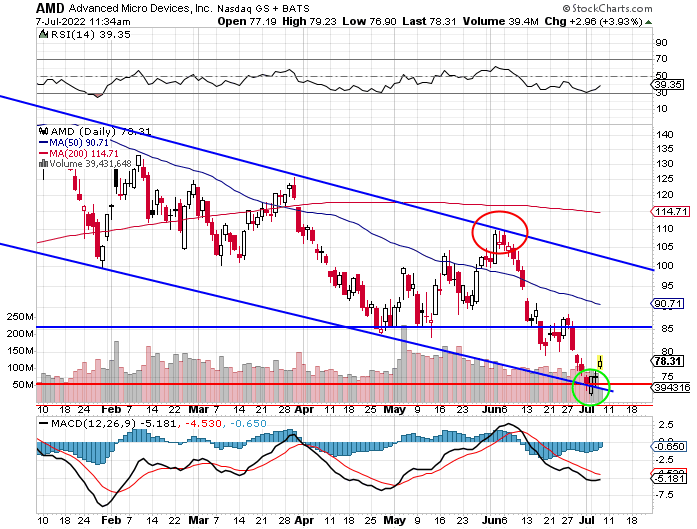
On Thursday, the stock showed confirmation of the bounce off not only the bottom of the descending channel but a long-term support level at $73 stretching back to March and May of 2021 and September and November of 2020. This area seems to have strong support, and a bounce here is not surprising. It just so happened to coincide with the downward channel, providing further support.
You’ll notice I have a horizontal blue line showing a support level when it reached the area in April and May of this year. This is because I was determining if it would be a support level after the move to $110. It’s the same reason I’m keeping an eye on the $73 area. Since it didn’t hold, the bottom of the channel was in play. However, this $73 support level has much more support dating back nearly two years.
stockcharts.com
This leads me to predict the move back to the top of the channel may not see a return to the bottom of the channel. Either the stock is rejected at ~$100 and begins a move back down but doesn’t break the $73 long-term support, or it finally breaks out of the channel to the upside and heads further into triple digits.
Now, diving deeper into the chart picture, the MACD is showing bullish signs. Notice the April low and recent low from this week share a higher low on the MACD. This is called a bullish MACD divergence. It occurs when two lower lows in price are met with two higher lows on the MACD. Of course, there are other variations of this divergence, but this is the most clear-cut example. This further reinforces that selling is exhausting and market sentiment is ready to turn back to the bulls.
stockcharts.com
Now, just like any technical chart analysis, it isn’t guaranteed or perfect. However, AMD’s downward channel is well structured and responds as expected. The risk is the market takes a turn and doesn’t continue to build a base here, dragging with it AMD and other chip stocks. But with Micron (MU) giving terrible forward guidance but rising double-digit percent off the lows since, it is encouraging and provides a fundamental bottom to the story.
AMD’s earnings are a few weeks away, but the industry is finally getting the earnings cuts the market has been waiting for. Typically, this is the time to go long, especially when stocks rise on bad news. Not only do the fundamentals seem to be aligning (even if estimates are cut), but the chart is also showing a shift in near-term sentiment. Medium-term sentiment can be swung if the stock breaks out to the topside of the channel.
The overall picture here is simple. The bounce has provided confirmation to go long, and that’s what I’ve done by adding to my position in the low-$73 area. If the pattern continues to play out as expected, AMD should be back to $100 around September, give or take a few weeks. I don’t expect a straight up move – though it could happen. To that end, there may be moments where the stock falls precipitously, but the trend in the near term should be up. It’s around a 25% gain from Thursday’s levels and maybe more if the stock breaks out of the downward channel.
Perhaps the upcoming earnings report is the catalyst to get it out of the channel and back toward all-time highs. The timing could be interesting as the company will report at the beginning of August.
Be the first to comment