

Jarretera
In this analysis of HelloFresh (OTCPK:HLFFF), we examined the company following the reports of the slowdown of the company’s customer growth but an increase in earnings. We analyzed its growth drivers based on customer growth, AOV and order rate based on its US and International segments.
20%+ Growth in US Segment
|
USA HelloFresh |
2018 |
2019 |
2020 |
2021 |
2022F |
2023F |
2024F |
|
Customers (‘mln’) |
1.11 |
1.50 |
2.43 |
3.63 |
4.00 |
4.57 |
5.14 |
|
Growth % (YoY) |
39.06% |
35.06% |
61.73% |
49.28% |
10.20% |
14.29% |
12.50% |
|
Order Rate |
3.33 |
3.48 |
4.03 |
4.10 |
4.34 |
4.58 |
4.85 |
|
Order Rate Growth % (YoY) |
0.76% |
4.51% |
15.83% |
1.86% |
5.74% |
5.74% |
5.74% |
|
AOV (EUR) |
48.90 |
49.30 |
53.55 |
55.65 |
56.83 |
58.03 |
59.25 |
|
AOV Growth % (YoY) |
-4.91% |
0.82% |
8.62% |
3.92% |
2.11% |
2.11% |
2.11% |
|
Revenue (EUR mln) |
722.94 |
1,027 |
2,077 |
3,307 |
3,939 |
4,861 |
5,905 |
|
Revenue Growth % (YoY) |
33.15% |
42.11% |
102.17% |
59.23% |
19.11% |
23.40% |
21.47% |
Source: HelloFresh, Khaveen Investments
HelloFresh’s US segment revenue represented 59.65% of its total revenue in Q2 2022. In the past 4 years, the company had an average customer growth of 46.3%. According to Statista,
due to measures imposed during the pandemic, orders of meal kits through online platforms increased significantly in the United States.
We believe HelloFresh benefited from this surge as the company is the market leader with a share of 71.5% in 2022 and had grown from 22% in 2015. However, its order rate and AOV growth had been stagnant at an average of 5.74% and 2.11% respectively. We analyzed the company and compared it with competitors based on average pricing, NPS score, customer reviews and number of customers.
|
Competitor Analysis |
Company Revenue ($ mln) |
Average Price ($) |
NPS Score |
Customer Reviews (Out of 5) |
Customers (‘mln’) |
|
HelloFresh |
3,294.10 |
8.99 |
5.00 |
3.80 |
3.50 |
|
Blue Apron |
470.38 |
9.99 |
22.00 |
3.50 |
0.35 |
|
HomeChef |
148.00 |
6.99 |
0.00 |
3.70 |
0.22 |
|
Sun Basket |
592.00 |
9.99 |
-50.00 |
4.50 |
0.42 |
|
Marley Spoon |
322.4* |
8.99 |
48.00 |
3.50 |
0.38 |
|
Average |
1,126.12 |
8.99 |
5.00 |
3.80 |
0.97 |
*EUR
Source: Company Data, ZoomInfo, Consumer Affairs, Khaveen Investments
As seen in the table, HelloFresh has the highest revenue at $3.3 billion followed by Sun Basket. The company also has the highest number of customers at 3.5 million which is more than 3 times the average of 0.97 million. However, HelloFresh’s average price, NPS score and customer reviews are all on par with the average. Thus, we believe the company’s advantage is only in terms of its size and scale. Furthermore, we analyzed the company’s quarterly growth based on customers, order rate and AOV.
|
USA HelloFresh |
Q1 ’21 |
Q2 ’21 |
Q3 ’21 |
Q4 ’21 |
Q1 ’22 |
Q2’22 |
Average |
|
Customers (‘mln’) |
3.69 |
3.82 |
3.48 |
3.52 |
4.25 |
4 |
|
|
Customer Growth % (YoY) |
39.77% |
92.93% |
39.76% |
34.87% |
15.18% |
4.71% |
50.34% |
|
Order Rate |
4.1 |
4.1 |
4.1 |
4.1 |
4.1 |
4.1 |
|
|
Order Rate Growth % (YoY) |
20.59% |
-8.89% |
2.50% |
-2.38% |
0.00% |
0.00% |
5.01% |
|
AOV (EUR) |
53.1 |
54.4 |
55.9 |
59.2 |
63.1 |
70.3 |
|
|
AOV Growth % (YoY) |
9.03% |
-8.11% |
6.07% |
10.45% |
18.83% |
29.23% |
3.25% |
|
Revenue (EUR mln) |
803.3 |
852.0 |
797.6 |
854.4 |
1099.5 |
1152.9 |
|
|
Revenue Growth % (YoY) |
36.73% |
6.06% |
-6.39% |
7.12% |
28.69% |
4.86% |
11.87% |
Source: HelloFresh, Khaveen Investments
In Q1 and Q2 2022, the company’s customer growth had slowed to 15.18% and 4.7% which was below its quarterly average of 50.34% over the past 20 quarters. According to Washington Post, there is a rise of more startups as “there are now more than 150 companies in the industry”.
Additionally, its order rate had been stagnant in the past 2 quarters, but its AOV had surged at 18.8% and 29.23%. Recently, the company has introduced an expanded menu option with HelloFresh Online, allowing for grocery shopping which includes breakfast, lunch and snack options in their list of products.
Overall, we projected its customer growth in 2022 based on the prorated average customer increase in Q1 and Q2 and its growth beyond 2022 based on a 5-year average increase of 0.57 million which is a slowdown compared to the period of high growth boosted by the pandemic. Additionally, we projected its order rate and AOV to grow based on its 4-year historical average as the company introduced an expanded menu option for customers. In total, we projected its US segment to have a 3-year forward average growth of 21.3% through 2024.
International Growth Slowing
|
International HelloFresh (Yearly) |
2018 |
2019 |
2020 |
2021 |
2022F |
2023F |
2024F |
|
Customers (‘mln’) |
0.78 |
1.12 |
2.23 |
3.65 |
4.06 |
4.64 |
5.22 |
|
Growth % (YoY) |
55.00% |
44.19% |
99.78% |
63.61% |
11.23% |
14.29% |
12.50% |
|
Order Rate |
3.88 |
3.75 |
4.00 |
4.00 |
3.94 |
3.88 |
3.83 |
|
Order Rate Growth % (YoY) |
-9.36% |
-3.23% |
6.67% |
0.00% |
-1.48% |
-1.48% |
-1.48% |
|
AOV (EUR) |
44.85 |
46.88 |
46.83 |
46.38 |
47.20 |
48.05 |
48.91 |
|
AOV Growth % (YoY) |
3.70% |
4.52% |
-0.11% |
-0.96% |
1.79% |
1.79% |
1.79% |
|
Revenue (EUR mln) |
538.57 |
786.58 |
1,686 |
2,712 |
3,023 |
3,464 |
3,908 |
|
Revenue Growth % (YoY) |
45.89% |
46.05% |
114.35% |
60.85% |
11.47% |
14.61% |
12.82% |
Source: HelloFresh, Khaveen Investments
Besides the US, the company’s international segment accounted for the remainder of its revenues at 40% of total revenues. In the past 4 years, the company had an average customer growth of 65.6%, higher than its US segment. However, its order rate and AOV growth had been lower at an average of -1.48% and 1.79% respectively.
|
International HelloFresh |
Q1 ’21 |
Q2 ’21 |
Q3 ’21 |
Q4 ’21 |
Q1 ’22 |
Q2’22 |
Average |
|
Customers (‘mln’) |
3.59 |
3.86 |
3.46 |
3.7 |
4.27 |
4 |
|
|
Growth % (YoY) |
33.96% |
7.52% |
-10.36% |
6.94% |
15.41% |
-6.32% |
11.71% |
|
Order Rate |
4 |
4 |
3.9 |
4.1 |
4 |
3.9 |
|
|
Order Rate Growth % (YoY) |
-4.76% |
0.00% |
-2.50% |
5.13% |
-2.44% |
-2.50% |
-0.33% |
|
AOV (EUR) |
45.2 |
46 |
46.5 |
47.8 |
47 |
49.9 |
|
|
AOV Growth % (YoY) |
-4.03% |
1.77% |
1.09% |
2.80% |
-1.67% |
6.17% |
0.70% |
|
Revenue (EUR mln) |
649.1 |
710.2 |
627.5 |
725.1 |
802.8 |
778.4 |
0.0 |
|
Revenue Growth % (YoY) |
22.43% |
9.42% |
-11.65% |
15.56% |
10.71% |
-3.03% |
12.20% |
Source: HelloFresh, Khaveen Investments
Based on the quarterly breakdown of its international segment, the company’s customer growth slowed down in Q2 2021 and declined in Q3 2021 but recovered to positive growth through Q1 2022. Though, its customer growth further declined in Q2 2022. In the past 5 years, Hellofresh has been rapidly expanding to new markets such as Luxembourg (2017), France & Australia (2018), Sweden (2019), Denmark (2020), Norway & Italy (2021), Japan (2022). The expansion into Japan marks its first entry into Asia.
Our unique diversification across geographies, brands and business models has allowed us to navigate an incredibly volatile macroeconomic environment and continue our strong and profitable growth path into 2022 – Dominik Richter, CEO
Though its order rate had declined in the past 6 quarters while its AOV had strong growth in Q2 2022 at 6.17% compared to its average of 0.7%. We projected its customer growth in 2022 based on the prorated average customer increase in Q1 and Q2 and its growth beyond 2022 based on a 5-year average increase of 0.58 million. We projected its order rate and AOV to grow based on its 4-year historical average. Thus, this represents a 3-year forward average growth of 13% for the company’s International segment.
Improving Profitability
Although the company’s growth had slowed down, its profitability had consistently improved in the past 8 years but declined in 2021.
HelloFresh, Khaveen Investments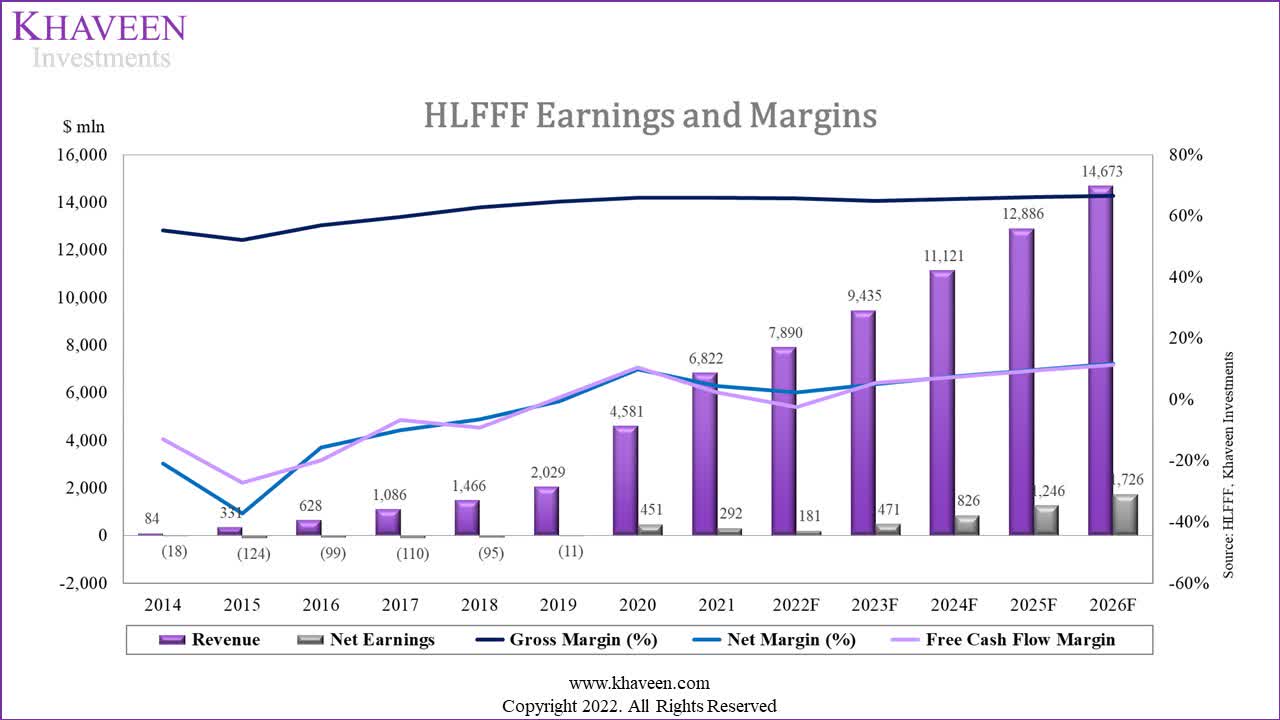
|
Earnings & Margins |
2014 |
2015 |
2016 |
2017 |
2018 |
2019 |
2020 |
2021 |
|
Gross Margin (%) |
55.28% |
52.08% |
56.89% |
59.57% |
62.82% |
64.59% |
65.95% |
65.86% |
|
EBIT Margin |
-22.66% |
-37.86% |
-15.12% |
-9.81% |
-6.40% |
-1.36% |
11.34% |
6.51% |
|
Net Margin (%) |
-20.88% |
-37.32% |
-15.71% |
-10.14% |
-6.45% |
-0.56% |
9.84% |
4.27% |
|
Free Cash Flow Margin |
-13.05% |
-27.29% |
-19.93% |
-6.65% |
-9.17% |
0.65% |
10.37% |
2.20% |
Source: HelloFresh, Khaveen Investments
Based on the table, the company’s profitability had improved with its EBIT, net and FCF margin turning positive in 2019 and 2020. However, its margins declined in 2021. We analyzed its profitability based on the company’s expense breakdown.
HelloFresh, Khaveen Investments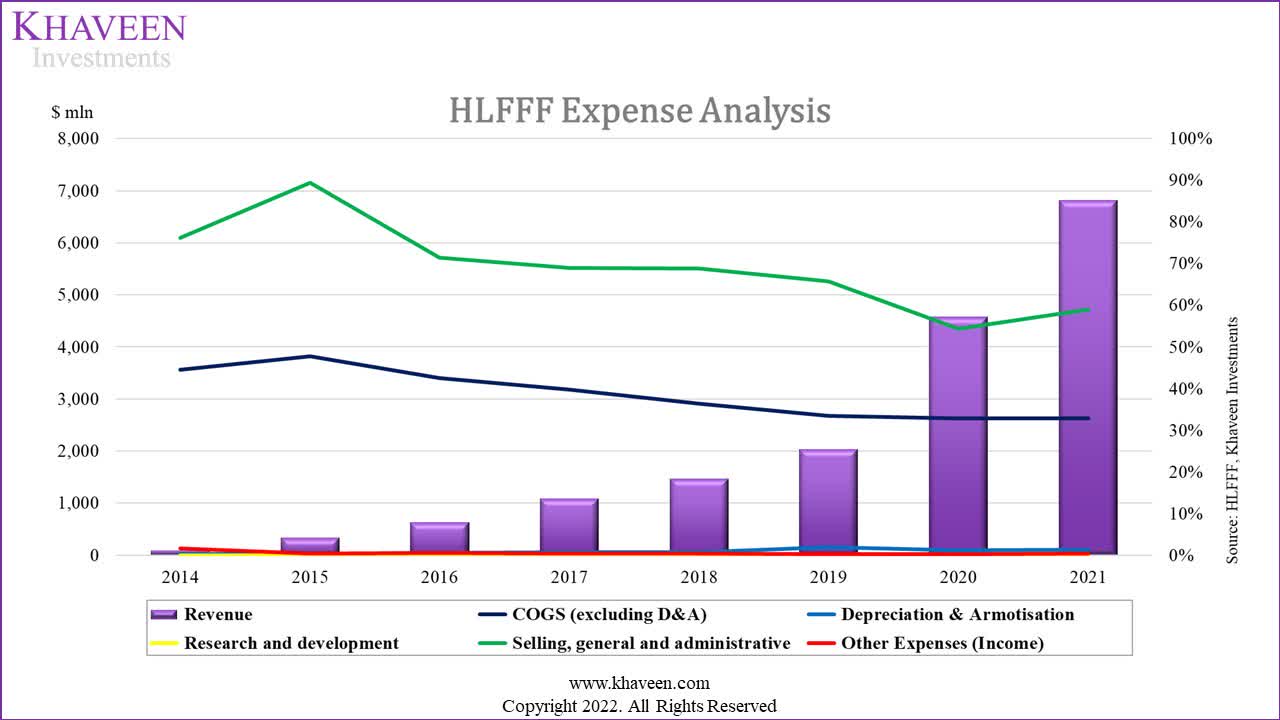
The company’s SG&A expenses are its largest expense and represented 59% of revenue in 2021 followed by COGS. Apart from 2015 and 2021, its SG&A expense as a % of revenue had continued to decline while its COGS as a % of revenue declined since 2016. In 2021, the company stated that its fulfillment expenses which accounted for 44.7% of revenues increased by 120 basis points due to new facilities and an increase in wages.
We believe its margins could continue expanding in the future as the company highlighted its focus on automation for product handling. Additionally, the company adopts a 3P model for its logistics capabilities which “can provide lower cost per order when compared to internally managed operations” and benefit the company with volume discounts according to F.Curtis Barry & Company. We forecasted the company’s margins to improve beyond 2022 with an average decline of its COGS as a % of revenue by -0.9% based on its 2-year average as it had declined from a 7-year average of -4.06%. Whereas for its SG&A expenses, we based its average decline on its 7-year average of -2.85%. Overall, we forecasted its gross margins to improve to 66.47% and its net margins at 11.76% by 2026.
Risk: Increasing Competition
We believe the company could face increasing competition risk with the rise in startups with more than 150 companies in the food meal kit market according to Washington Post. We believe this is due to the low initial startup costs required for operating an e-commerce business. Based on our analysis above, we believe the company’s advantage is its scale but its pricing and customer satisfaction in only average. Furthermore, competitors such as Blue Apron (APRN) had recently partnered with Walmart (WMT) to introduce its meal kits to Walmart’s online marketplace customers which could pose a risk to HelloFresh.
Verdict
|
HelloFresh Revenue Projections (EUR mln) |
2018 |
2019 |
2020 |
2021 |
2022F |
2023F |
2024F |
|
HelloFresh US |
722.94 |
1,027 |
2,077 |
3,307 |
3,939 |
4,861 |
5,905 |
|
Growth % |
42.1% |
102.2% |
59.2% |
19.1% |
23.4% |
21.5% |
|
|
HelloFresh International |
538.57 |
786.58 |
1,686 |
2,712 |
3,023 |
3,464 |
3,908 |
|
Growth % |
46.1% |
114.3% |
60.8% |
11.5% |
14.6% |
12.8% |
|
|
Total |
1,262 |
1,814 |
3,763 |
6,019 |
6,962 |
8,325 |
9,813 |
|
Growth % |
43.8% |
107.5% |
60.0% |
15.7% |
19.6% |
17.9% |
Source: HelloFresh, Khaveen Investments
All in all, we expect HelloFresh’s total revenue growth to slow down through 2024 following the surge in growth experienced during the pandemic period. We forecasted this to be driven by slowing customer growth in both US and International segments. Notwithstanding, we expect the company’s gross margins to improve by 66.47% and its net margins at 11.76% by 2026 as it focuses on automation and its e-commerce business based on a 3P model. However, based on analyst consensus, its average price target is EUR54.47 with an upside of 150%.
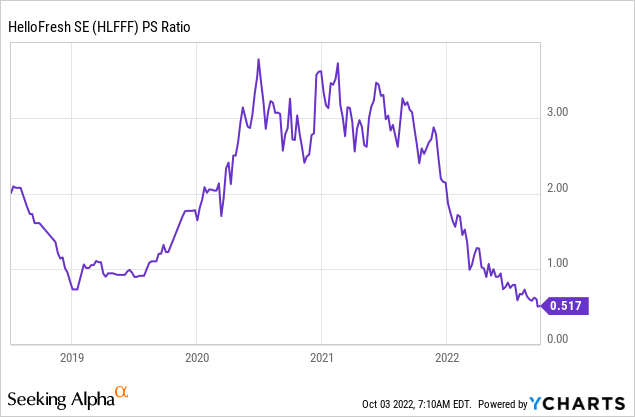
The company’s stock price had declined by 75% YTD. Also, the company’s P/S ratio had decreased to 0.51x (‘TTM’) following the decline of its stock price and is much lower compared to its 5-year average P/S of 1.97x. Thus, we believe its upside is supported by its past reduction in its share price and low P/S multiple and rate the company as a Strong Buy.
Be the first to comment