

Cindy Ord
Introduction
In this article we review our investment case on Comcast Corporation (NASDAQ:CMCSA).
Comcast’s share price is below what it was five years ago, having fallen 44% from its peak last September. Compared to when we initiated our Buy rating in January 2020, CMCSA stock has lost 16% (after dividends):
|
Comcast Share Price (Last 5 Years) 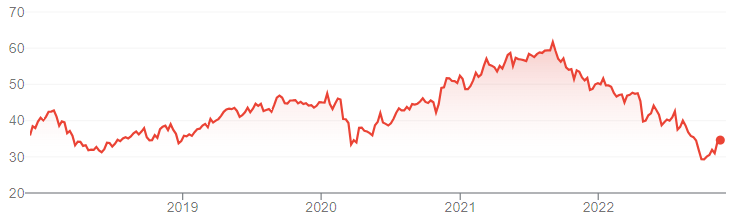 Source: Google Finance (20-Nov-22). |
The collapse in Comcast’s shares is an example of a “growth” stock having fallen to become a “value” stock.
The core Cable business has slowed significantly, with broadband subscriber net adds falling to close to zero since Q2 2022. We believe this is largely due to macro factors, Cable’s current earnings are not at risk and will likely still grow at low-single-digits. In NBCU Universal, Theme Parks and Studios are recovering strongly, but Media EBITDA has shrunk substantially due to rising Peacock losses and cord-cutting. In Sky, a solid U.K. business is offset by downsizing in Italy and Germany. Q4 is seeing further near-term headwinds with Hurricane Ian in the US and weak macro in Europe. Comcast shares are at a 10.0x P/E, a 10.0% Free Cash Flow (“FCF”) Yield and a 3.1% Dividend Yield. Our reduced forecasts indicate a total return of 68% (18.8% annualized) by 2025 year-end. Buy.
Comcast Buy Case Recap
We had seen Comcast as a multi-year compounder with defensive qualities, driven mainly by its U.S. Cable Communications (“Cable Comms”) business, but with good growth in NBC Universal (“NBCU”) and Sky as well.
Cable Comms has been the core driver for Comcast, with an EBITDA CAGR of 7.5% in 2017-21 and contributing two thirds of segment EBITDA in pre-COVID 2019; NBCU and Sky contributed 25% and 9% respectively that year:
|
Comcast EBITDA by Segment (2012-21) 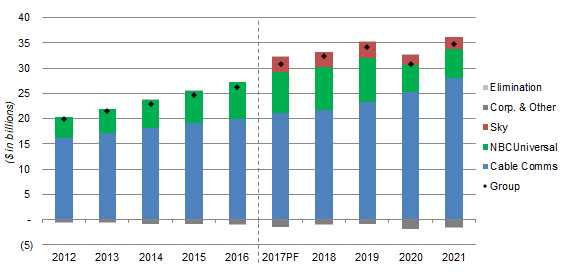 Source: Comcast company filings. |
Cable Comms EBITDA growth has historically been driven by continuing subscriber net adds (through both new households passed and rising penetration), a growing Average Revenue Per User (“ARPU”) (through both price increases and upgrades), Business Services growth and an expanding margin (through natural operational leverage).
Cable Comms has historically been a defensible business, as its competitive speeds, existing customer base and low incremental unit costs make it very difficult for new entrants to achieve an adequate Return on Investment.
COVID-19 boosted growth in Cable Comms by increasing home connectivity demand, but significantly disrupted parts of NBCU and Sky. These trends have since reversed, with broadband subscriber net adds decelerating but NBCU and Sky showing a strong rebound. Within NBCU, Media faces the same headwinds from cord-cutting and “streaming wars” as the rest of the sector, and Comcast’s own Peacock streaming service has rising losses, but Media contributed just 11% of group EBITDA year-to-date.
In the 7 months since our last update after Q1 2022 results, the share price has fallen by another 22%. Group P&L has continued to show strong headlines, but Cable Comms’ growth has slowed significantly.
Comcast Results Headlines
Comcast’s group P&L has continued to show strong headlines. As of Q3 year-to-date, Adjusted EBITDA has grown 8.2%, Adjusted Net Income has grown 9.7% and Adjusted EPS has grown 14.4% year-on-year in U.S. dollars, despite currency headwinds. Compared to pre-COVID Q1-3 2019, Adjusted EPS is 20.8% larger:
|
Comcast Financial Headlines (Q3 YTD 2022 vs. Prior Years) 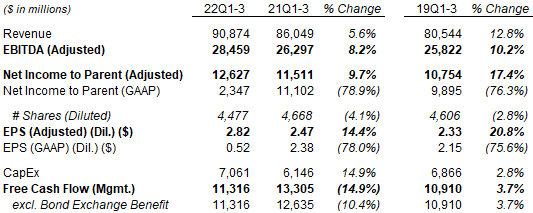 Source: Comcast results releases. |
Group FCF is lower year-on-year largely due to higher NBCU CapEx, higher tax and higher working capital (including content costs), with the last of these partly a result of normalization from atypical lows during the pandemic.
Similarly strong headlines can be seen from the Q3 2022 results alone, with Adjusted EBITDA up 5.9%, Adjusted Income up 4.5% and Adjusted EPS up 11.4% year-on-year; excluding currency, Adjusted EBITDA was up 8% and Adjusted EPS was up 12% year-on-year:
|
Comcast Financial Headlines (Q3 2022 vs. Prior Years) 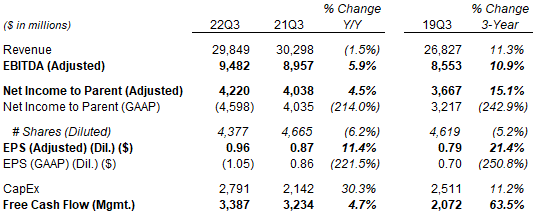 Source: Comcast results releases. |
(Q3 GAAP EPS was negative due to an $8.58bn impairment on Sky, which Comcast acquired in 2018 for $39.4bn, as a result of worsening U.K. and European economic conditions.)
To understand the recent decline in Comcast’s share price, we need to look at each segment more closely.
Comcast Cable’s Significant Slowdown
Comcast’s core Cable business has slowed significantly in the past two quarters.
In Q3 2022, Cable Comms EBITDA was just 5.4% higher year-on-year, a much lower growth rate than the approximately 7-11% seen in 2019-21. Compared to pre-COVID 2019, growth rates in households passed and in ARPU were similar, but Broadband subscriber growth was about 3.5 ppt lower:
|
Comcast Cable Comms Key Growth Rates (2017 to Q3 2022)  Source: Comcast results releases. NB. Wireless included in EBITDA growth rate calculations from 2018 onwards. |
Even the 5.4% figure likely overstates Cable Comms’ current growth rate because, as a year-on-year figure, it benefited from four quarters of broadband subscriber growth, but the latter has slowed to almost zero since Q2 2022:
|
Comcast Cable Customer Net Adds by Category (Since Q3 2019) 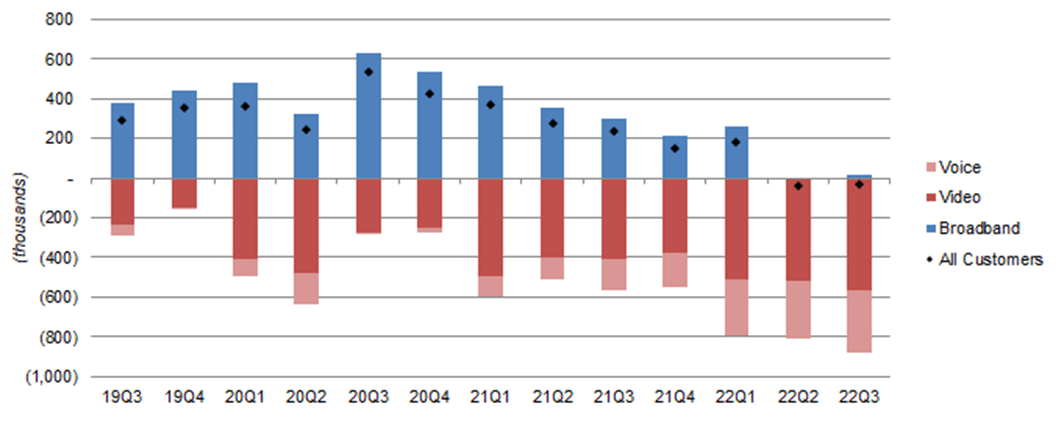 Source: Comcast company filings. |
The same dynamics have also been visible at Charter (CHTR), the other large U.S. Cable operator, since Q2. Recent investor fears have concentrated on whether U.S. Cable broadband subscribers are now in structural decline and, were this to be the case, what it could mean for U.S. Cable earnings.
Comcast management believes the deceleration in broadband net adds has been due to a macro-driven, market-wide slowdown in net adds, with competition having only a marginal impact, while churn in Comcast’s existing broadband subscriber base remains at historically low levels. As CEO Brian Roberts explained on the Q2 earnings call:
“While churn remains well below 2019, connect activity was also lower than what we generally see in the second quarter. We believe this is primarily the result of 3 factors:
The first category is move activity … there’s been a dramatic slowdown in moves across our footprint … Our win share of new customer acquisition opportunities remains high, but the slowdown in moves has resulted in fewer of these jump balls. And this has had the largest impact on our gross connects.
The second category is a reversal of some pandemic trends … particularly at lower income levels … And we have also seen some give back to a normalization of mobile substitution.
The last bucket is increased competition. Fixed wireless is a new entrant in the marketplace … We are not seeing fixed wireless have any discernible impact on our churn but its early growth appears to be another contributor to our lower connect activity”
Sector broadband net add figures support this view. Net wireline broadband net adds at AT&T (T) and Verizon (VZ) have remained low, suggesting their fiber overbuild is not a material reason for lower Comcast net adds; Fixed Wireless Access (“FWA”) net adds have grown substantially since 2022, but we believe many of these represent either incremental customers who would not have signed up to wireline broadband anyway, or losses from less competitive Cable operators like Altice USA (ATUS):
|
Wireline & Fixed Wireless Broadband Net Adds – Key Players (Since Q2 2019) 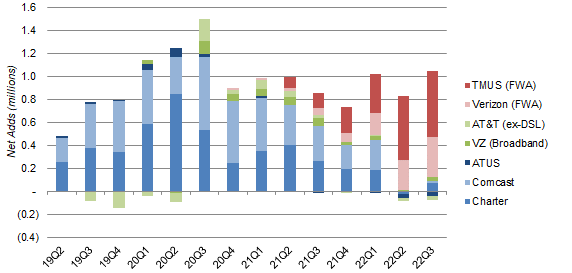 Source: Company filings. NB. Comcast Q1 2022 figure includes one-third benefit from end of COVID free programs. |
Separating fiber and non-fiber figures in AT&T and Verizon’s wireline broadband net adds, we can see that for Verizon, fiber net adds have also halved year-on-year in 2022 and, for AT&T, rising fiber net adds have been more than offset by rising non-fiber net losses:
|
AT&T & Verizon Broadband Subscriber Gains/Losses – Fiber vs. Non-Fiber 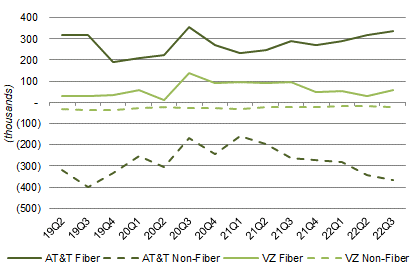 Source: Company filings. NB. AT&T DSL losses no longer discussed from 2022; was 19k in Q4 2021. |
Comcast’s Cable earnings will likely continue to grow, because the other historic earnings drivers – ARPU, Business Services and margin expansion – remain largely intact. In addition, Comcast now has a new additional revenue driver, Wireless, which has been growing at strong double-digits and became EBITDA-positive in Q1 2021.
Cable Comms’ financials for Q3 2022 show how these dynamics work in practice. Year-on-year, Broadband revenue growth of 5.7% ($334m) was augmented by Wireless revenue growth of 30.8% ($186m), while slower or negative growth in costs helped EBITDA margin expand 119 bps year-on-year, giving an Adjusted EBITDA growth of 5.4%:
|
Comcast Revenues and EBITDA (Q3 2022 vs. Prior Periods) 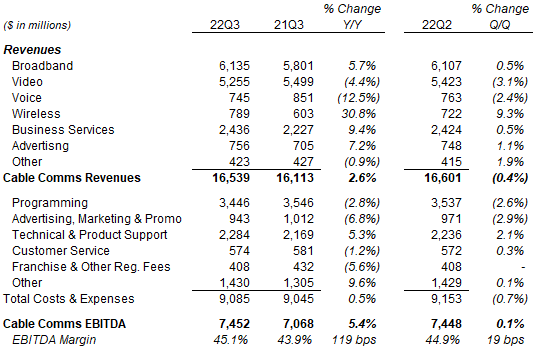 Source: Comcast results schedule (Q3 2022). |
Q3 2022 was helped by good Broadband subscriber growth up to Q1 2022, Advertising revenues from political ads in an election year as well as revenues from the Masergy acquisition (which closed at the start of Q4 2021); on the other hand, inflation is atypically high this year and bad debt is normalizing up to pre-COVID levels. Overall, excluding one-offs, we believe current trends support a low-single-digit year-on-year EBITDA growth.
CEO Brian Roberts made a similar comment on the Q3 earnings call:
“There have been 4 primary drivers of revenue growth at our Cable segment: residential broadband units, residential broadband ARPU, wireless and business services. And while we don’t anticipate residential broadband units to be a significant driver for now, we expect to maintain healthy growth in the other three, leading to continued strong financial performance at Cable for the foreseeable future.”
Management is also preparing to cut costs across the group, having warned of restructuring charges to come in Q4.
Comcast is also continuing to upgrade its Cable infrastructure to ensure its competitiveness. In addition to the 1 Gbps download speed already available across its network, Comcast is pursuing:
- Mid-split upgrades that will allow multi-Gbps downloads and 200-300 Mbps uploads (up to 10x faster than at present); this will be available in 20% of its footprint by 2022 year-end and the “vast majority” of it by 2025 year-end
- DOCSIS 4.0 upgrades that will allow multi-Gbps downloads and uploads; the roll-out of this will start in H2 2023
Importantly, these upgrades will cost relatively little. Management expects Cable Comms “capital intensity” (CapEx / revenues) to be “around 11%” in future years, in line with recent years. In addition, Comcast’s Chief Network Officer Elad Nafshi disclosed this month at an investor conference that the total costs of mid-split and DOCSIS 4.0 upgrades will be “less than $200 a home passed”, which implies a total of $12.2bn over time for the current 61.1m homes passed – equivalent to less than 1.5x 2021 group CapEx ($9.18bn).
We now believe Cable Comms EBITDA growth will be around 4% annually over time (was 6.5%).
NBC Universal Is A Mixed Bag
Comcast’s NBCU segment is a mixed bag, with Theme Parks and Studios recovering strongly, but Media declining.
NBCU segment EBITDA has recovered from the lows in 2020, but remained below 2019 levels in Q3 2022. The mix is also different, with a much stronger contribution from Theme Parks and Studios, but Media EBITDA having halved:
|
NBCU EBITDA by Segment (Since Q3 2019) 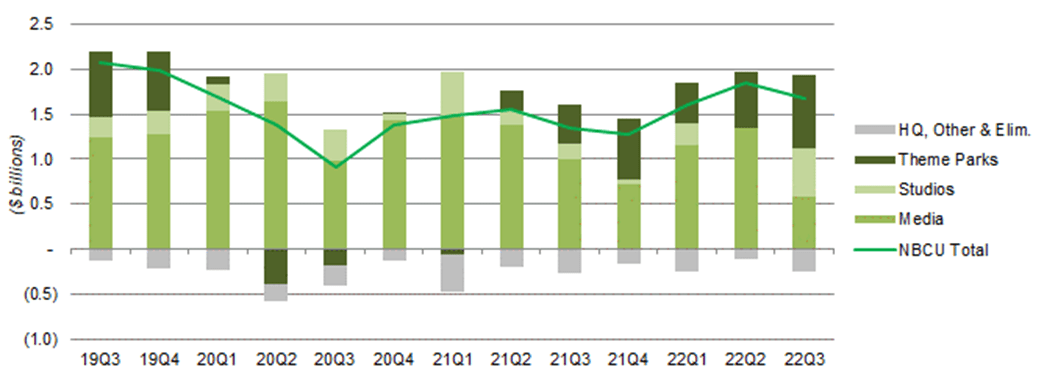 Source: Comcast company filings. |
The table below compares financials in NBCU’s businesses across Q3 of 2022, 2021 and 2019:
|
NBCU Revenues & EBITDA by Segment (Q3 2022 vs. Prior Years) 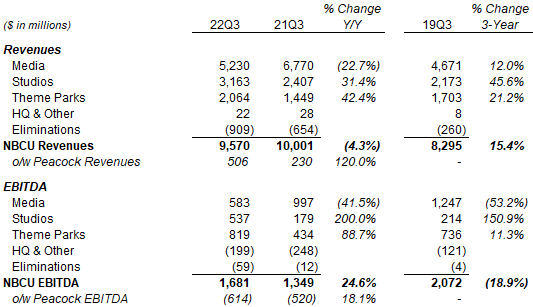 Source: Comcast company filings. |
Media EBITDA was 41.5% lower year-on-year and 53.2% lower than in 2019. A slight decline in the traditional business, caused by continuing cord-cutting among subscribers, is made much worse by rising losses at Peacock, which lost $614m in the quarter. Peacock is still expected to lose $2.5bn this year (compared to $1.72bn in 2021).
|
Media Revenues & EBITDA – Peacock vs. Non-Peacock (Since 2020) 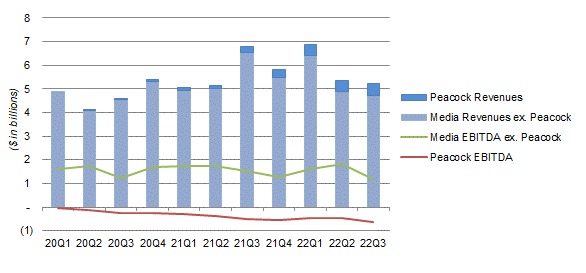 Source: Comcast company filings. |
The future of Peacock is unclear. With just 15m paying subscribers (compared to Disney+ (DIS) having 46.4m in North America alone and 164.2m globally), Peacock is much smaller than its main competitors. (However, it is running smaller losses; Disney’s Direct-to-Consumer business lost $4.02bn in FY22.) Competition may get worse in Q4 with the launch of ad-supported products at both Netflix (NFLX) and Disney+, following Peacock’s model. The sector is spending too much on content and, while some companies (notably Warner Bros. Discover (WBD) and Paramount (PARA)) are already having to scale back, the presence of deep-pocked players including Apple (AAPL) and Amazon (AMZN) mean intense competition may continue. However, Media was now just 11% of group EBITDA in Q3.
Studios EBITDA hit a record $537m in Q3, thanks to theatrical revenues from a huge summer box office led by hits such as Jurassic World and Minions, as well as higher content licensing revenues from better carryover titles, acceleration in film windows and growth in television licensing. While Studios EBITDA is volatile, it has rebounded from pandemic lows and is performing solidly.
Theme Parks EBITDA rose 88.7% year-on-year and was 11.3% higher than in 2019. Among its parks, Orlando hit a record Q3 EBITDA, Tokyo rebounded from prior-year capacity restrictions, and Beijing (which opened in September 2021) had its first profitable quarter. The business will continue to benefit from expansions, with Super Nintendo World to be added to Hollywood (2023) and Tokyo (2024), and Epic Universe to be added to Orlando (2025).
Year-to-date, NBCU EBITDA is up 17.0%, driven by similar dynamics described for Q3, but with Studios EBITDA lower year-on-year due to a Q2 that just broke even after higher production and pre-release marketing costs.
|
NBCU Revenues & EBITDA by Segment (Q3 YTD 2022 vs. Prior Years) 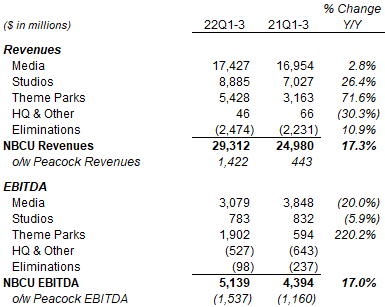 Source: Comcast company filings. |
Our views on NBCU businesses’ future EBITDA remain unchanged, including:
- Media EBITDA to fall by $1bn in 2022 and $750m in 2023, then stay flat
- Studios EBITDA to be $1bn in 2022 and then grow at 6.0% annually
- Theme Parks EBITDA to be $2.5bn by 2023, then grow at 10% annually
Sky: Mediocre Acquisition, Getting Worse
Sky has proved to be a mediocre acquisition, with solid U.K. business is offset by downsizing in Italy and Germany.
For Q3 year-to-date, Sky’s EBITDA remained 4.5% lower than in 2019 (or 6.5% lower in U.S. dollars). The number of customers has fallen slightly, with growth in the U.K. offsetting losses in Italy and Germany, the latter partly due to a scaling down of Sky’s Serie A and Bundesliga football rights; revenues have followed the same dynamic, with Content revenues substantially lower again due to the downsizing in sports:
|
Sky Revenues, EBITDA & Customers (Q3 YTD 2022 vs. Prior Years) 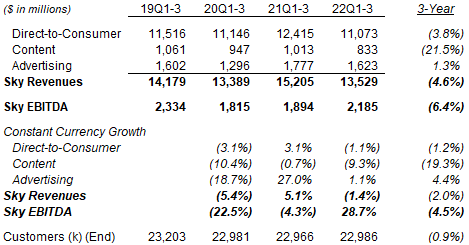 Source: Comcast company filings. |
The latest quarter saw relatively stable Direct-to-Consumer revenues and higher Content revenues “primarily” due to licensing timing. However, EBITDA fell 15.5% in local currency “primarily” due to football rights costs being shifted to Q3 to accommodate this year’s World Cup; this would mean lower costs for Q4, but higher costs again in H1 2023:
|
Sky Revenues, EBITDA & Customers (Q3 2022 vs. Prior Years) 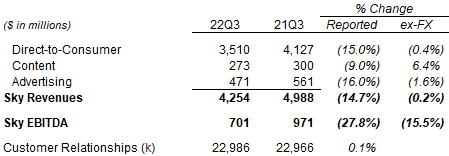 Source: Comcast results release (Q3 2022). |
An $8.58bn impairment was recorded for Sky in Q3 due to challenging economic conditions in the U.K. and Europe, which resulted in much higher discount rates being used in the annual impairment test.
Sky had a stated goal to “more than double” EBITDA from 2020 levels “over the next several years”. (Sky’s EBITDA was $2.0bn in 2020, having fallen from 2019’s $3.1bn due to COVID-19.) This now looks at risk, though we had already assumed this would not be fully achieved.
Further Near-Term Headwinds
Comcast will face a number of further near-term headwinds:
- Hurricane Ian in September/October has significantly impacted Southwest Florida, where Comcast is the primary Cable operator. Management expects to see “tens of thousands” lost in broadband subscribers as a result, and an overall broadband subscriber net loss in Q4
- COVID-related restrictions in China will likely disrupt NBCU’s park in Beijing, after a significant rise of cases in that city and the reimposition of many restrictions; the park has temporarily closed since October 26
- U.K. macroeconomic headwinds will likely have a negative impact on Sky’s business
These headwinds may translate to further short-term pressures on Comcast’s share price.
Comcast Valuation: A Value Stock with 10x P/E
At $34.50, Comcast now has a 10.0x P/E and a 10.0% Free Cash Flow (“FCF”) relative to 2021 financials:
|
Comcast Earnings, Cashflows & Valuation (Since 2019) 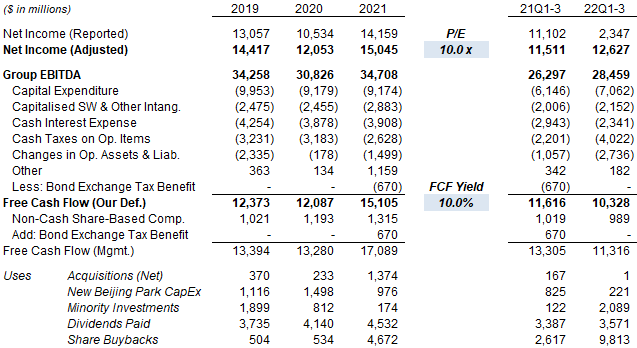 Source: Comcast company filings. |
Comcast pays a dividend of $1.08 (which was raised 8% in January), representing a Dividend Yield of 3.1%.
For Q3 year-to-date, FCF (on our definition) is $1.29bn lower year-on-year, with a $2.16bn higher EBITDA reduced by $0.92bn in higher CapEx (mostly in NBCU), $1.15bn in higher taxes (excluding the bond exchange benefit last year), and $1.68bn in higher working capital outflows (including content costs), offset by $0.60bn in lower cash interest.
Share repurchases have so far totaled $9.8bn (including $3.5bn in Q3), already more than double the level for full-year 2021 ($4.7bn) (buybacks were resumed in Q2 2021). Comcast has authorized an additional $10bn of buybacks in September, equivalent to 6.7% of the current market capitalization.
Comcast Balance Sheet
Comcast has a Net Debt / EBITDA of 2.3x, just below the “around 2.4x” that management is targeting.
Rising interest rates will have little impact on Comcast. The vast majority of Comcast’s debt is fixed rate, and the average maturity is 18 years:
|
Comcast Debt Maturity & Interest Rates (2021 Year-End) 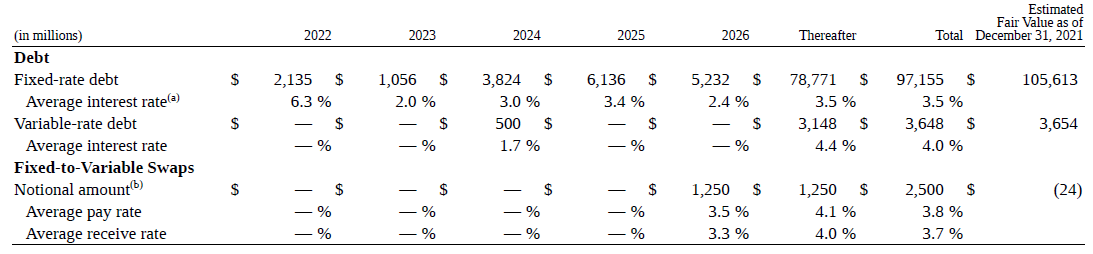 Source: Comcast 10-K filing (2021). |
Including derivatives, the average interest rate on Comcast’s debt is 3.44% (as of 2021 year-end).
Comcast P&L Forecasts
We substantially reduce our forecasts to reflect lower growth in Cable Comms and Sky. We now assume:
- 2022 Cable Comms EBITDA growth to be 6.0% (was 6.5%)
- 2023-25 Cable Comms EBITDA growth to be 4.0% (was 6.5%)
- Media EBITDA to fall $1bn in 2022 and $750m in 2023, then stay flat
- Studios EBITDA to be $1bn in 2022 and then grow at 6.0% annually
- Theme Parks EBITDA to be $2.5bn by 2023, then grow at 10% annually
- 2022 Sky EBITDA to be $2.7bn (was $3.0bn)
- 2023-25 Sky EBITDA Growth to be 5.0% (was 8.0%)
- Cash interest expense to be $4.00bn in 2022 (was $4.88bn) then grow at 7% annually
- CapEx to grow at 6% annually (was 7%)
|
Comcast Illustrative 2022-25 Forecasts 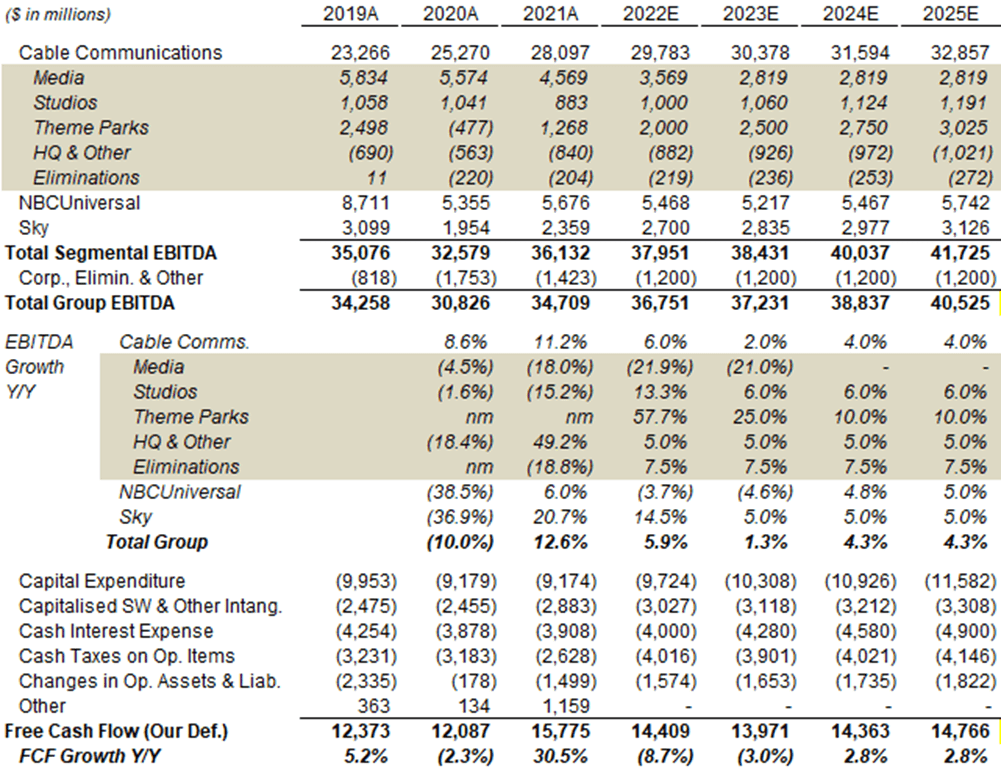 Source: Comcast company filings, Librarian Capital estimates. |
Our forecasts now imply an EBITDA CAGR of just 3.9% in 2021-25, while 2025 FCF will be only 19% higher than that in 2019.
Comcast Stock Forecasts
We use the P&L forecasts from above and also assume:
- From 2022, share count to be reduced by 6% a year (was 4.5%)
- Dividend Payout Ratio to be 33.0%
- 2025 FCF Yield of 7.5% (was 6.0%)
Our new 2025 FCF/Share forecast is $4.06, 7% lower than before ($4.38).
|
Illustrative Comcast Return Forecasts 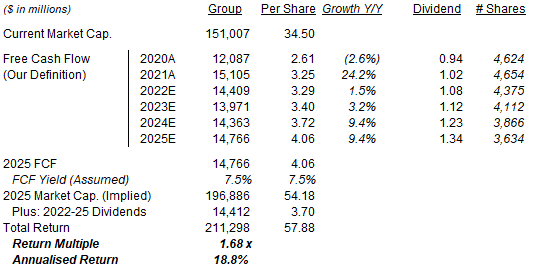 Source: Librarian Capital estimates. |
With shares at $34.50, we expect an exit price of $54 and a total return of 68% (18.8% annualized) by 2025 year-end.
Is Comcast Stock A Buy? Conclusion
We reiterate our Buy rating on Comcast stock.
Be the first to comment