

Jian Fan/iStock via Getty Images
Introduction
I wrote this article to try to answer a question I’ve been thinking about personally – how should an investor view medical office building “MOB” focused REITs? Who are the players? What’s the investment thesis? What are reasonable expectations going forward?
I’ll try to answer those questions and discussion my current assessment.
The Field and the Players
NAREIT estimates that for commercial real estate “CRE” generally, REITs “tend to focus on institutional-quality properties that are newer and of higher quality” than average, that institutional-quality properties make up about half of the CRE market, and that REITs own ~ 20% of these institutional quality property.
For health care specifically, NAREIT estimates that the Health Care segment of CRE is about 2.7 billion square feet, with a value of $2.3 trillion, and comprises about ~11% of the total CRE value.
Seeking Alpha identifies 14 REITs in the Health Care industry and provides a summary of key characteristics here.
There are now three public REITs that are largely (>65%) focused in the MOB market: Healthcare Realty Trust Inc. (NYSE:NYSE:HR), Physicians Realty Trust (NYSE:DOC), and Global Medical REIT Inc. (NYSE:GMRE). Note that HR completed the acquisition of Healthcare Trust of America, Inc., formerly the largest MOB pure play, on 20 July 2022.
A forth REIT, Universal Health Realty Income Trust (NYSE:UHT), is dependent on one operator, Universal Health Services, Inc., (NYSE:UHS) for 40%+ of their revenue; UHS also serves as the external advisor to UHT. I view these factors as disqualifying (at least for me), and UHT is not further considered in this article.
In addition, there are three very large public REITs that have significant MOB investments; Welltower Inc. (NYSE:WELL), Ventas, Inc. (NYSE:VTR), and Healthpeak Properties, Inc. (NYSE:PEAK).
The chart below nicely illustrates the MOB weighting among these REITs. While MOBs may serve as a ballast for the three larger REITs, their performance is largely going to be determined by their other investment.
HR Investor Presentation – Aug 2022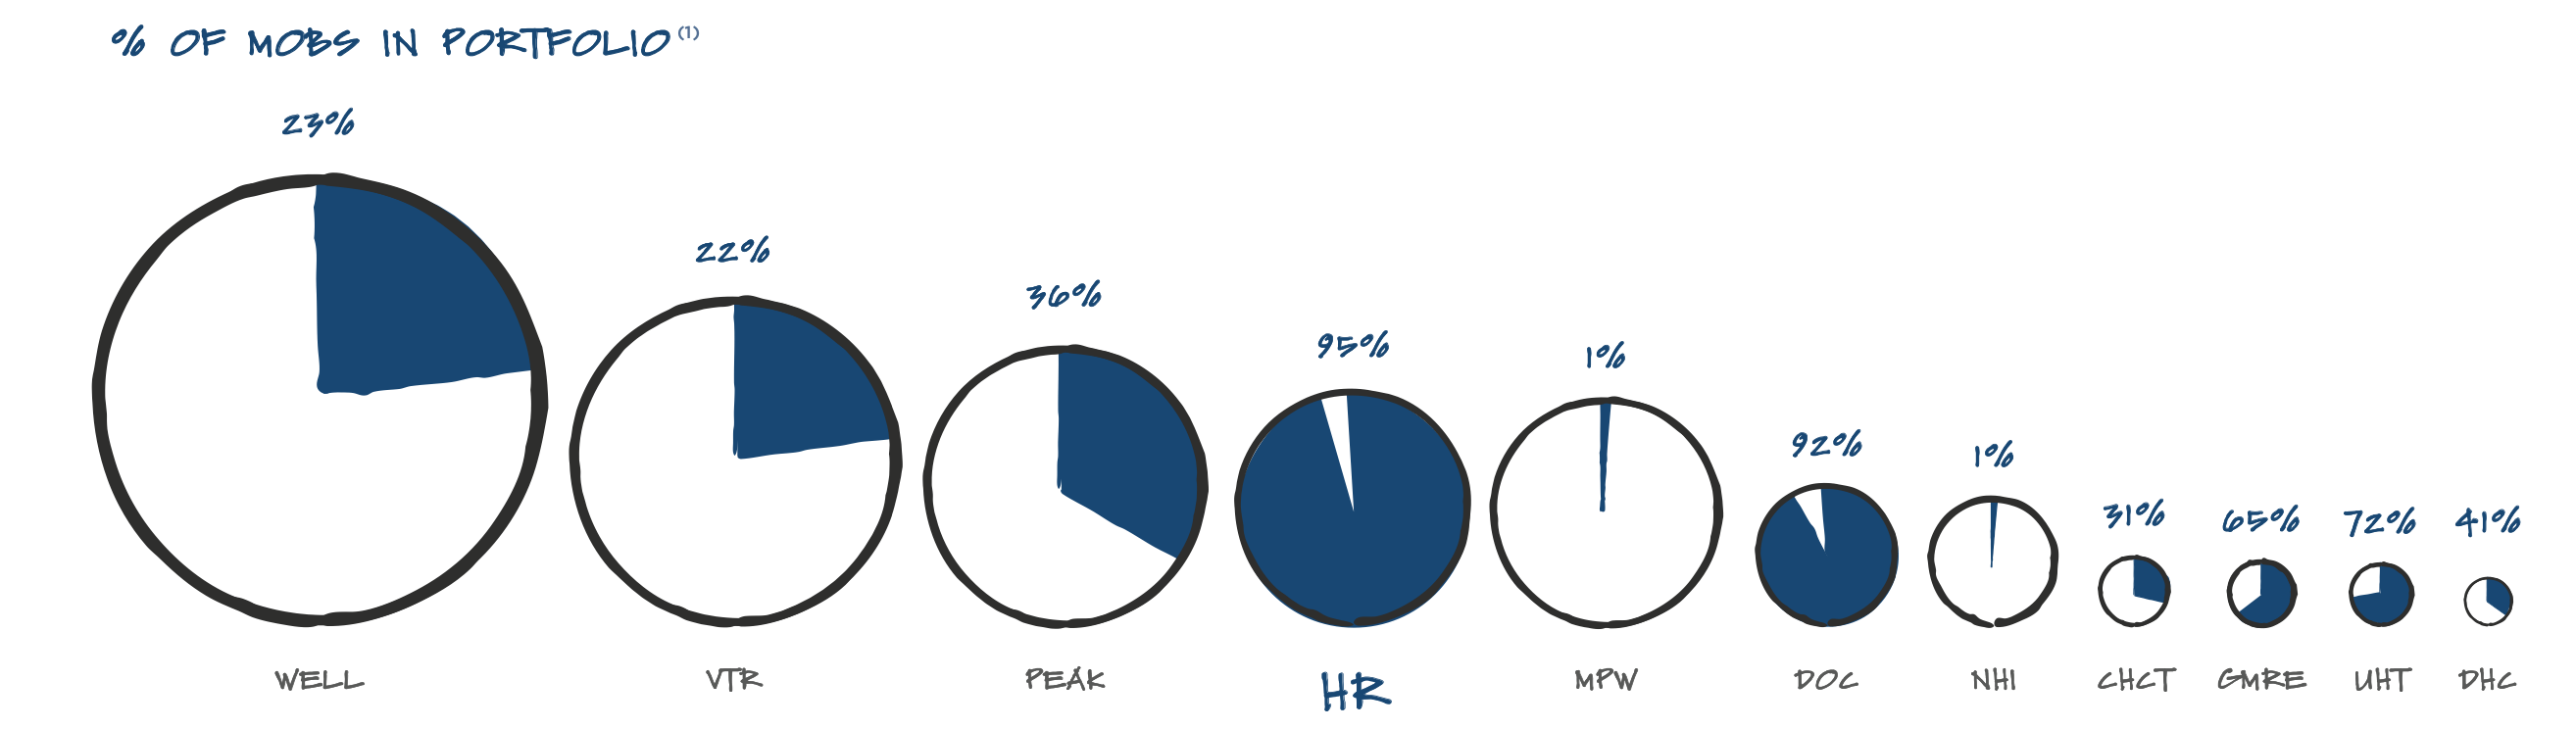
HR is the largest and purest MOB play, and will therefore be the primary focus for the remainder of this article, although we will also discuss DOC and GMRE. As a quick reference for relative size, HR has a market cap of ~ $9.3 billion, and owns 700+ properties, DOC $4.1 billion and 290 properties, and GMRE $0.7 billion and 180 properties.
Investment Thesis
The thesis is: MOBs are a real-estate asset class which can provide an attractive combination of relative safety (preservation of capital) and current income.
The CEO of DOC explicitly makes the case in their press release for Q2 2022 results (emphasis mine):
We remain firm in our conviction that medical office facilities offer the best risk-adjusted returns in health care real estate …
Cash flows from medical office buildings remain secure during periods of economic slow-down, especially where the facilities are leased to investment grade quality health systems and physicians supplying highly demanded outpatient services like orthopedics and oncology. The high occupancy (95.0%) of our triple-net portfolio provides protection from high inflation, while high construction costs are driving higher renewal mark-to-market rates for our existing portfolio.
Third parties have offered a similarly positive tone. This BizNews report from the April 2022 Revista 2022 Medical Real Estate Forum in San Diego makes several key points for MOBs:
- the market has attracted significant new investment seeking “safe haven” assets, i.e. a hedge against inflation, with capital protection and a rising income stream
- lease rates are expected to increase by 3% per year, up from the 2-2.5% per year seen in recent years
- increasing cost of new construction, coupled with rising lease rates, raises the value of existing buildings
- 2021 was a record year for MOB transactions, at $17.4 billion
- employment in physician offices has fully recovered to 2.7 million people
Occupancy rates for MOBs in the top 50 metro areas in Q2 2022 have recovered from a <1% COVID dip to just under 92%. Median cap rates for transactions are reported to be about 5.8% with the lowest rates < 3.5%. NOI growth year-over-year is running about 2.5%.
OK, let’s look at some numbers.
Past Performance
As an investor rather than a trader, my time horizon is usually 5+ years. Ideally I’m buying assets my heirs will be happy to have decades from now.
Opinions will differ, but I’d say that a reasonable minimum expectation for “safe haven” is a positive real return over a 5 year period, i.e. (dividends + share price appreciation) above the rate of inflation.
According to the CPI calculator from the Bureau of Labor Statistics, $1.00 in January 2017 was worth about 86 cents in January 2022 (3% CAGR) and about 82 cents in July 2022, the latest data available.
This is the headline CPI number, which is actually the all urban consumers CPI-U, which is supposed to reflect “prices of all goods and services purchased for consumption by urban households”. Annual CPI data is published by the BLS here. Your milage may differ, but it’s the standard metric.
In the following 5 year analysis, we use 01 January 2017 as the start date. The tables use 30 June 2022 as the end date, reflecting the last available CPI data. The YCharts provide another view, are in nominal dollars, and end 10 September 2022. Note that this period includes the ~ March 2020 COIVD related decline.
In the tables, I’ve added several other REITs for comparison. In the Charts, I’ve usually added the index tracking Vanguard Real Estate ETF (VNQ).
Dividends
How well did the REIT dividends keep up with inflation?
From 01 January 2022 to the end of Q2, the MOB REITs increased their dividends at 5-15% of the rate needed to keep up with inflation (yellow cells), leaving the real value of the 2022 dividend reduced to about 84% of the 2017 dividend. Most of that shortfall has occurred in the last 18 months, but increases were falling behind inflation even in the low inflation years.
By this metric, the larger and more diversified health care REITs with < 50% MOBs, which all cut their dividends, were much worse. To provide another point of reference, I also included the data for Realty Income (NYSE:O).
Table by author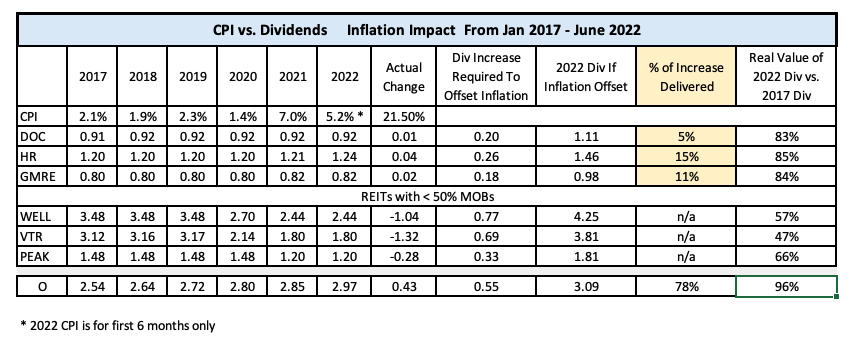
If we look at dividends in chart format, extending to 10 September, we see:
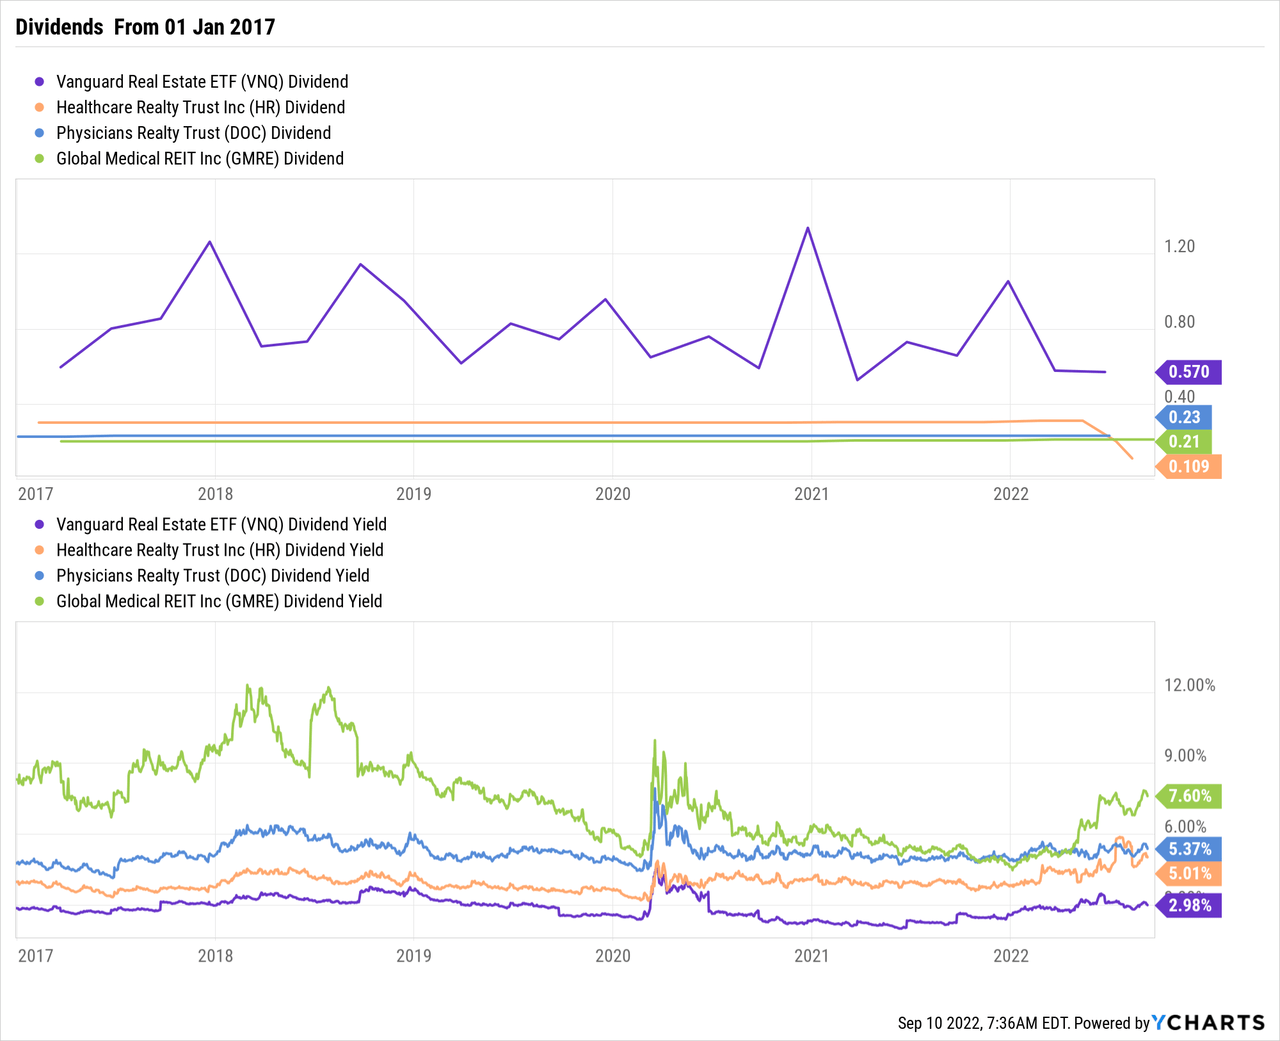
There are several observations here:
- the results appear fairly insensitive to the exact start date
- MOB dividends are ~ flat over 5 years; but were maintained during COVID
- yields for HR and DOC in the ~ 5% area; DOC is usually higher
- VNQ yield ~ 3%
- GMRE is more variable and normally a couple of points higher
- real dividends have declined about 15%
Note that the apparent decline in the HR dividend from mid-2022 shown in the chart is a reporting artifact related to problems tracking partial dividends paid around the merger with HTA – actually the HR dividend did not decline.
Preservation of Capital
Preservation of capital, as measured by share price, hasn’t been much to write home about for the MOB REITs.
Table by author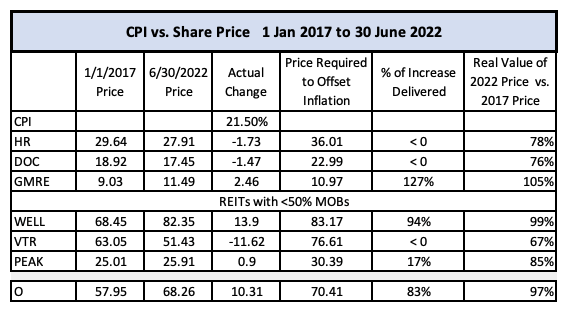
Looking at a chart extending to 10 September:
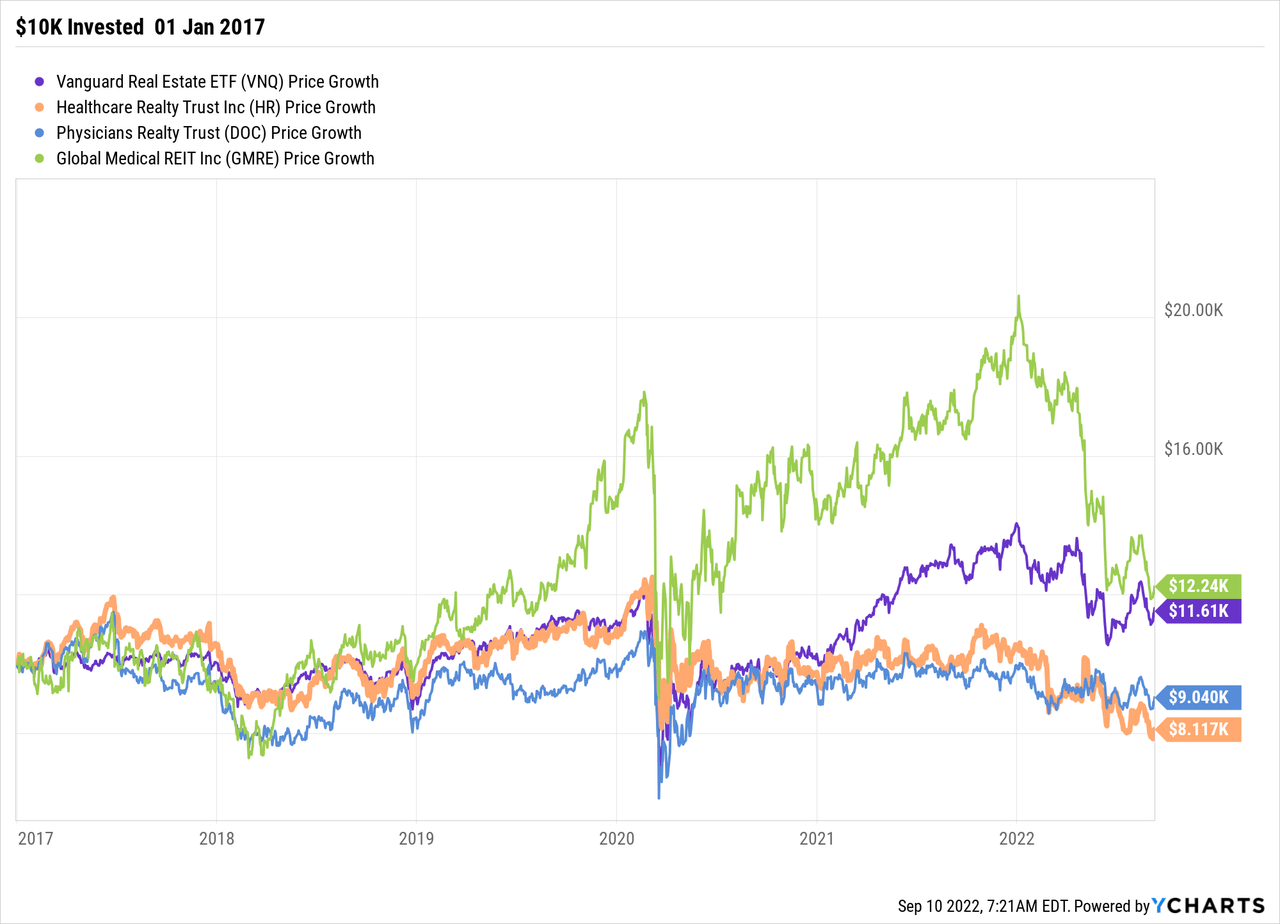
There are several observations here:
- HR and DOC track fairly closely together
- they did not do as well as VNQ
- GMRE is considerably more volatile
- the negative reaction to HR’s acquisition of HTA in early 2022 is evident
- real stock price for HR and DOC has declined 20%+
Total Return
However, on a total return basis, everyone but HR has a positive real return vs. the 21.5% inflation at the end of Q2, with GMRE doing significantly better.
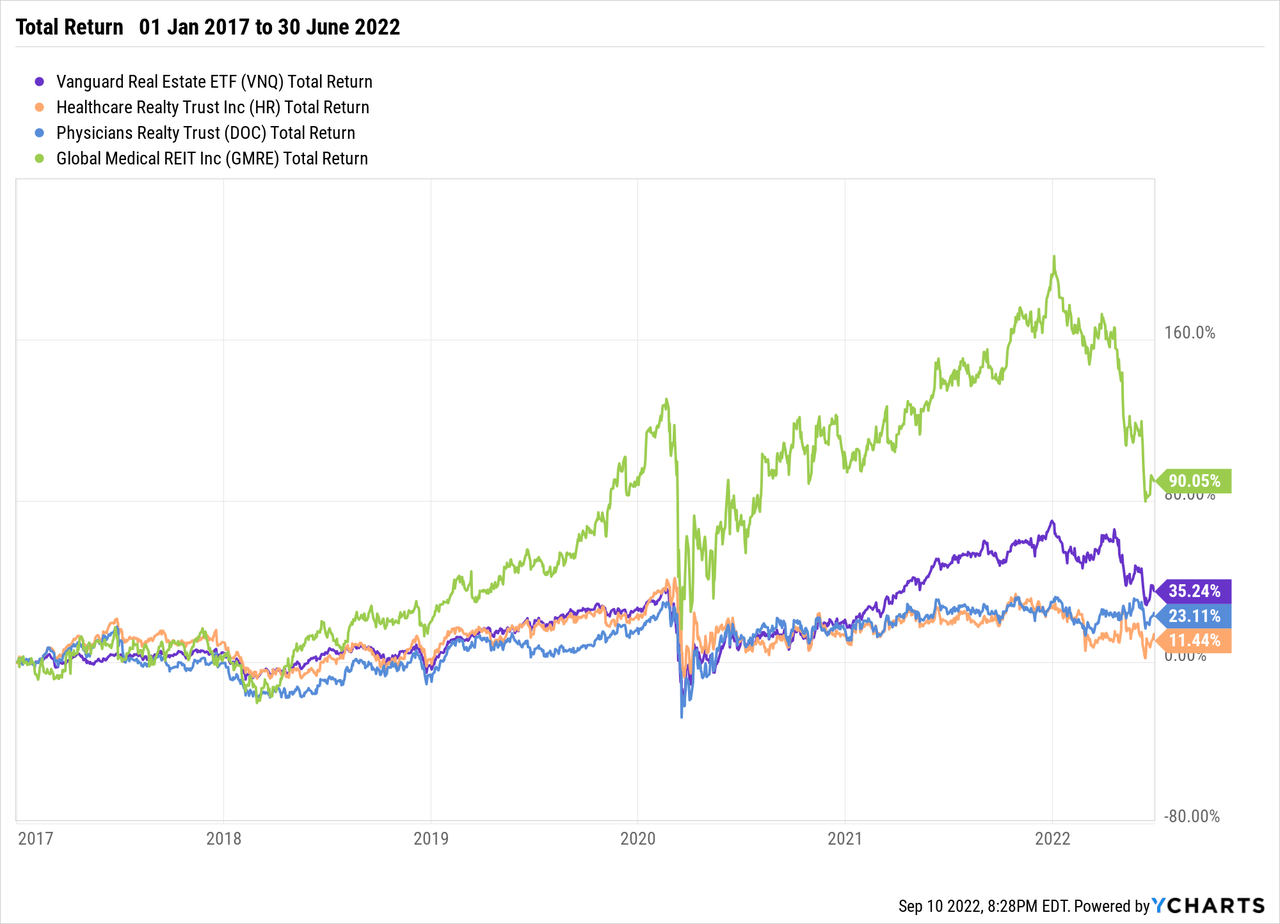
An investor might reasonable conclude, at least for this period, that if one was willing to reinvest most or all the dividends, MOBs did achieve a marginally positive real return. This may leave an income seeking investor unsatisfied. This all also assumes no taxes.
The State of Play – Q2 2022
From the Q2 earnings calls (minor edits for clarity and brevity), we note key points for HR, and a few comparative points for DOC and GMRE, below:
HR – 09 August:
- acquired HTA 20 July
- in process of selling $1.1 billion of properties to fund special dividend paid to HTA holders, $1046 million sold or under contract; blended cap rate of ~ 4.8%
- $417 million acquisitions YTD; blended cap rate of 5.2%
- In the next several quarters, plan to sell additional properties totaling $500 million to $1 billion
- FAD payout ratio for Q2 was 83% (expect <90% post merger)
- year-over-year quarterly same-store NOI growth increased 3.3%
- in-place contractual escalators of 2.89%
- Q2 cash leasing spreads of 3.4%; in line with historical range of 3% to 4%
- HR’s existing multi-tenant occupancy of 88%
- current post merger estimate of NAV implies cap is in the high 5s, makes buybacks attractive
- board authorized $500 million share repurchase program
- expect/target post merger leverage range 6% to 6.5% debt to EBITDA
- post merger, 68% on or adjacent to campus, longer term target ~ 75%
- 30-40 basis points spread available from selling portfolios and buying individual properties
- development spreads remain steady 100 to 200 basis points over acquisition yields; expect to build towards $300 million in annual starts
- plan – occupancy improvement via scale in a market, more clusters within a market, better utilization of brokers, particularly for multi-tenant
- plan – portfolio is concentrated in dense, high-growth markets
- plan – intend to deliver attractive long-term shareholder value through a compelling combination of lower risk, increased liquidity, and accelerated growth
DOC – 04 August:
- exceptional leasing spreads of 8% on Q2 renewals
- expect H2 2022 lease renewal spreads of 5% to 7%
- portfolio level MOB same-store NOI growth was 1.9% in Q2
- two thirds of lease escalators in Q2 had a rent bump of 3% or higher
- 95% occupancy
- disposition sold at 4.7% cap rate
- plan – believe outpatient care medical office facilities leased to investment-grade tenants offers the best risk adjusted returns in real estate
- plan – ultimately target is 100% concentration in outpatient care facilities
GMRE – 04 August:
- Q2: 5 acquisitions, 6.9% cap rate
- Q3-to-date: 2 acquisitions, 7.3% cap rate
- 4 properties under contract, 7.4% cap rate
- same-store basis, Q2 revenues up 1.6% from Q2 in prior year
- 96.5% occupancy
- 2.1% weighted average contractual rent escalations
- plan – move cap rates up to 7.5% and above
- do selectively – buy something in the low 7s and bring it up to an eight
- strategy is to grow; analysts suggest NAV is $15, but no plans for buybacks
Analysis
The major players, both REITs and other investors, are largely competing for the same set of properties – “high quality” buildings on or near a hospital campus.
None of the MOB REITs appear to have any secret sauce, or any very convincing plan to create one.
For example, relationships with customers, consistently identified as a key advantage, looks more like minimum table stakes. From the Q2 earnings calls:
- “great relationships with the leading health systems in each market. The combination of rising demand, growing markets and deep relationships will accelerate bottom line growth”; “tap into our expanded relationships to increase our pace of investment” – HR
- “our long term strategy of partnering directly with high quality health systems and physician groups” – DOC
- “continues to benefit from strong relationships with our tenants” – GMRE
Other advantages that are sometimes touted are:
- concentration in major/wealthy metro areas
- concentration of “on or near hospital campus” vs. “off campus”
- large market share around a particular hospital complex
An exchange in the HR Q2 earnings call (edited here for brevity) suggests MOB REITs are in a Red Queens race, and that investors shouldn’t expect any of these factors to significantly move the needle:
Analyst
Now that you’re a much bigger enterprise … do you think that HR can institute real change in terms of how people view the business from the lens of the REIT. We had typical 3% type same-store NOI growth, 3% cash re-leasing spreads in that range, sometimes more, sometimes less.
But when you look at some of the other sectors in the REIT space… where there is a price-insensitive tenant base like yours, they get much bigger cash releasing spreads, bigger same-store numbers. Is that something that you think you can achieve over the long term … I’m thinking about systemic change to the medical office business having more of a growth element to it …
Kris Douglas – CEO
I think fundamentally, we’re not going to change medical office from a non-cyclical business to suddenly a cyclical business. I think that’s the trade-off.
I think medical office is different. It’s really built to grind at these more steady rates but through economic cycles. … I do think though we can incrementally move higher on the growth profile. I think we can sustain a 3%-plus type growth profile.
And this is about safety. MOBs are largely more about noncyclical and safety.
As they used to say about some football teams, it looks like “three yards and a cloud of dust.”
One might look for indicators of a change in status quo:
- lease contracts with standard CPI escalators
- substantial shift to development / re-development rather than acquisition
- consistently higher occupancy levels
In the MOB market, development rather than acquisition appears to offer about 100 basis points of advantage. Multi-property portfolios – which appeal to investors with very large sums to invest, appear to trade at a premium to individual properties, which may provide an opportunity for accretive capital recycling.
It’s worth noting that GMRE’s strategy is different; higher cap properties, in secondary or tertiary markets/locations. This has echos of STAG Industrial, Inc. (NYSE:STAG) in their early days.
Close to Hospital or Home?
One might also question the value of being “close to the hospital” rather than “close to the patient”.
For example this very interesting McKinsey study of Ambulatory Surgical Centers “ASC” projects a significant shift in surgical procedures from in-patient hospital settings to ASC settings. This is driven by lower cost (typically 40% less) to the payer, higher margins to the provider (nearly double in-patient settings), physician preference, and patient preference.
The study examined commercial insurance records for 615 million encounters and found that activity codes which account for about 10% of spend were almost always performed in in-patient settings, encounters for 60% of spend were almost always out-patient, and encounters for about 30% of spend were done in both settings. Encounters in this last group had a $21,000 cost difference between ambulatory and in-patient settings.
The number of outpatient surgical procedures (i.e. the patient goes home the same day as the surgery) in the US is expected to grow from ~129 million procedures in 2018 to ~144 million procedures by 2023.
Investors who have had such procedures (major types being dental, gastrointestinal, orthopedic, ophthalmic, ENT, obstetric/gynecological, cosmetic, cardiovascular, and urologic surgeries) might recall whether their location preference was to be close to the hospital or close to home.
Increased Supply
In addition, MOBs are to a degree fungible with standard office buildings, or even non-office buildings. The effect in to provide the potential renter with an ever present and usually cheaper alternative to investment grade on-campus / near-campus buildings. Buildings may be considered “medical” due to:
- proximity to a hospital
- building physical characteristics (utilities – additional plumbing, electrical power, and air handling; special structural features to accommodate equipment – increased weight bearing, vibration isolation; easier access – doors, hallways, elevators that can accommodate wheelchairs or gurneys, weather protected loading/unloading zone, parking spaces)
- availability of an ecosystem of shared or convenient services (e.g. blood draw, imaging, medical vendor support, medical waste disposal)
The degree of specialization compared to a standard office varies, from none for psychiatric services to quite a bit for outpatient surgery or imaging, but the potential for conversion of standard office buildings into a medical office buildings is there, particularly where there is a large differential in the demand for medical vs. standard space. Here’s a well executed example in Houston.
Non-traditional office spaces such as malls are also in the mix, with Fortune reporting 32 malls already involved. One recent example is Vanderbilt University Medical Center with a March 2022 a letter of intent for 600,000 square feet of vacant space in the Global Mall at the Crossings.
Risks
We can list some of the risks to our thesis:
- Growth in dividends, share price, and total returns may not keep up with inflation, at least in the short to medium term
- Demand may migrate from on-campus / near-campus to cheaper, more convenient “close-to-patient” space
- Increased supply via conversion may preclude “moaty” market share
Investor Takeaway
The two larger pure play MOB REITs, HR and DOC, appear quite similar; with the recent acquisition of HTA, HR is now significantly larger. I would not be surprised to see DOC as an M&A target.
GMRE is differentiated by their focus on secondary markets and higher CAP properties; its certainly exhibited higher variability, and many would consider it higher risk.
Real total returns are likely to be very modest. Dividends, while stable and relatively safe, have not kept pace with inflation. Neither has share price.
My view is that investors should view MOBs as buying a bond equivalent, backed by real physical assets. Those who want to own this type of asset should look for opportunities when these assets are “on sale”. Patience is among the few advantages available to individual investors. For an investor seeking to fill a prescription for MOBs, this chart shows what “on sale” might look like.
Seeking Alpha Chart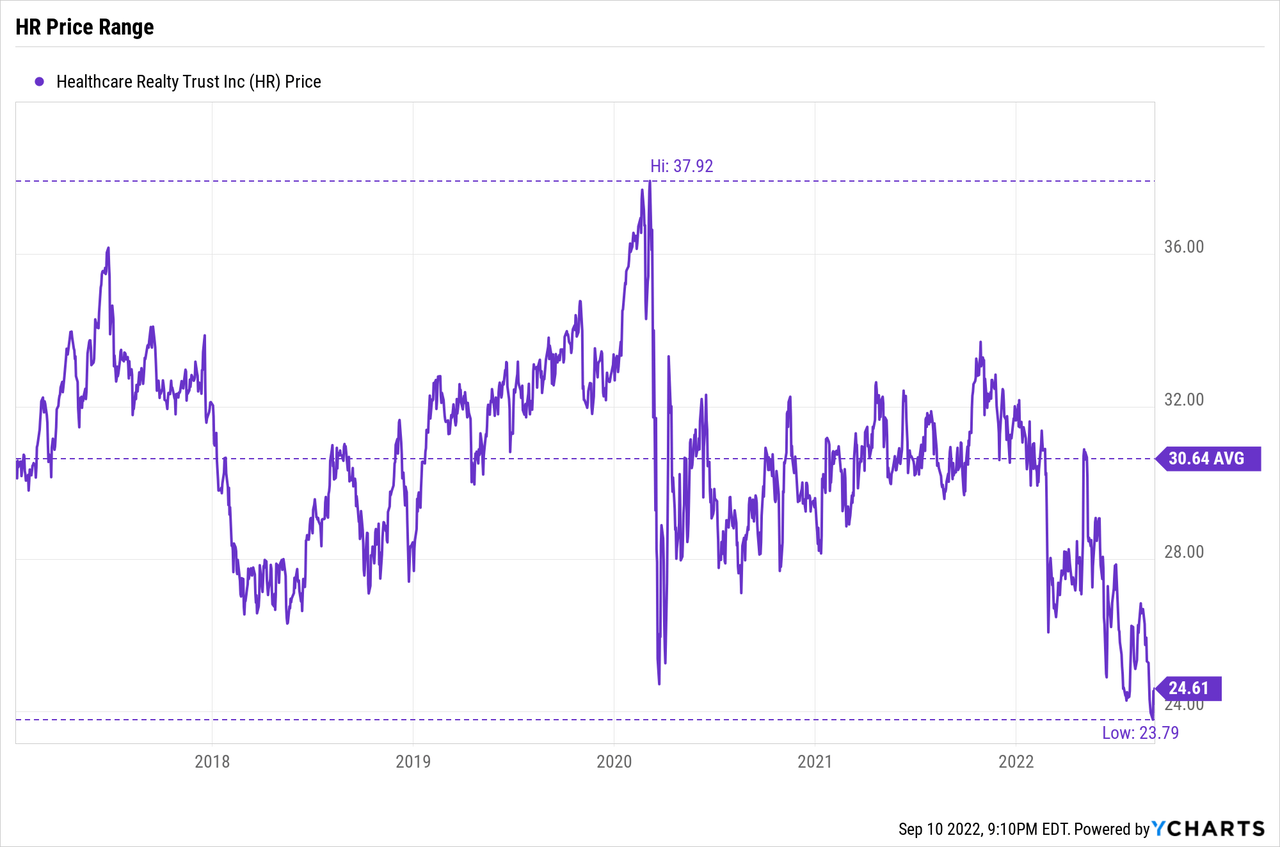
Seeking Alpha provides a summary of Wall Street analysts price targets for HR, which an investor might want to consider as well.
Seeking Alpha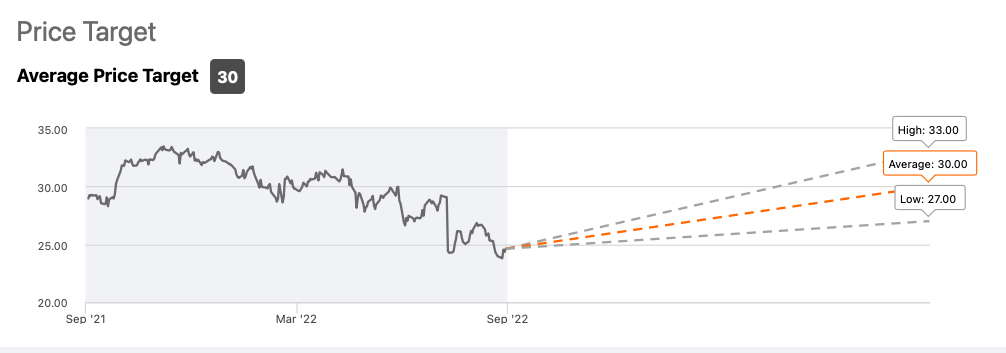
Personally, my asset allocation plan has a target for REITs, and within this, a target for healthcare REITs. I have chosen positions in VTR, PEAK, HR, DOC, and GMRE. My position in HR was acquired in May 2022 at $25.16, via buying HTA after the merger announcement, as described here. HR and GMRE are currently on my watch list, and I would probably make minor additions, to complete positions, at somewhat lower prices. On the SA scale, I would rate HR a hold.
Be the first to comment