

pattier/iStock via Getty Images
Despite outstanding performance from most of the companies in the sector, it has been a tough year for Industrial REIT (real estate investment trust) shares. While the average REIT as measured by the Equity REIT Index has lost (-28.68)% this year, Industrials have done even worse, at (-31.43)%.
Hoya Capital Income Builder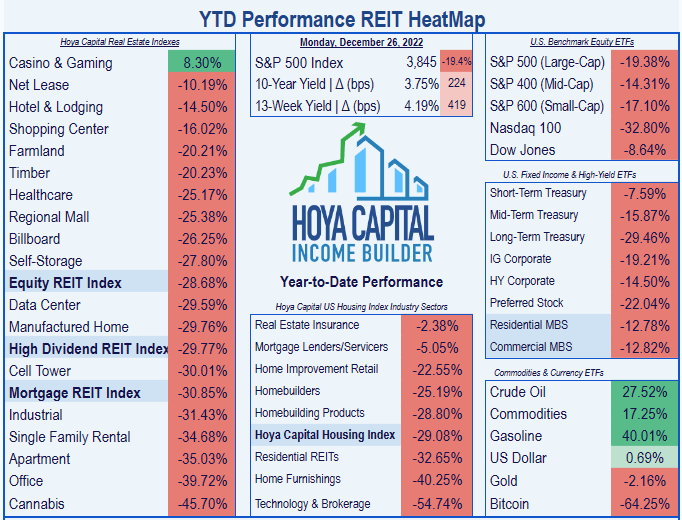
Industrial REIT prices have been hammered in 2022 by the flight to yield. The selloff has been disconnected from the companies’ fundamental performance, which has been stellar. This has created a situation where several Industrials may be oversold, and are available at unusually favorable prices.
Industrial REITs are enjoying eye-popping sector average rent spreads exceeding 20%, and a record-low vacancy rate of just 2.9%, according to Hoya Capital Income Builder’s recent sector report.
As a percentage of all retail, e-commerce continues to grow, reaching 21% last year, and projected to reach 25% next year.
Prologis investor presentation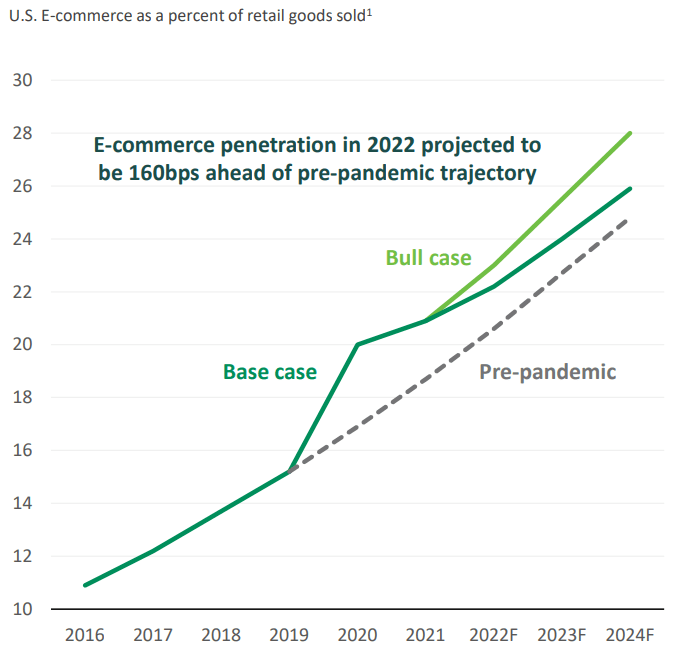
Demand for well-located logistics space continues to outstrip supply, as the following chart summarizes in a nutshell:
Hoya Capital Income Builder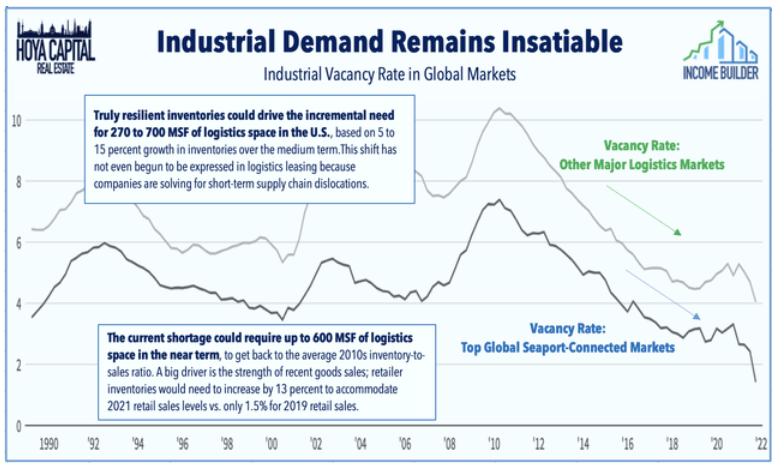
True months of industrial warehouse supply have fallen from nearly 100 in 2011, to just 6 now. Anything less than 50 signals positive real rent growth. Consequently, rents are skyrocketing.
Prologis investor presentation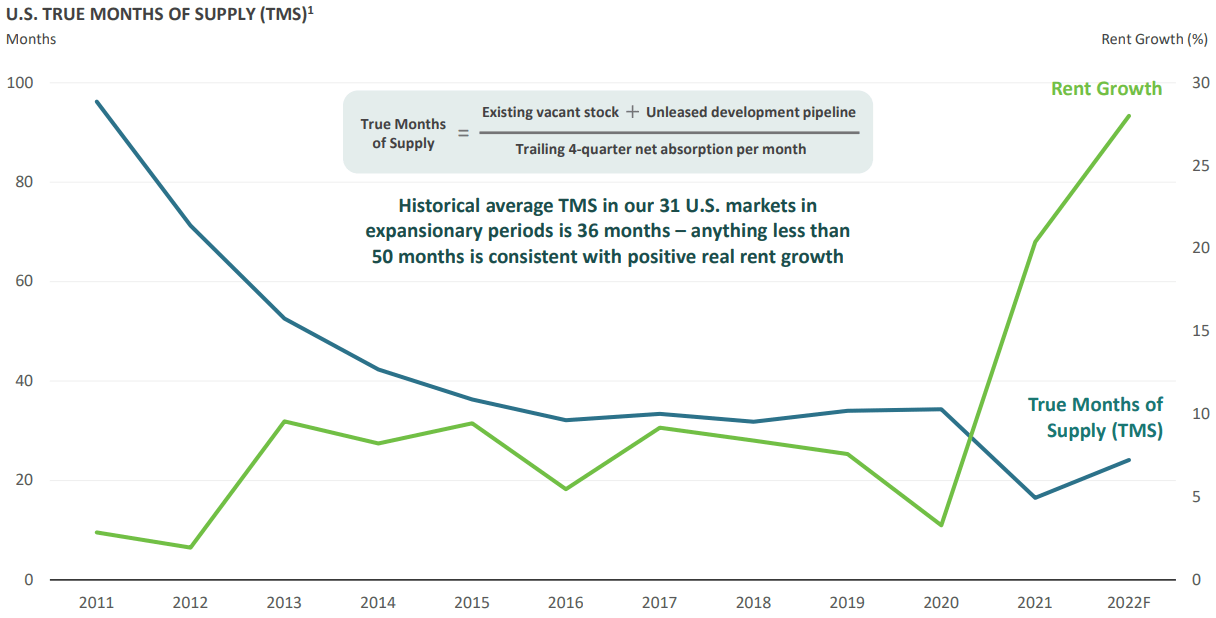
However, this does not put undue pressure on the tenants, as rent is only 5% of their total cost, on average.
Prologis investor presentation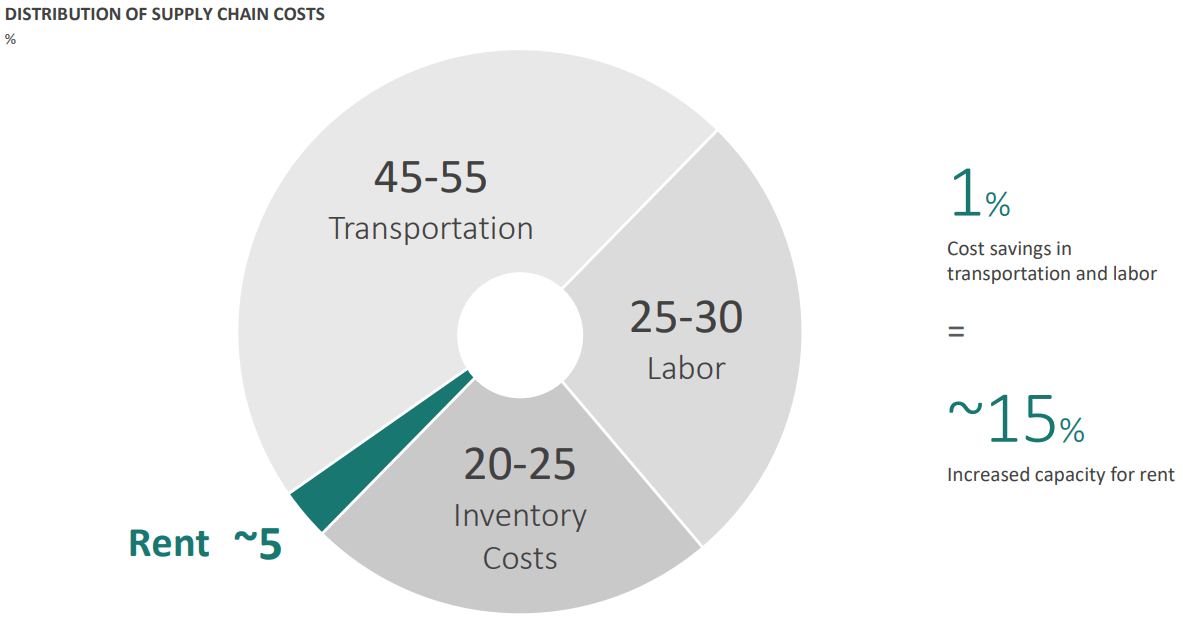
All six industrial REITs that provide NOI guidance raised their full-year growth outlook, while five of the eight that provide FFO guidance raised their growth targets, when reporting H1 2022 results.
The best Industrial REITs typically trade at Price/FFO multiples above 30, far above the REIT average. This article examines metrics for 3 such companies with stellar balance sheets, and sizzling growth in revenues, cash flow, and dividends, that happen to be trading at their lowest Price/FFO multiple in years. In other words, great companies at good prices.
Prologis, Inc. (PLD)
Headquartered in San Francisco and founded in 1983, Prologis focuses on “irreplaceable” locations in high-barrier, high-cost markets. With a market cap of $104.9 billion, and over 1 billion square feet of logistics facilities, the company’s scale is enormous, sprawling across 19 countries and 4 continents. This massive portfolio currently boasts 97.8% occupancy, the highest in the company’s history.
Prologis Q3 2022 supplemental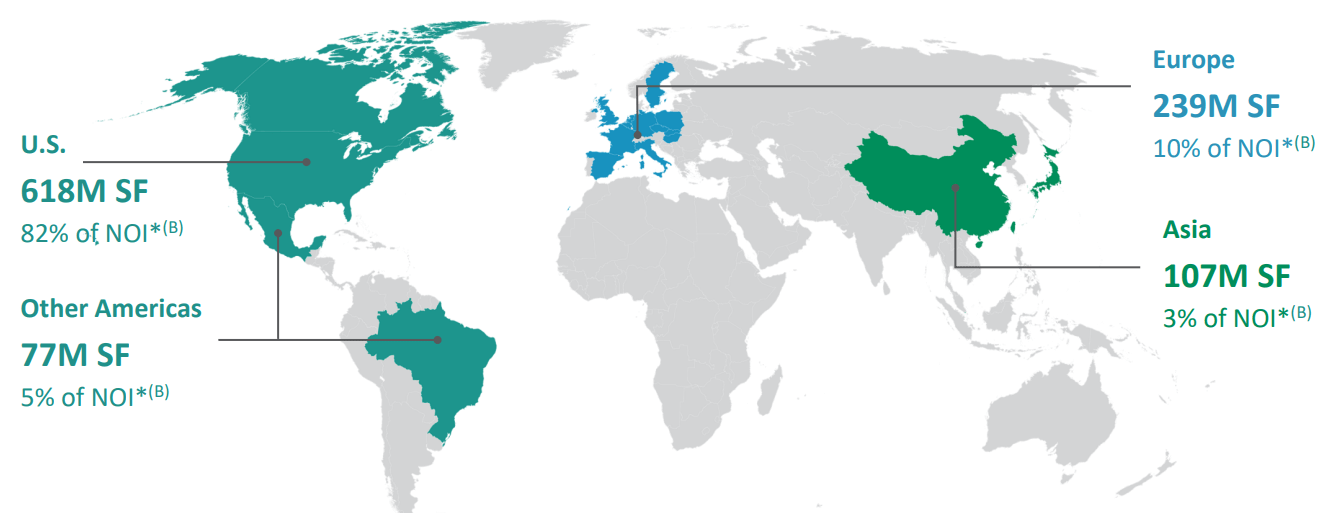
The ultra-diversified tenant base includes 6200 different companies, across the following uses:
Prologis investor presentation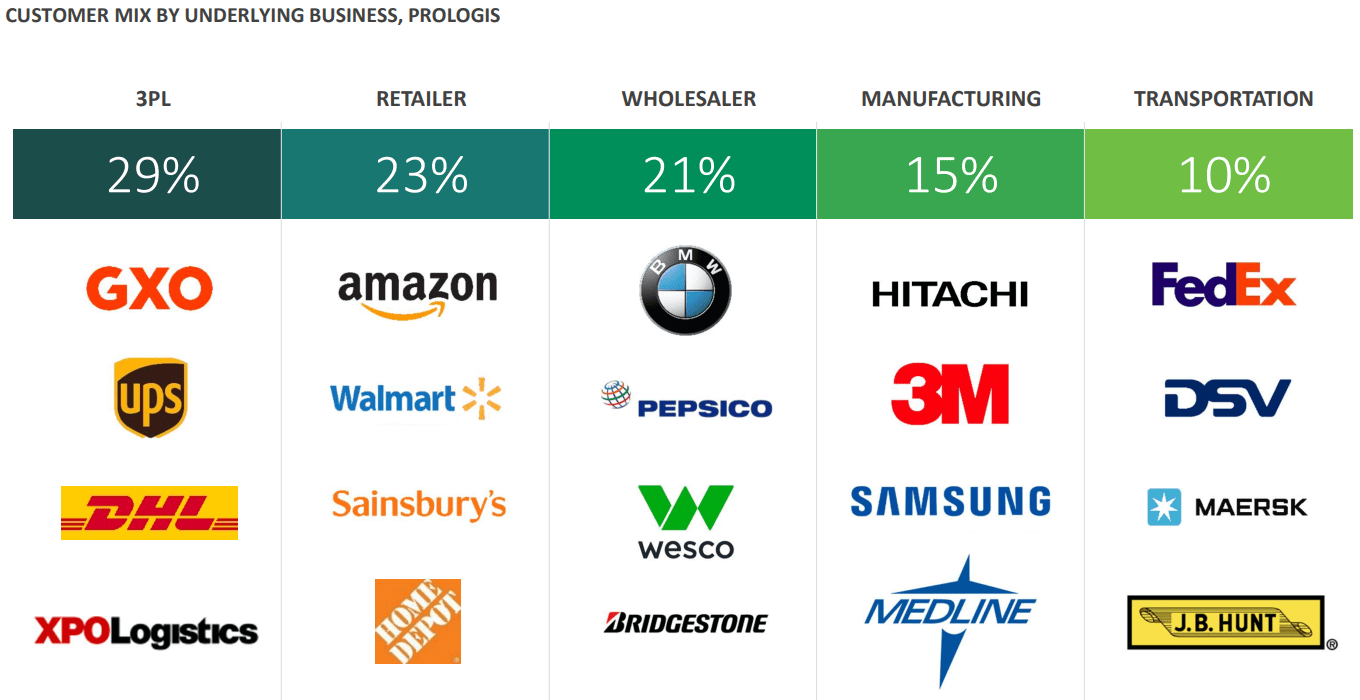
PLD’s top 10 customers account for only 14% of the company’s total rent revenue, and the top 25 only account for 20%.
Prologis Q3 2022 supplemental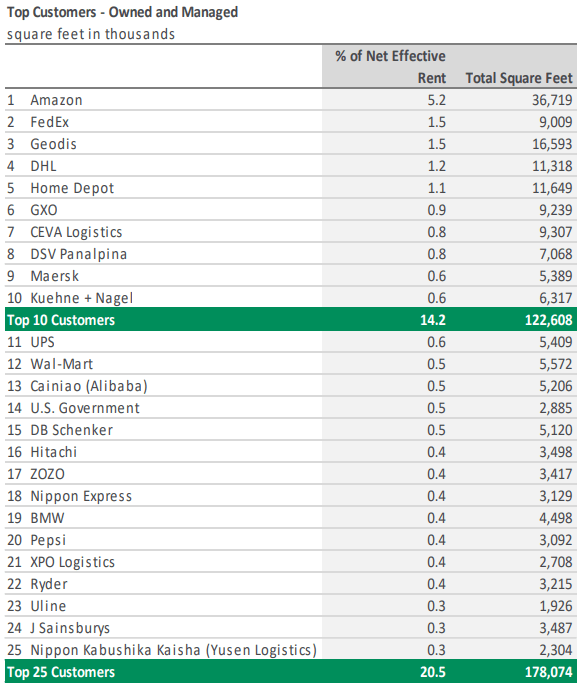
Prologis develops more facilities than it acquires, and has a huge portfolio of land holdings to support further development.
Prologis investor presentation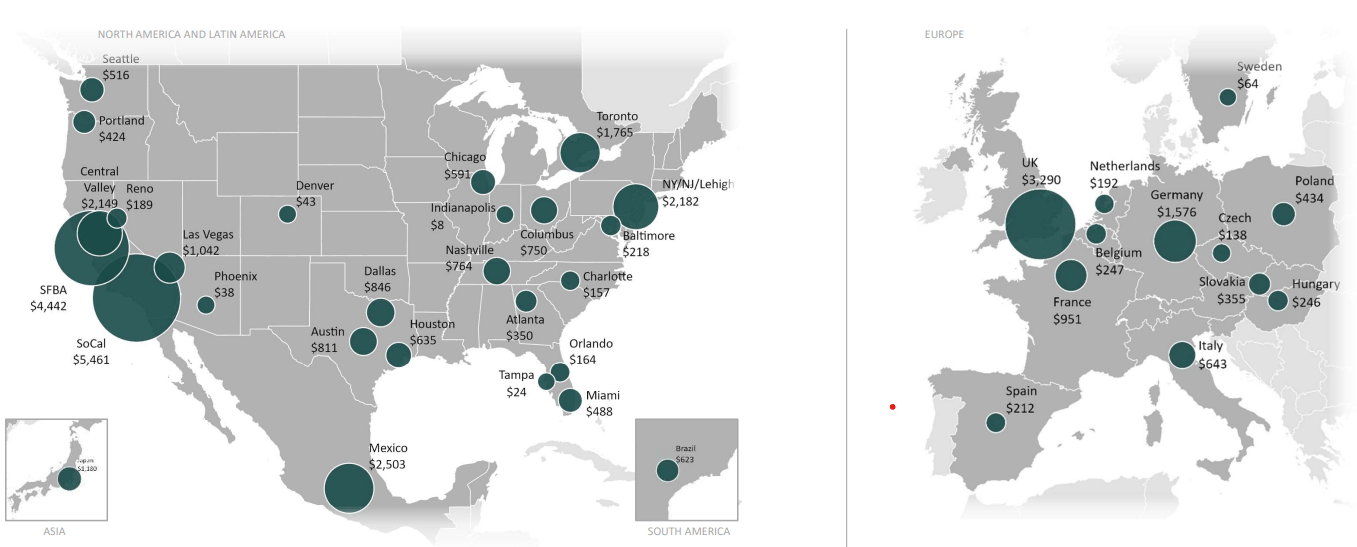
Prologis also conducts third-party management, and that fee revenue has grown by double digit percentages over the past 4 years.
Prologis investor presentation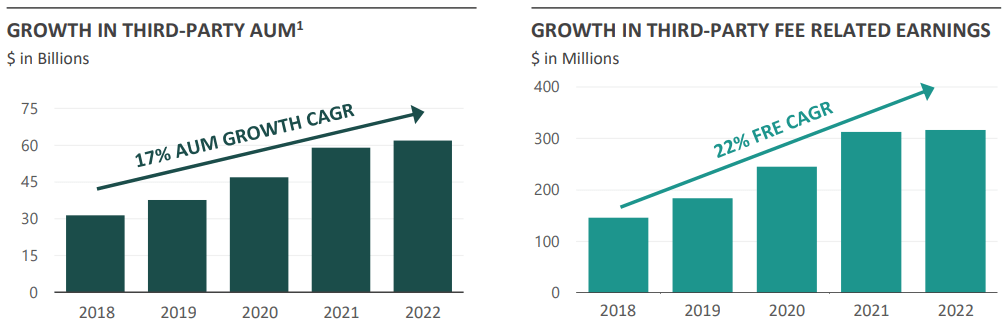
Prologis Q3 2022 operating results were spectacular, as follows:
- Revenues of $1.15 billion, up 11% YoY (year-over-year).
- FFO (funds from operations) of $1.4 billion, up 52% YoY.
- Net earnings per diluted share of $1.36, up 40% YoY.
- Core FFO of $1.73 per share, up 66% YoY.
Prologis closed on acquisition of Duke Realty in early October, gaining more than 500 new customers and a high-quality 142 msf (million square feet) portfolio that is 99.5% leased.
PLD Growth
Here are the 3-year growth figures for FFO (funds from operations), and TCFO (total cash from operations).
| Metric | 2019 | 2020 | 2021 | 2022* | 3-year CAGR |
| FFO (millions) | $2164 | $2864 | $3172 | $3419 | — |
| FFO Growth % | — | 32.3 | 10.7 | 7.8 | 16.5% |
| FFO per share | $3.31 | $3.80 | $4.15 | $5.12 | — |
| FFO per share growth % | — | 14.8 | 9.2 | 23.4 | 15.7% |
| TCFO (millions) | $2264 | $2937 | $2996 | $3799 | — |
| TCFO Growth % | — | 29.7 | 2.0 | 26.8 | 18.8% |
*Projected, based on Q3 2022 results
Source: TD Ameritrade, CompaniesMarketCap.com, and author calculations
It is rare that a REIT this size manages to grow at such spectacular rates, but PLD pulls it off, and qualifies as a FROG.
PLD Balance sheet
Prologis’ excellent A-rated balance sheet sports high liquidity and low debt.
| Company | Liquidity Ratio | Debt Ratio | Debt/EBITDA | Bond Rating |
| PLD | 2.38 | 12% | 4.7 | A |
Source: Hoya Capital Income Builder, TD Ameritrade, and author calculations
PLD Dividend
Although Industrials are known for low dividend yields at purchase, this sector grows its dividends faster than any other REIT sector, except Single Family, Cannabis, and Cell Towers (all of which have far fewer companies). Prologis is growing its dividends faster than the average Industrial REIT, and the payout rates an ultra-safe grade of A from Seeking Alpha Premium.
| Company | Div. Yield | 3-yr Div. Growth | Div. Score | Payout | Div. Safety |
| PLD | 2.78% | 14.2% | 3.63 | 60% | A |
Source: Hoya Capital Income Builder, TD Ameritrade, Seeking Alpha Premium
Dividend Score projects the Yield three years from now, on shares bought today, assuming the Dividend Growth rate remains unchanged.
PLD Valuation
PLD is trading below the Industrial REIT average, at 22.2x FFO ’22, and much lower than its usual FFO multiple of around 30. It also offers a (-12.6)% discount to NAV.
| Company | Div. Score | Price/FFO ’22 | Premium to NAV |
| PLD | 3.63 | 22.2 | (-12.6)% |
Source: Hoya Capital Income Builder, TD Ameritrade, and author calculations
Bottom line: PLD
Prologis is a huge and rock-solid growth juggernaut, paying safe and rapidly increasing dividends, and available at an unusually low Price/FFO multiple.
Rexford Industrial Realty, Inc. (REXR)
Rexford Industrial Realty
Founded in 2001, Rexford Industrial Realty dominates industrial warehouse space in the lucrative Southern California infill market. That market is worth about as much as the next 4 largest U.S. markets combined.
With 346 properties, comprising about 42 msf, Rexford owns about 75% of all the industrial space in the Los Angeles – Long Beach – Anaheim metropolitan statistical area. The current occupancy rate is a near-perfect 98.6%.
Rexford Realty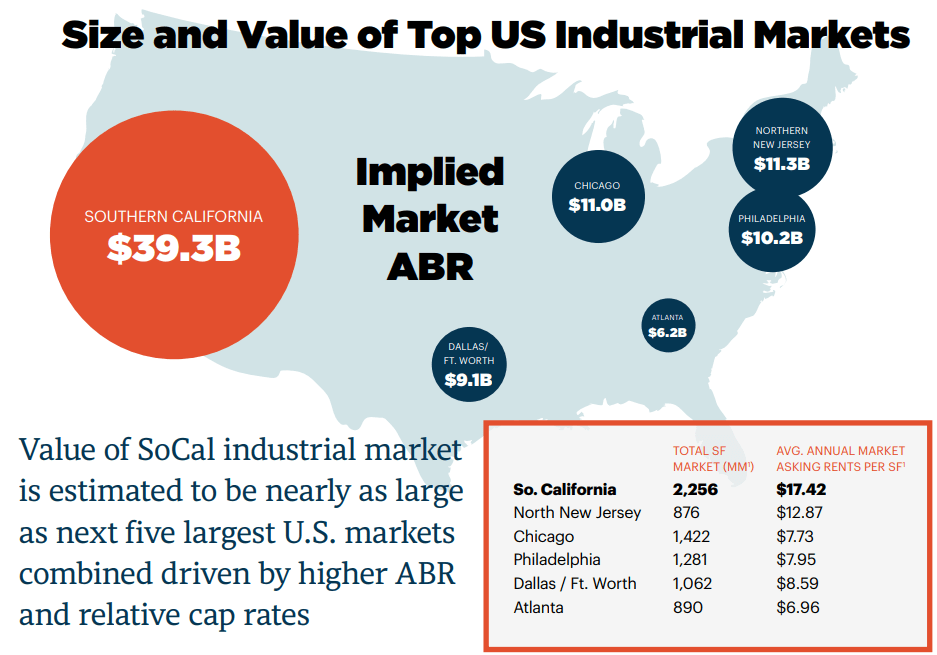
Industrial space is chronically in short supply in Southern California, due to lack of suitable land, natural barriers, and restrictive zoning. Rexford’s dominant position will likely endure for many years to come.
As you might guess, rent growth in REXR’s domain has been spectacular. Blended cash leasing spreads have gone from a strong 22% in 2019 to a jaw-dropping 60% this year. Meanwhile, the net effective mark-to-market is 72%, so there is huge internal growth potential, as leases expire.
Rexford investor presentation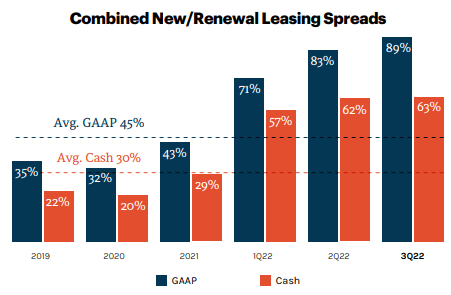
Rexford’s proprietary acquisition platform and deep knowledge of the local market enable the company to beat competitors to profitable acquisition opportunities on a consistent basis, especially in off-market or lightly-marketed transactions. This results in a rapidly growing and profitable portfolio.
Rexford investor presentation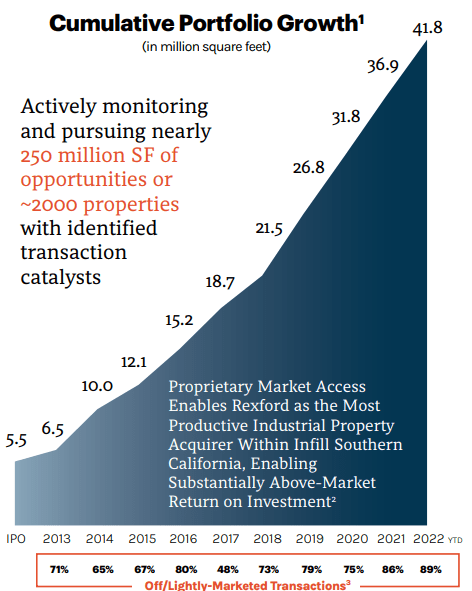
Rexford also generates phenomenal returns by redeveloping existing properties, with value creation margins approaching 100%.
Rexford investor presentation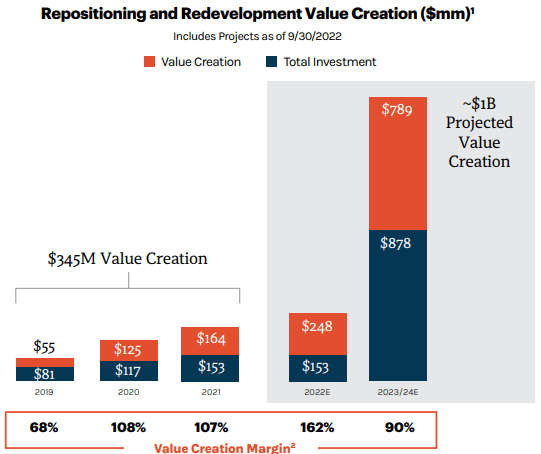
The company’s 1600 tenants engage in a variety of types of business, with warehousing and transportation, wholesale, and manufacturing combining to account for about two-thirds of REXR’s annual base rent.
Rexford investor presentation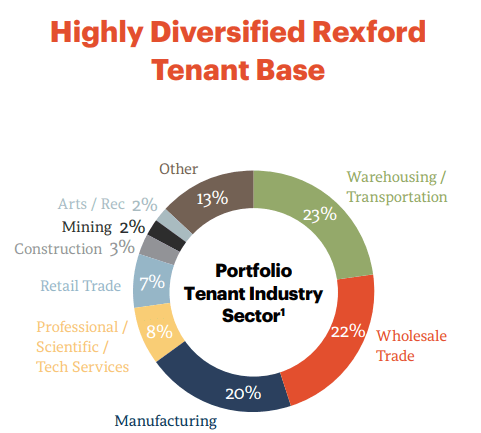
Q3 2022 operating results showed the following highlights:
- Net income of $36.8 million, up 16.8% YoY.
- Core FFO of $86.1 million, up 44.5% YoY.
- Core FFO per share of $0.50, up 16.3% YoY.
- NOI of $123 million, up 40.1% YoY.
- Same-property cash NOI up 9.7% YoY.
- Rental rates up 63%.
- Acquired 15 properties at an investment of $977 million.
REXR Growth
As a result, Rexford too is a bona fide FROG, with double-digit growth rates in revenues and cash flow, unmatched in the Industrial sector, and among the very best in all of REITdom.
| Metric | 2019 | 2020 | 2021 | 2022* | 3-year CAGR |
| FFO (millions) | $146.6 | $182.5 | $253.6 | $393.1 | — |
| FFO Growth % | — | 24.5 | 39.0 | 55.0 | 38.9% |
| FFO per share | $1.23 | $1.32 | $1.64 | $1.95 | — |
| FFO per share growth % | — | 7.3 | 24.2 | 18.9 | 16.6% |
| TCFO (millions) | $140 | $183 | $231 | $348 | — |
| TCFO Growth % | — | 30.7 | 26.2 | 50.6 | 35.5% |
*Projected, based on Q3 2022 results
Source: TD Ameritrade, CompaniesMarketCap.com, and author calculations
REXR Balance sheet
REXR’s superb investment-grade balance sheet boasts assets that more than triple their liabilities, while the debt ratio is ultra-low at just 9%.
| Company | Liquidity Ratio | Debt Ratio | Debt/EBITDA | Bond Rating |
| REXR | 3.28 | 9% | 5.4 | BBB+ |
Source: Hoya Capital Income Builder, TD Ameritrade, and author calculations
REXR Dividend
REXR’s dividend yield starts low, but climbs rapidly, and earns an ultra-safe grade of A from Seeking Alpha Premium. If held for 7 years or more, the yield on cost would likely outperform the average REIT.
| Company | Div. Yield | 3-yr Div. Growth | Div. Score | Payout | Div. Safety |
| REXR | 2.31% | 19.4% | 3.29 | 60% | A |
Source: Hoya Capital Income Builder, TD Ameritrade, Seeking Alpha Premium
REXR Valuation
REXR shares don’t appear to be favorably valued at 28.0x FFO ’22, but this company rarely trades at a multiple under 35, and over 40 is not unusual.
| Company | Div. Score | Price/FFO ’22 | Premium to NAV |
| REXR | 3.29 | 28.0 | (-14.8)% |
Source: Hoya Capital Income Builder, TD Ameritrade, and author calculations
Bottom line: REXR
Rexford is a growth powerhouse with a rock-solid balance sheet, and an elevated Price/FFO is warranted. Though the current yield is low, over 7 years or more the yield will likely exceed the REIT average, giving investors the best of both worlds.
EastGroup Properties, Inc. (EGP)
EastGroup Properties, Inc.
Founded in 1969, and headquartered in Jackson, Mississippi, EastGroup Properties owns and operates multi-tenant, shallow bay warehouse facilities, with about 56 msf in 25 primary and secondary markets, spread across 11 U.S. states. The company sits squarely in the market cap sweet spot at $6.5 billion.
EastGroup focuses on:
- Multi-tenant distribution properties
- Urban infill sites in supply-constrained submarkets
- In choice last-mile e-commerce locations
- In major Sunbelt markets
- Around transportation facilities in high-growth areas.
Over 75% of the company’s square footage is concentrated in three Sunbelt states: Texas (34%), Florida (24%), and California (21%)
EastGroup investor presentation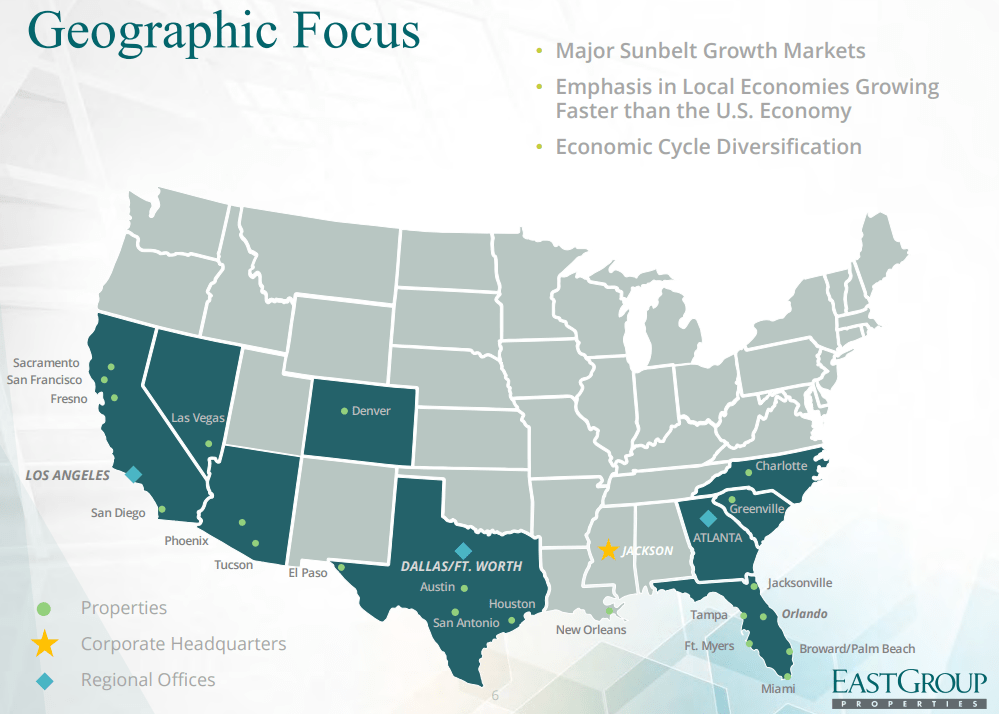
Fully 77% of EGP customers rent fewer than 100,000 square feet. EastGroup seeks customers that need to be in their location, thus competing on location rather than price.
EGP’s tenant base is well diversified. The top 10 customers account for only 8.9% of ABR (annual base rent). As of September 30, the portfolio was 99.0% leased and 98.5% occupied.
The company has built 47% of their current portfolio themselves, rather than acquiring. This year, they have added 1.7 msf at a cost of $359 million.
The company will also do value-add acquisitions in markets where they already have a presence. EGP currently has 27 development and value-add projects underway, in 14 different cities, totaling 4.9 msf, at a projected cost of $601 million.
Q3 2022 marked EGP’s 38th consecutive quarter of FFO growth. Quarterly results showed:
- FFO per share of $1.77, up 14.2% YoY.
- Same-property NOI up 8.7% YoY on a cash basis.
- Blended leasing spreads up a whopping 39.4% YoY.
- Acquired 299,000 square feet of value-add property and 108 acres of land for a total investment of $44 million.
- Completed 6 development projects, adding 817,000 square feet to the operating portfolio.
- Increased the dividend by 13.6%.
EGP Growth
With a strong balance sheet and double-digit growth in FFO and cash from operations, EGP too is a bona fide FROG.
| Metric | 2019 | 2020 | 2021 | 2022* | 3-year CAGR |
| FFO (millions) | $186.9 | $211.6 | $245.9 | $292.9 | — |
| FFO Growth % | — | 13.2 | 16.2 | 19.1 | 16.2% |
| FFO per share | $4.98 | $5.38 | $6.09 | $6.95 | — |
| FFO per share growth % | — | 8.0 | 13.2 | 14.1 | 11.8% |
| TCFO (millions) | $196 | $196 | $256 | $369 | — |
| TCFO Growth % | — | 0.0 | 30.6 | 44.1 | 23.5% |
*Projected, based on Q3 2022 results
Source: TD Ameritrade, CompaniesMarketCap.com, and author calculations
EGP Balance sheet
EGP’s balance sheet is typical of an Industrial REIT, with strong liquidity and low debt.
| Company | Liquidity Ratio | Debt Ratio | Debt/EBITDA | Bond Rating |
| EGP | 2.01 | 14% | 5.4 | — |
Source: Hoya Capital Income Builder, TD Ameritrade, and author calculations
EGP Dividend
With a dividend well above the Industrial REIT average, and a blistering 18.6% dividend growth rate, EastGroup is a better dividend payer than the average REIT, if held for at least 3 years. With a dividend safety grade of B-, there is little to worry about.
| Company | Div. Yield | 3-yr Div. Growth | Div. Score | Payout | Div. Safety |
| EGP | 3.36% | 18.6% | 4.73 | 70% | B- |
Source: Hoya Capital Income Builder, TD Ameritrade, Seeking Alpha Premium
EGP Valuation
Despite stellar growth and above-average dividends, EGP is currently trading at 21.4x FFO ’22, which is slightly below the Industrial REIT average.
| Company | Div. Score | Price/FFO ’22 | Premium to NAV |
| EGP | 4.73 | 21.4 | (-13.4)% |
Source: Hoya Capital Income Builder, TD Ameritrade, and author calculations
Bottom line: EGP
EastGroup Properties offers stellar growth and safe, above-average dividends, all at a fair price.
Be the first to comment