

Justin Sullivan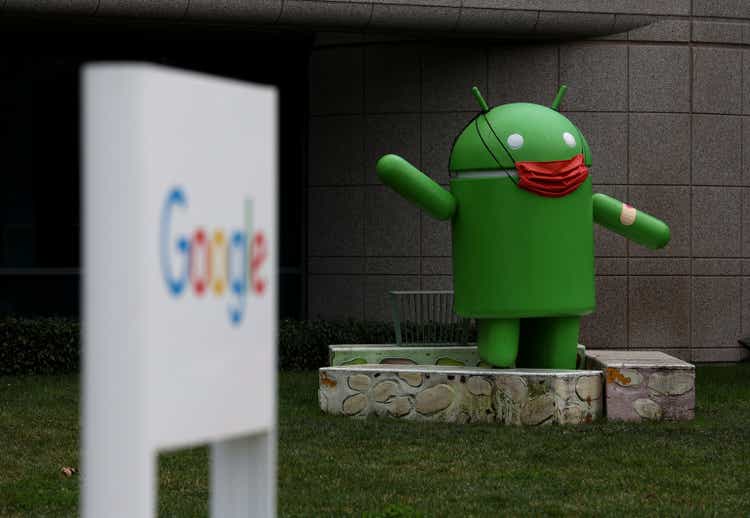
Charts created by writer from C Trader
Earnings released in July showed Google (NASDAQ:GOOG) (NASDAQ:GOOGL) missing estimates, but not by an overly concerning number. However, there were some notable misses in certain areas, which may explain the lack of investor appetite that has now seen Google technically break into a further macro lower low.
This year Google split its stock opting for a 20-1 split meaning that holding one share before the split would mean you own 20 today, in fact this stock split was one of the largest in recent history for the S&P index.
Google’s latest quarter release for revenue growth slowed to 13% down from 62% in the same quarter last year with key advertising revenue increasing by 12% the most notable halt was in YouTube advertising with sales rising 5% having risen 84% in the same period last year.
With companies not clearing the go ahead for a big tech advertising budget with concerns other areas of the business may need hatches battening first, Google’s share price has seen no signs of making a bullish wave upwards over the last few months and has eventually given up the ghost and broke into a lower low. Now we can move to the charts to start to identify where Google’s bearish number may lie next.
Google Monthly Chart (C Trader )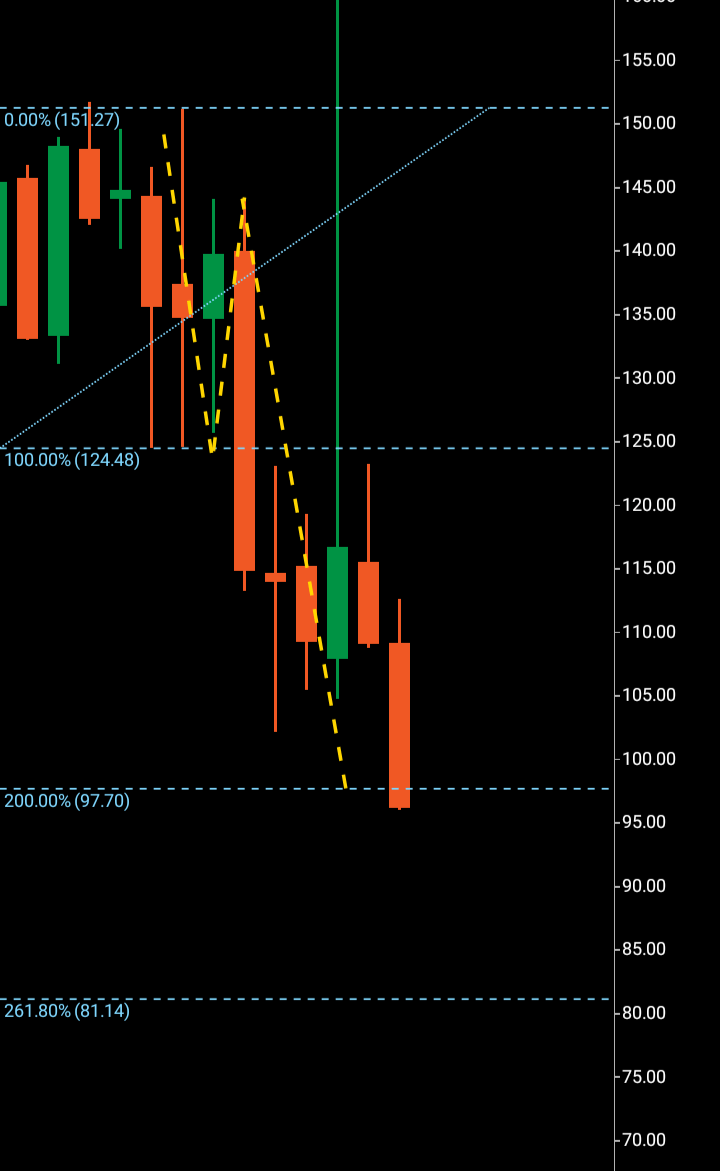
Above we can see the current monthly macrostructure. Starting with the wave one we can see a bearish candle spanning whole wave $151-$124 with the bullish candle $124-$125 confirming the wave two.
A break of $124 and the target replication of wave would was $97 which has just been achieved. Barring an immediate turn around which does look technically unlikely given the signaled lack of buying orders with this monthly candle ending in very bearish fashion having ended at its target with virtually no wick suggesting no willing buyers at this price.
So it is the Fibonacci 261% that all eyes turn to in the event of an imminent turnaround failing which we can see lies at $81.
Google Weekly Chart (C Trader )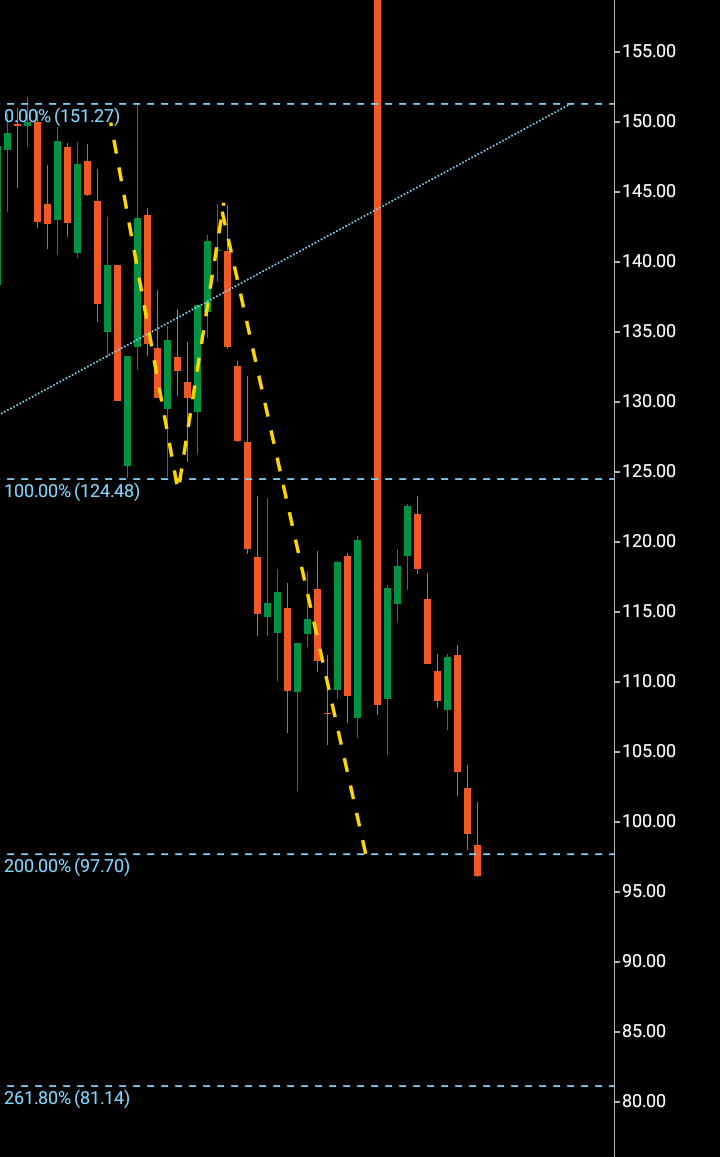
Now moving to the weekly chart we can see, particularly after the stock split, there has been no attempt at forming a bullish weekly wave structure with the stock simply falling and creating a bullish candle that signals formation only to take the stock lower. In order to form any wave pattern there must be in bullish form a bearish rejection and bearish form a bullish rejection. A candle must close like this in the wave two to be then beaten in the opposite direction of its formation to commence the third wave onto the next price region. There, it will then make a decision by wave form of repeating itself and carry on in that direction or choose not to and look to form a wave pattern in the opposite direction leading to a turnaround.
Google Monthly Chart (C Trader )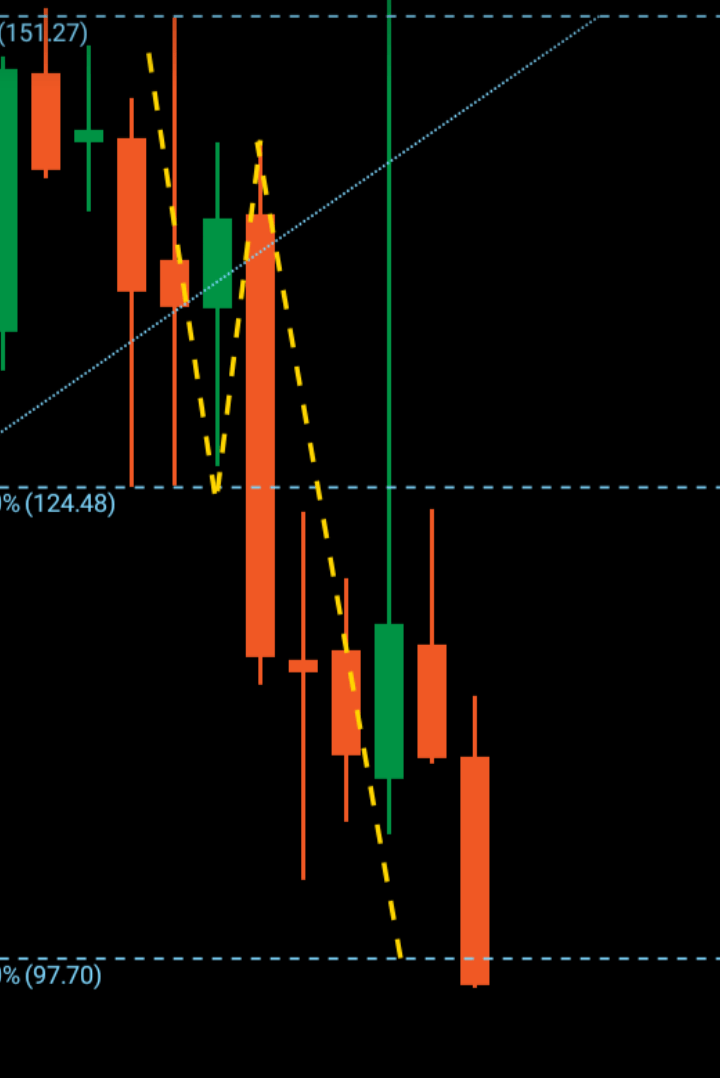
In this case it is the former, on the monthly chart above we can see the bearish third wave break below $124 and price moves to the next region with in this case, a target of $97. Technically, the stock has chosen to again continue in its original direction and onto an additional lower price region.
I would expect Google to arrive at its $81 target within the next 60-120 days. I will be looking at how it reacts both now at this price area and $81 should it reach that for signals of a bullish turnaround.
About the Three Wave Theory
The three wave theory was designed to be able to identify exact probable price action of a financial instrument. A financial market cannot navigate its way significantly higher or lower without making waves. Waves are essentially a mismatch between buyers and sellers and print a picture of a probable direction and target for a financial instrument. When waves one and two have been formed, it is the point of higher high/lower low that gives the technical indication of the future direction. A wave one will continue from a low to a high point before it finds significant enough rejection to then form the wave two. When a third wave breaks into a higher high/lower low the only probable numerical target bearing available on a financial chart is the equivalent of the wave one low to high point. It is highly probable that the wave three will look to numerically replicate wave one before it makes its future directional decision. It may continue past its third wave target but it is only the wave one evidence that a price was able to continue before rejection that is available to look to as a probable target for a third wave.
Be the first to comment