Prykhodov
Thesis: a database of intentions
The title was stolen from John Battelle, who made the following farsighted comments back in 2003 (slightly edited with the emphases added by me):
The Database of Intentions is simply this: The aggregate results of every search ever entered, every result list ever tendered, and every path taken as a result. It lives in many places, but three or four places in particular hold a massive amount of this data (i.e., MSN, Google, and Yahoo). This information represents, in aggregate form, a placeholder for the intentions of humankind – a massive database of desires, needs, wants, and likes that can be discovered, subpoenaed, archived, tracked, and exploited to all sorts of ends. Such a beast has never before existed in the history of culture but is almost guaranteed to grow exponentially from this day forward.
These comments were so farsighted that they accurately captured the amazing or scary power depending on your perfective of tech giants 20 years ago. And two of the three dominating databases that he named at that time are still dominating players at our time 20 years later: Microsoft (MSFT) and Google (NASDAQ:GOOG) (NASDAQ:GOOGL), through their vast network of software and platforms, are still the two largest databases of intentions.
And this leads me to the thesis for today – really John Battelle’s thesis. I foresee Battelle’s thesis to keep being valid for the long-term going forward, if not more so. In particular, for GOOG, despite the near-term headwinds it faces, its real moat remained intact: the combination of this powerful database and its leading search engine still almost guarantees exponential growth ahead.
And yet, such a powerful combination is currently for sale at only about 17x PE, even lower than what’s on the surface as you will see next.
GOOG: accounting EPS vs. owners’ earnings
Based on its accounting earnings (either GAAP or non-GAAP), GOOG is currently priced at about 19.5x to 20x PE as of this writing), which is already very reasonable in my view given the wide moat and superb profitability of the core business.
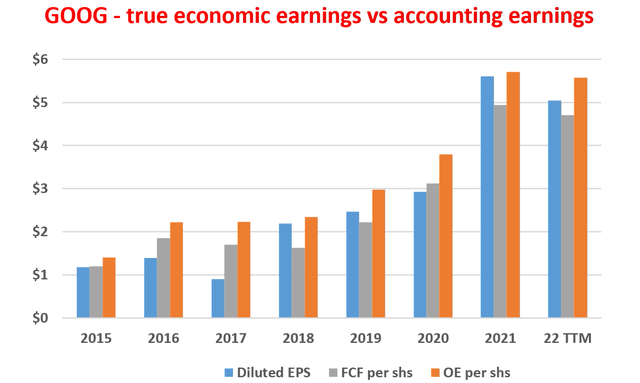
But the accounting earnings do not reflect its true owners’ earnings (“OE”). It underestimates its true earning power, and hence its real PE is actually even lower, as illustrated in the next chart. This chart compares its GAAP EPS, free cash flow (“FCF”) per share, and its OE per share. As seen, its FCF has been either close to or higher than its EPS. Its so-called FCF conversion rates on average exceeded 100% in the past (with a 10-year average of around 106%), which is already a sign of the underestimating nature of the accounting EPS.
Now, remember that FCF itself is on the conservative side. Because in the calculation of the FCF, ALL CAPEX expenses have been subtracted from the operating cash flow, although only the maintenance CAPEX should be subtracted from the business owner’s point of view.
And next, we will see that the above consideration would lead to an OE that is even higher than the FCF (shown by the orange bars in the chart).
Author based on Seeking Alpha data
GOOG: separating maintenance and growth CAPEX
The key insights for analyzing OE have been provided by Warren Buffett decades ago. The basic idea is that growth CAPEX is not a cost because it is OPTIONAL. The difficulty lies in estimating what part of the total CAPEX is for mandatory maintenance and what part is for growth. The analysis requires a more advanced understanding of business fundamentals and the interplays among the financial statements. The method I use here is Bruce Greenwald’s method, readers interested in the details could see the steps either in my earlier article or in Greenwald’s book entitled Value Investing. The key assumptions in this approach are summarized below:
The ratio of PPE (properties, plants, and equipment) to sales is first calculated. A five-year moving average is then taken on this ratio, which is then used to approximate the dollars of PPE it takes to support each dollar of sales to arrive at the maintenance CAPEX. One The maintenance CAPEX is obtained, then the growth CAPEX is straightforward: it equals the total CAPEX minus the maintenance CAPEX.
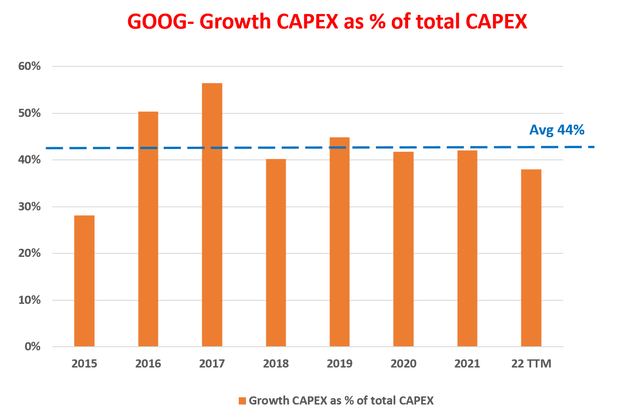
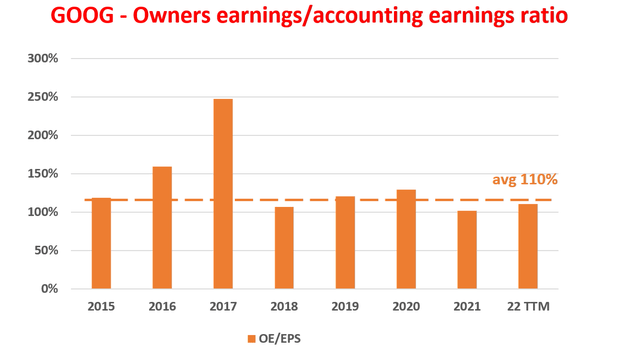
The end results are shown in the following two charts. The first chart shows GOOG’s growth CAPEX as a percentage of its total CAPEX over the years, and the second chart shows its OE to EPS ratio over the years. As can be seen,
- Almost a quarter (24% to be precise) of Google’s CAPEX is for growth and should not be considered a cost, as shown in the first chart below.
- This is the reason that GOOG’s OE has been significantly and consistently higher than both its FCF and EPS as aforementioned.
- To wit, the OE is higher than the accounting EPS on average by about 10% as seen in the 2nd chart below.
As mentioned above, GOOG is currently priced at about 19.5x to 20x PE based on its accounting earnings (either GAAP or non-GAAP). Considering the fact that its OE is higher than its accounting EPS by 10% on average, its real PE will be about 10% below the accounting PE (i.e., in a range of 17.5x to 18x).
Then do not forget that GOOG also has a sizable net cash position (to be elaborated on next), which further reduces its real PE to about 17x only.
Author based on Seeking Alpha data Author based on Seeking Alpha data

Risks and final thoughts
GOOG faces several headwinds (digital ad slowdown, currency headwinds, et al). These risks have been detailed in other SA essay articles and I don’t want to further add on here. Since the angle of this article is based on its role as a database of intentions, I will make a few comments on the risks of this unique role. The role, despite its potential power (or probably because of its potential power), invites plenty of government scrutiny and regulatory risks. For this reason, GOOG does not enjoy the best “likability” score in my mind. Out of all the FAAMG stocks, my feeling is that AAPL has the highest “likability” score. And unfortunately for GOOG, I do not see how its likability score can be improved in the near or even mid-term given its reliance and dominance on search. It may (and it is) diversify its revenue streams with a multitude of initiatives (phones and other hardware, Waymo, Fiber, et al). But in one way or another, these initiatives all hinge on its search engine and database of intentions.
All told, this article’s main thesis is really to argue that John Battelle’s thesis put forward 20 years ago is still valid today, probably even more so. Despite the near-term headwinds, GOOG’s real moat remained intact: the combination of this powerful database and its leading search engine. Such a wide moat still almost guarantees exponential growth ahead. Thanks to recent market corrections, such a powerful combination is only priced at about 17.5x to 18x PE in terms of owners’ earnings. Finally, GOOG also has a sizable net cash position on its balance sheet as shown below. It actually has the largest net cash position on its balance sheet among the FAANG stocks both in absolute terms and relative terms (as you can see by its lowest debt/capital ratio). To wit, it has about $1.7 dollar of cash behind each share, once such cash position is adjusted, its PE is close to 17x only.


Be the first to comment