

patpitchaya/iStock via Getty Images
The investment thesis
I have been a long-time bull on Google (NASDAQ:GOOG) (NASDAQ:GOOGL). And the thesis is really straightforward the way I see it – at least for long-term investors. There is no need to deny the short-term headwinds as many other SA articles have explored in depth. However, if you are willing to look beyond these near-term issues, GOOG offers broad appeal for accounts with 3~5 years horizon. The stock combines the highest rank of financial strength, excellent growth prospects, and a very compressed valuation. And I will detail all these aspects in the remainder of this article.
All told, I see it holding above-average capital appreciation potential for the next 3 to 5 years (i.e., 2025-2027). To wit, the chart below (to be detailed in the next section) shows our projected annual return for GOOG and the overall market represented by the S&P 500 index. As seen, GOOG is projected to provide about 10.5% annual return (“ROI”) at its current price of around $101. It is already more than 3% above the overall market at its current valuation of around 19.5x PE. And given the market volatilities, I think investors have a good chance of grabbing some shares around $95. And you will see later that at such a price, its PE would be only 18.1x adjusted for its cash position, leading to an 11% annual return potential.
With such a wide margin of safety and lead above the overall market, it is truly a buy-and-forget stock. All we need is just to give it some time for the market volatility to run its course and for GOOG’s initiatives like its Cloud and ecosystem to grow.
Source: author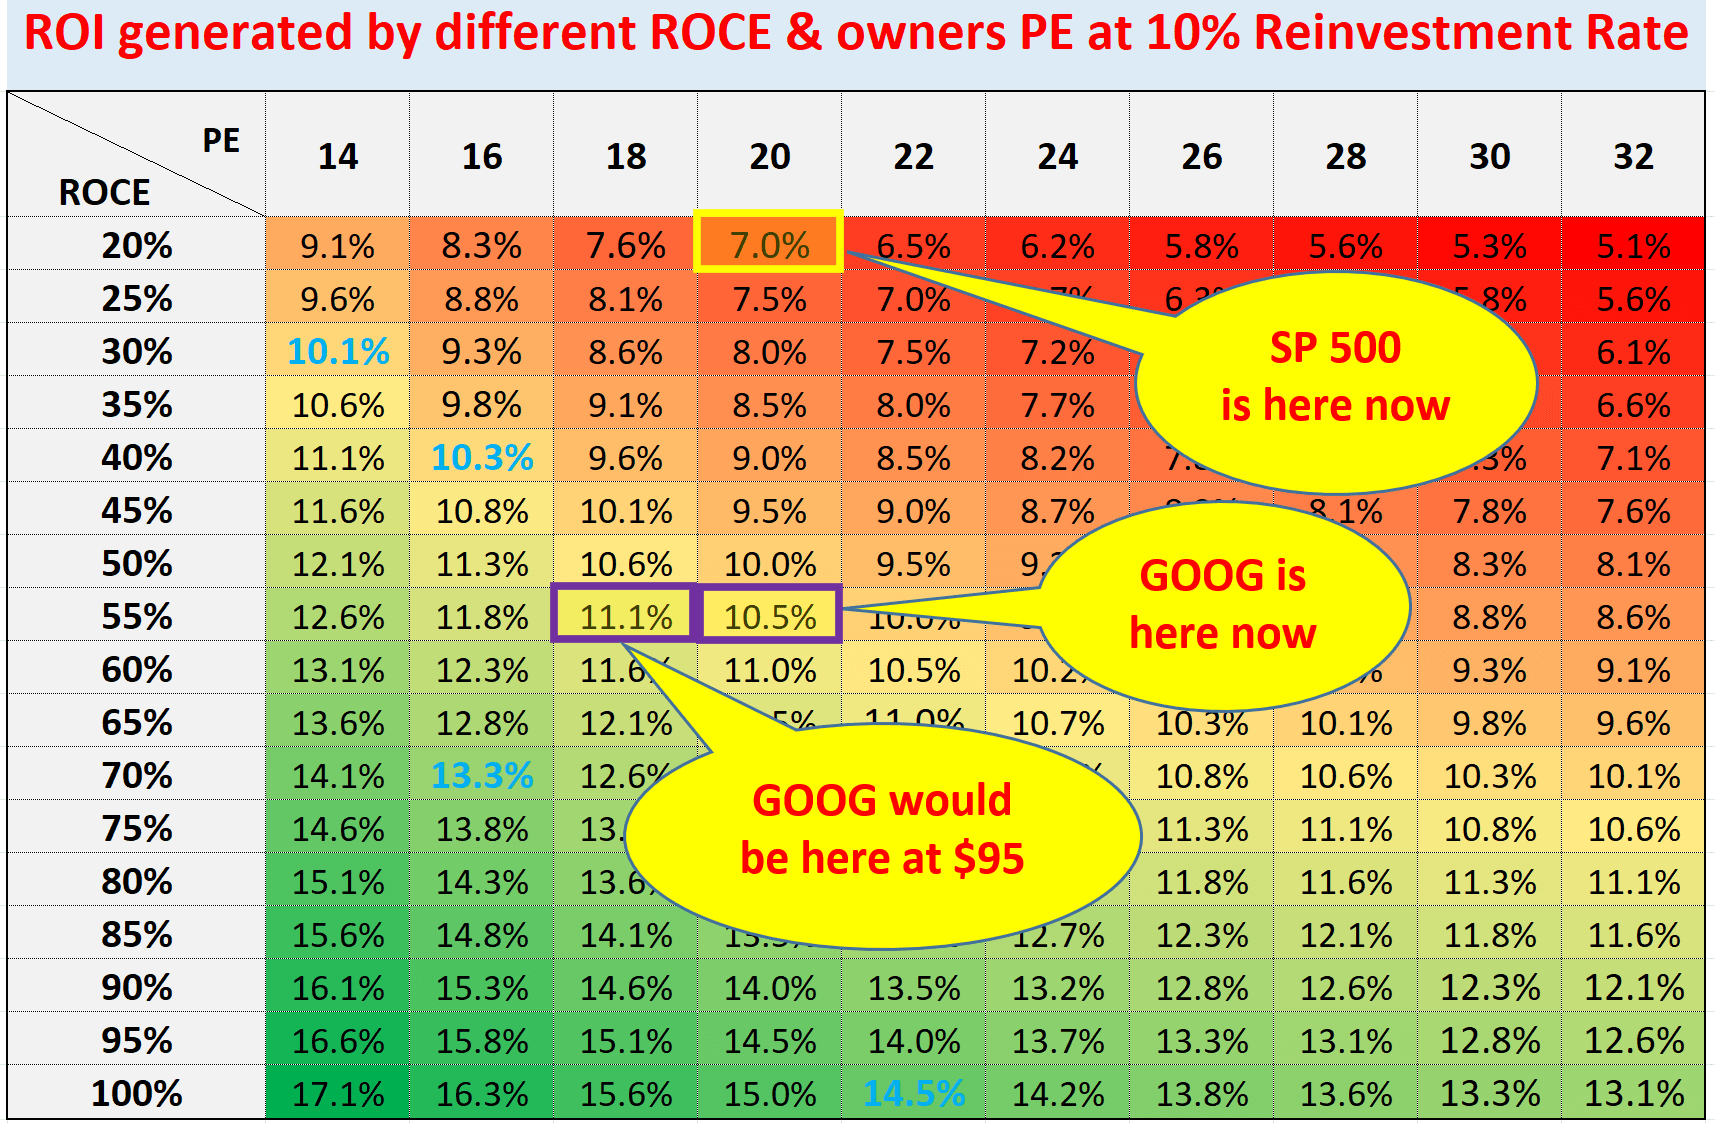
Our roadmap
First, a bit of background on the roadmap. We use it in all our investment decisions and in our market service to help us and our members focused on the long-term like business owners, not stock traders. As detailed in our earlier article:
- The long-term ROI for a business owner is simply determined by two things: A) the price paid to buy the business and B) the quality of the business. More specifically, part A is determined by the owner’s earning yield (“OEY”) when we purchased the business. And that is why PE is the first dimension in our roadmap. Part B is determined by the quality of the business and that is why ROCE, the most important metric for profitability, is the second dimension in our roadmap.
- Now, the long-term growth rate is governed by ROCE and the Reinvestment Rate. These are the two most important growth engines, and they mutually enhance each other. High ROCE means every $1 reinvested can lead to a higher growth rate, which leads to more future profits and more flexible capital allocation to fuel further growth, and so on. So to summarize:
- Longer-Term ROI = valuation + quality = OEY + Growth Rate = OEY + ROCE*Reinvestment Rate
How did our roadmap perform?
Using our UTMA account as an example, our current holdings are listed in the chart below. And their place on our roadmap is highlighted in blue in the chart above. Note that for some holdings (like HPQ and MU, the PE is so compressed that they are off this chart).
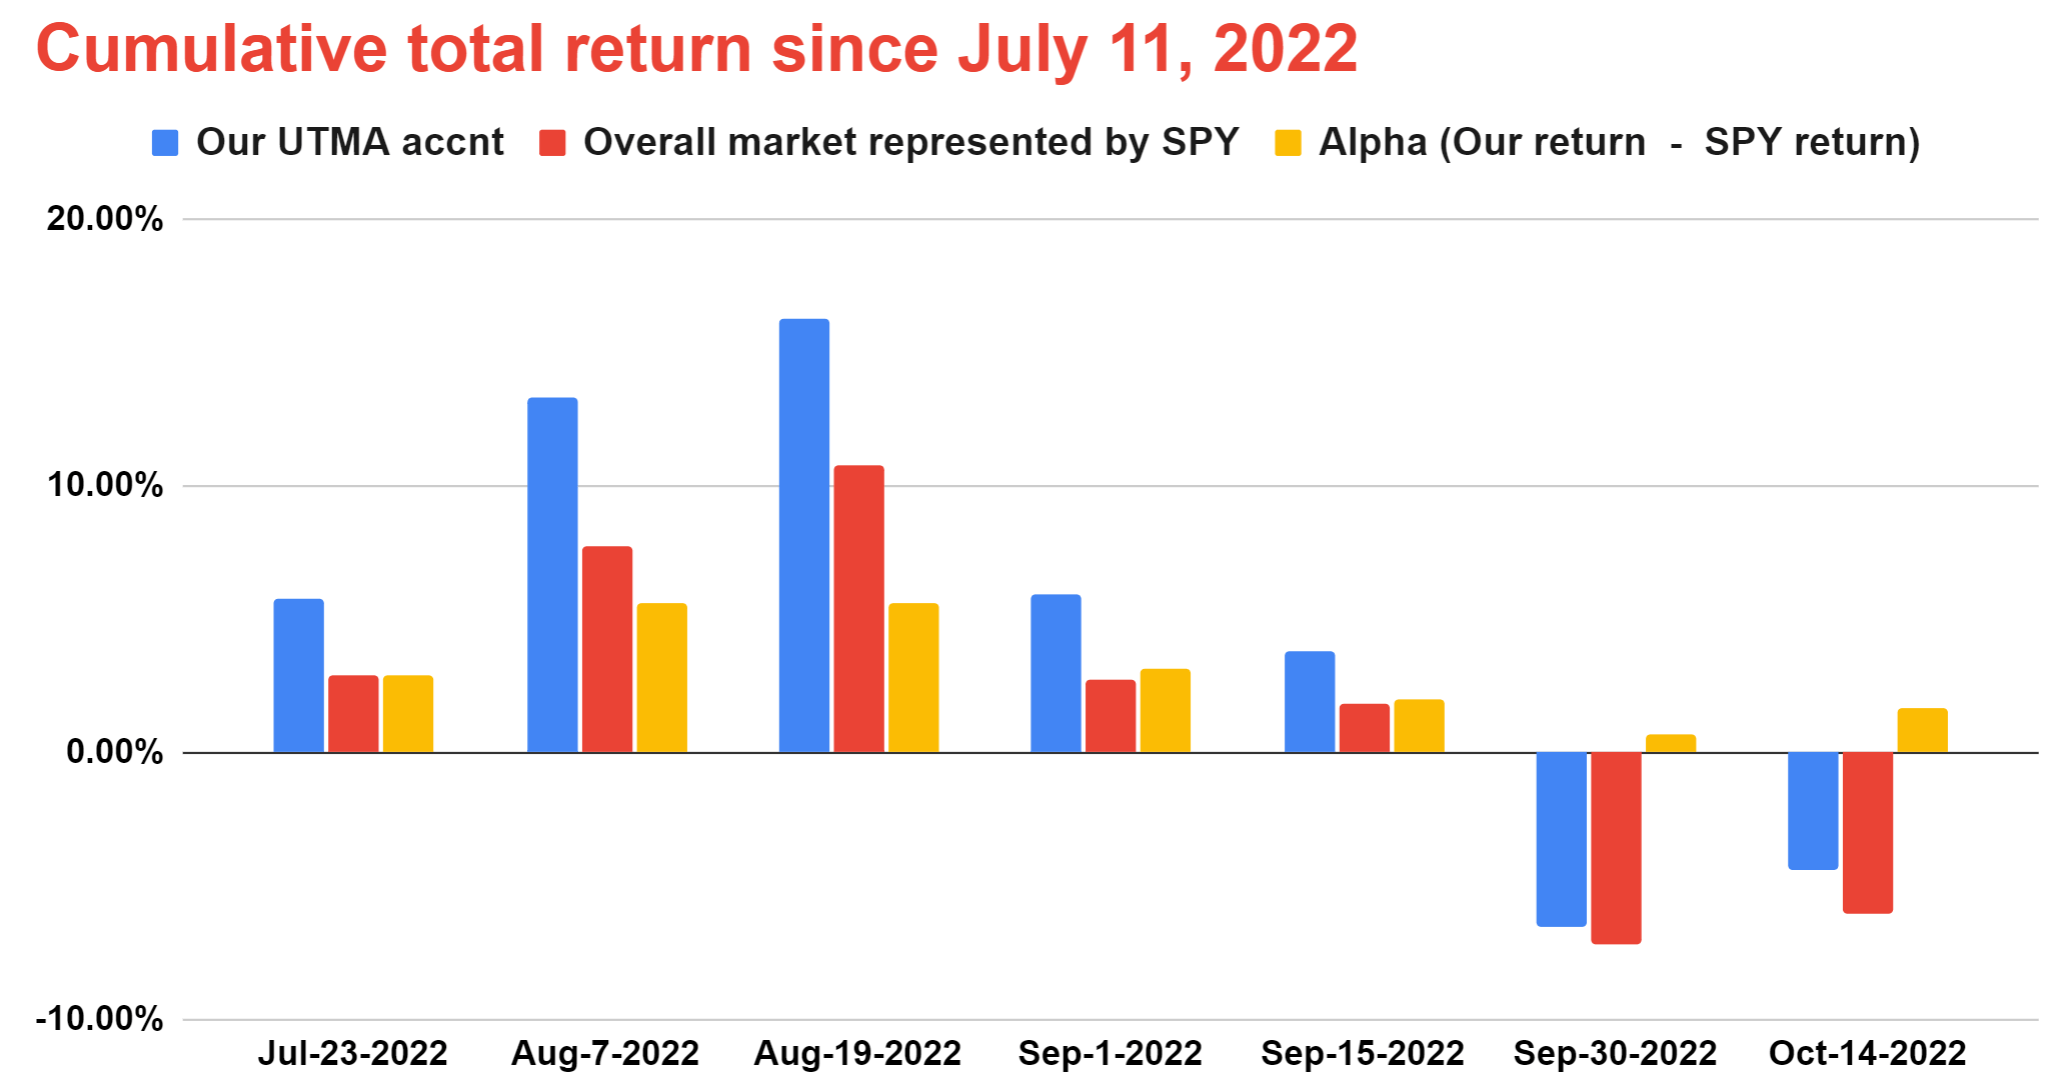
For performance tracing purposes, I used the prices on July 11, 2022 (the date I first published this portfolio) on SA as the entry price to make it easier for readers to track its performance. As you can see, the account is leading SPY by a small margin of 2.60% based on the prices as of Oct 21. Also, note that our holdings have a much higher dividend yield of 4.21% currently than the overall market (1.61%). And the return comparisons are adjusted for dividends.
As you can also see, thanks to the roadmap, we were able to beat the market both in terms of performance and downward volatility with only 6 stocks during a highly turbulent period of time.
Source: author. Source: author.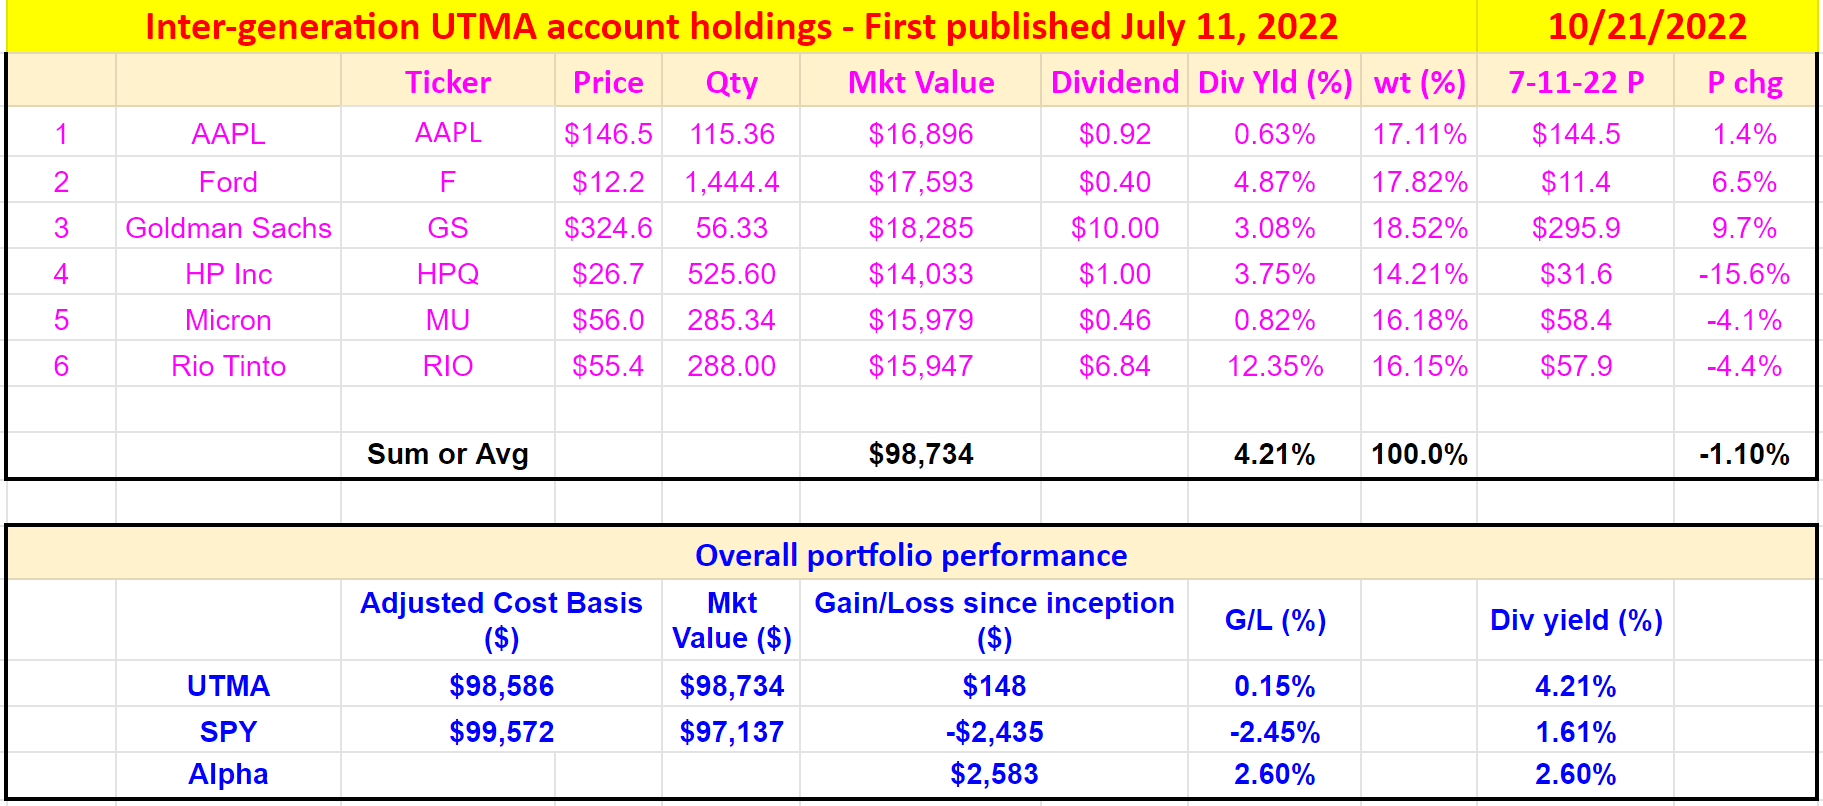
GOOG: top-ranked safety and profitability
After the overall background, let’s get back to GOOG.
First, its balance sheet remains in fortress strength. At the end of the June quarter, cash & equivalents sat at about $125 billion, translating into $1.37 per share. At the same time, the long-term debt load was only hovering at about $14.8 billion, leaving a large net cash position. Furthermore, such light leverage affords it a convenient path to funding should the company require financing for strategic growth acquisitions. Also, the valuation becomes even lower when the cash position is adjusted for.
To wit, at a target price of $95, the effective entry price would be only about $93.6 ($95 – $1.37 of cash per share). With its FW EPS around $5.15 according to consensus estimates, its adjusted FW PE is only 18.1x.
Yet, its profitability is quite healthy (actually terrific) in all metrics even when compared to the overachieving FAAMG group as seen below. Take the gross margin as an example. GOOG features a gross margin of around 56.7%, only second to META’s 80.4% in this group. In terms of net margin, its 25.9% net margin is also highly competitive and is again only second to META’s 28.1%.
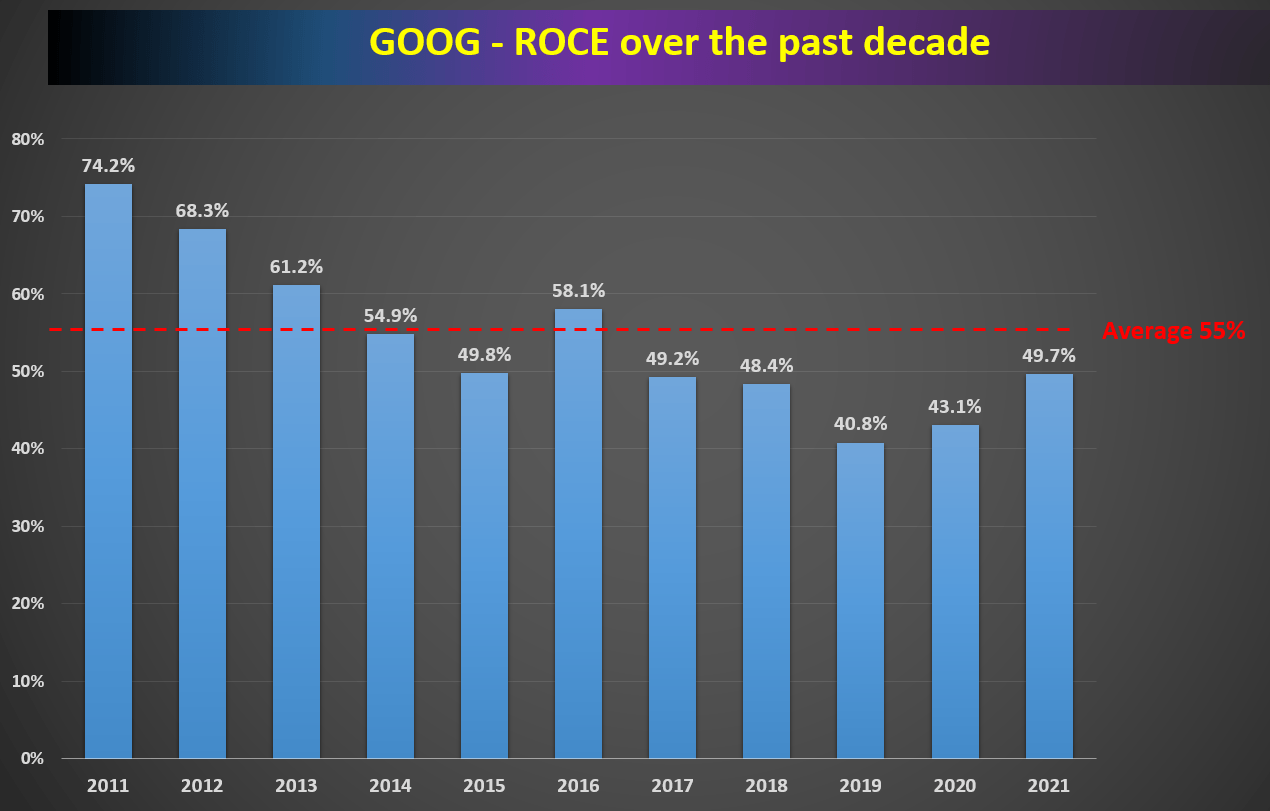
Besides these margin metrics, the next chart also shows its ROCE (return on capital employed) over the past decade. I see ROCE as the most important profitability metric because it measures the return of capital ACTUALLY employed. And examine the ROCE over a longer time provides insights into the durability of its moat. As seen, its ROCE has been excellent over the years with an average of about 55%. To put things under perspective, this level of ROCE is only lower than AAPL and MSFT in the FAAMG group.
Source: Seeking Alpha data Source: author and Seeking Alpha.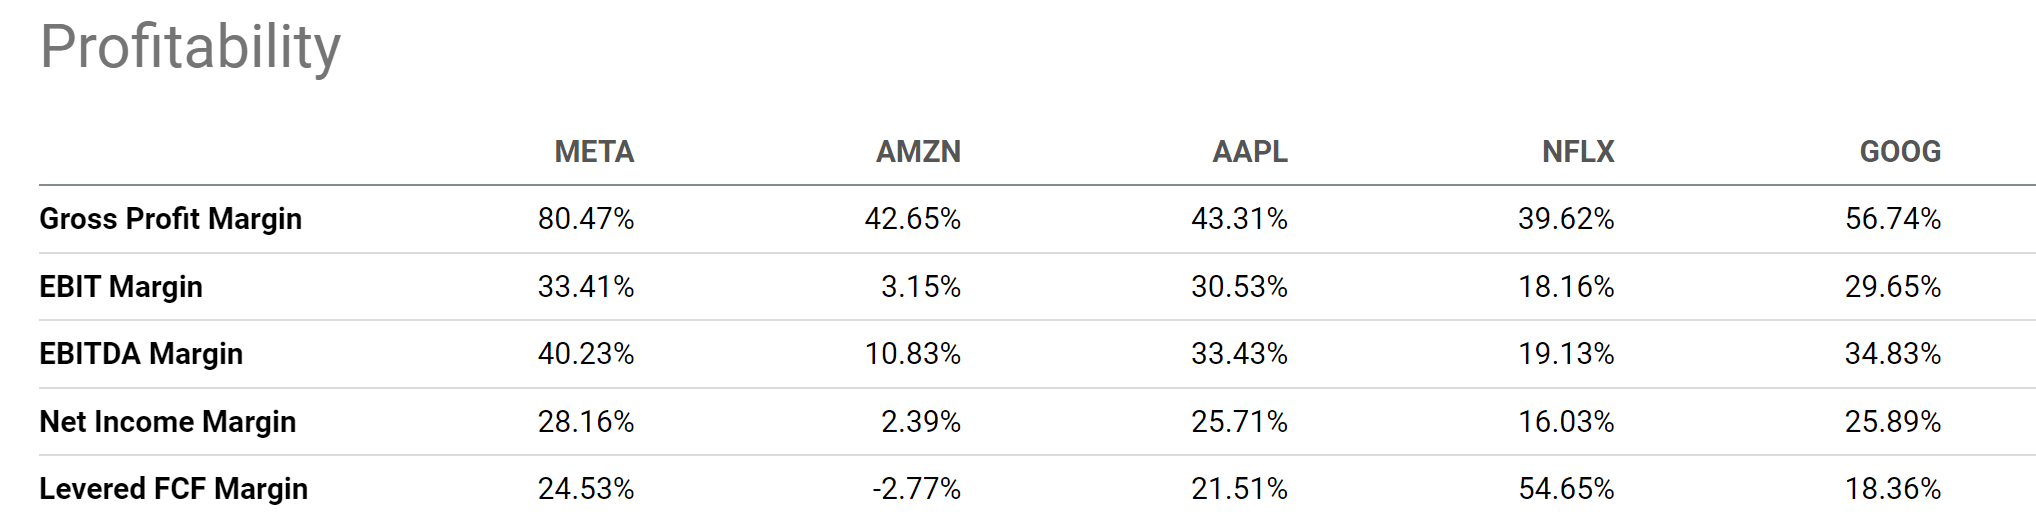
GOOG: business outlook and growth potential
The growth perspective is quite rosy – again, once you look past the -term issues (to be detailed in the risk section). Its second-quarter revenues rose to $69.7 billion, representing a year-over-year advance of 13%. Its Google Search and Google Cloud segments were the main drivers behind the increase. And in my mind, the two existing drivers will keep fueling growth in the next few years. Especially its cloud business. It is the fastest-growing cloud computing giant according to this IOT report:
The cloud market is dominated by three US-based firms that have seen their revenues grow at high double digits for years, with 2021 being no exception. Among the leading firms, both Google Cloud and Microsoft Azure reported 2021 revenue growth near 50% and are closing in on market leader AWS.
The global public cloud market reached $157 billion in 2021and is expected to grow into a $2 to $10 trillion industry in a few years according to another lOT report. With its rapid growth rate, I see GOOG best poised to capitalize on this secular trend.
Another growth engine involves its growing ecosystem. It is related to its cloud but is also beyond. According to the recent Google Developer Conference (September 14-15, 2022), the Android system has been running on more than 3 billion devices. With such a large number of products, GOOG sits on a gold mine of opportunities across a multitude of products, devices, and platforms. It has the potential to offer consumers cross-platform interactive experiences the way AAPL does.
Source: IOT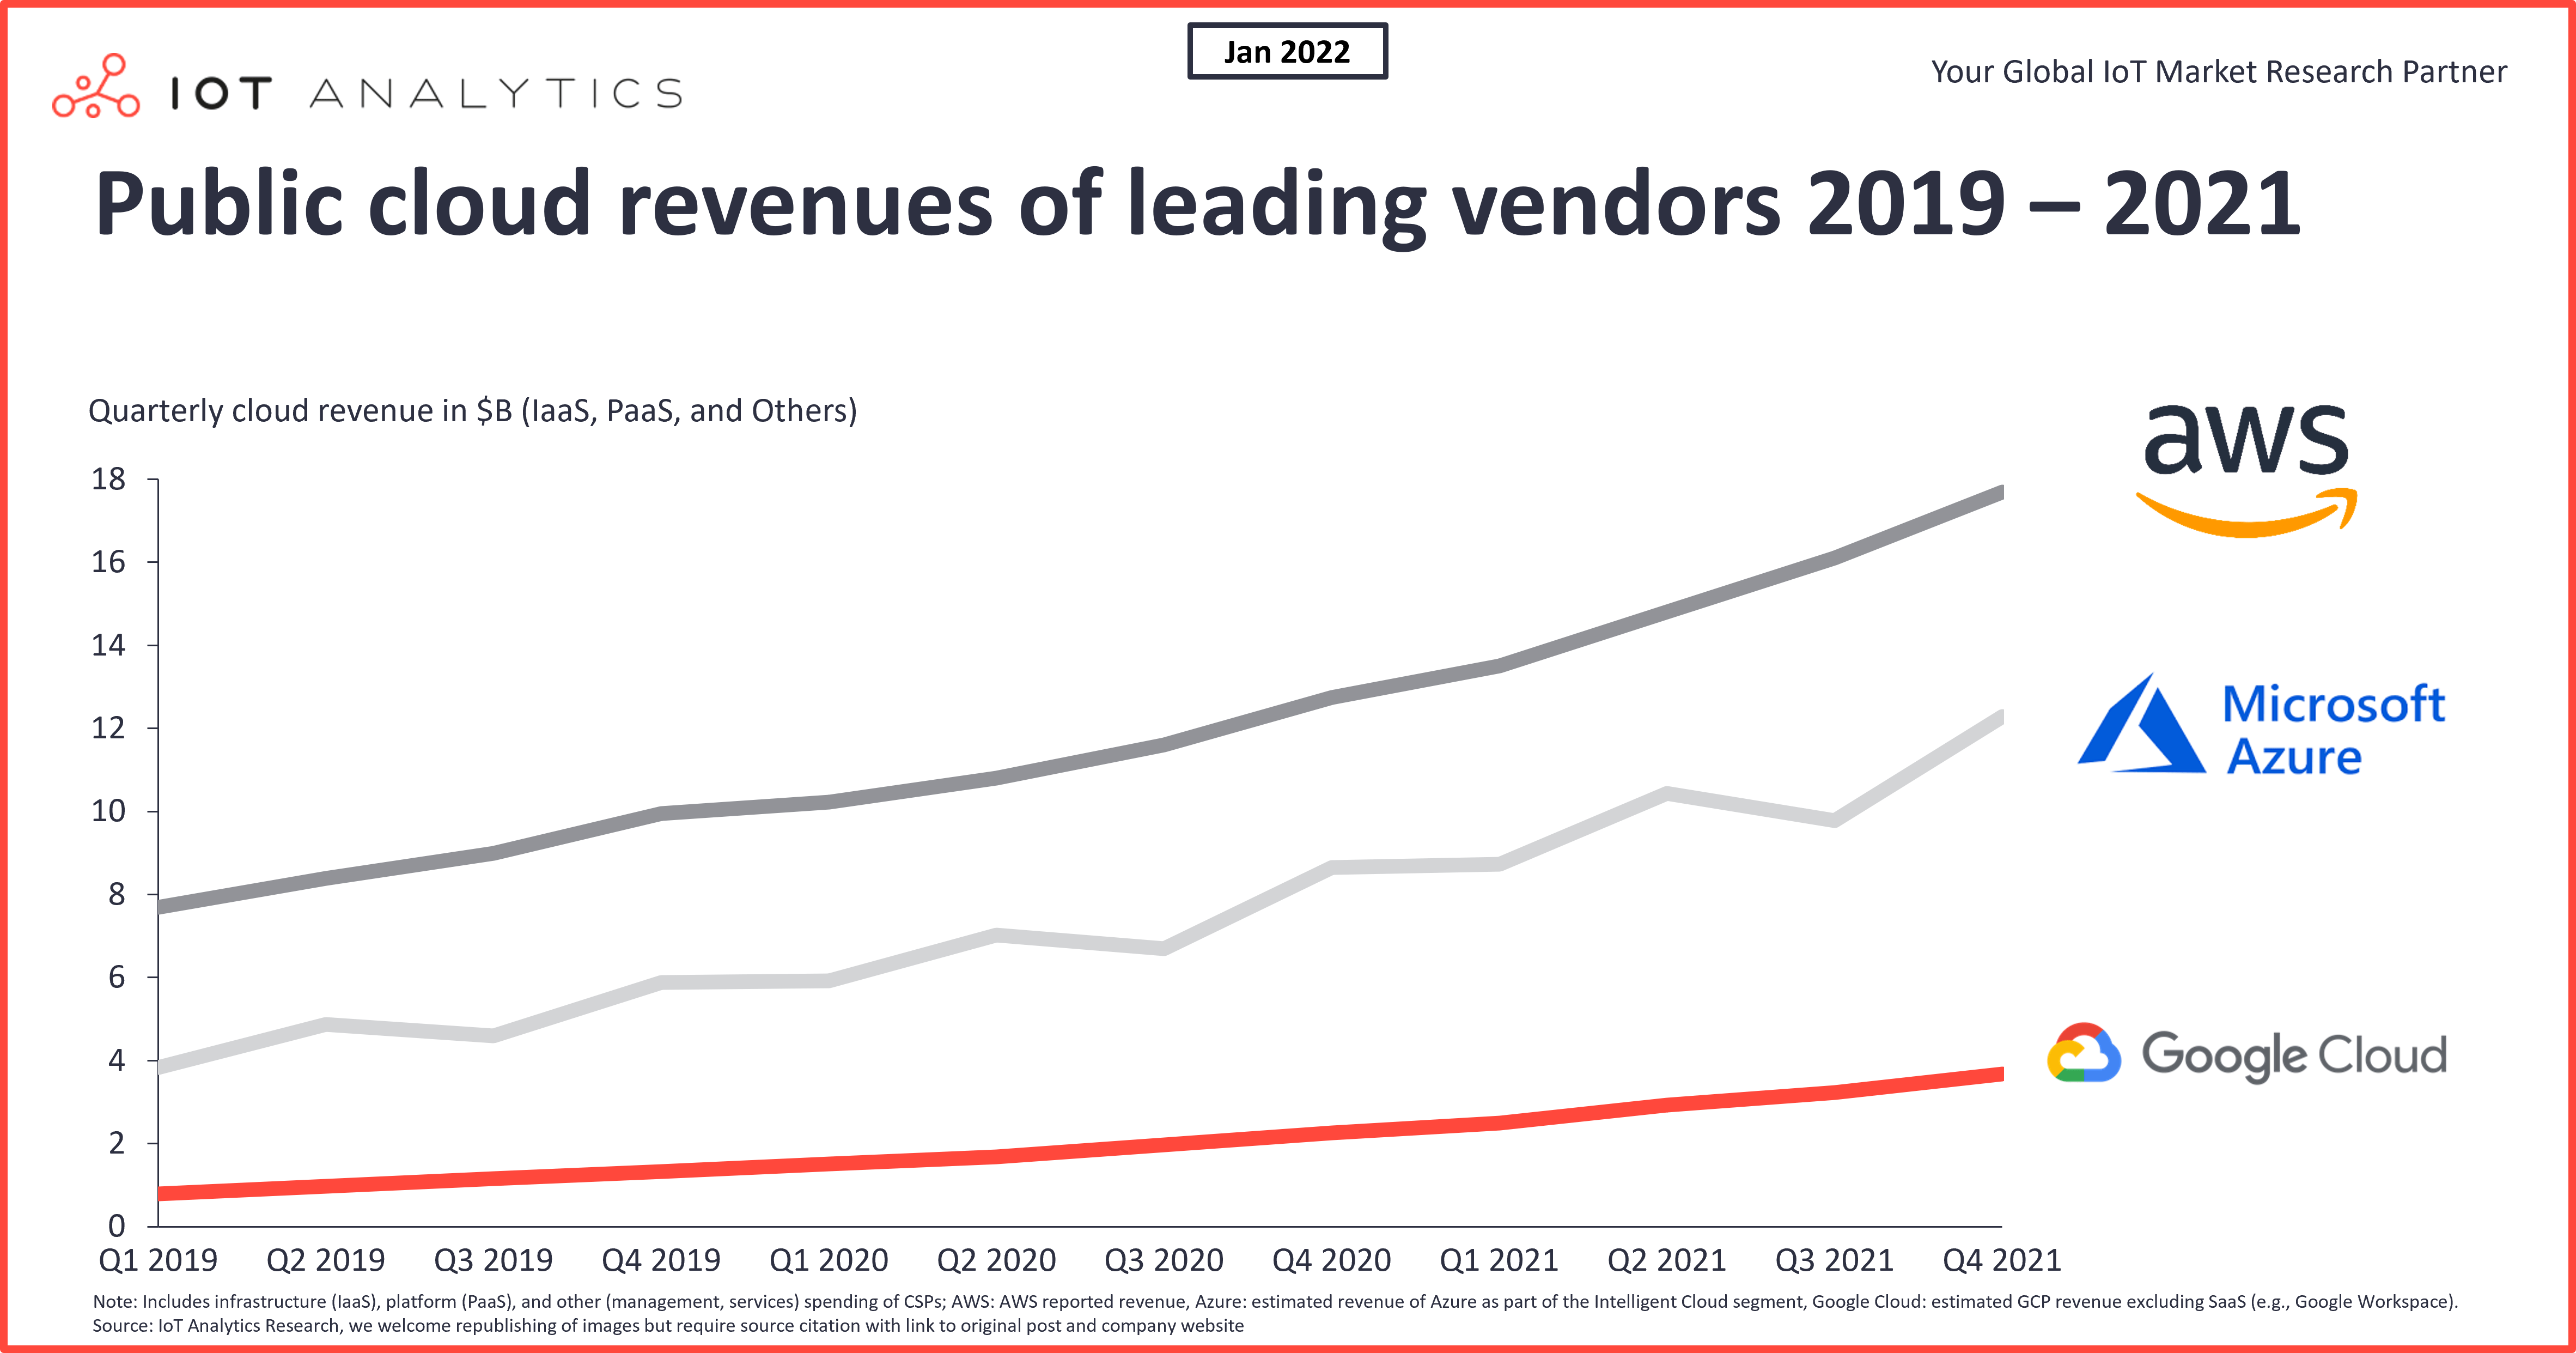
GOOG: Back to the roadmap
Now, let’s go back to the roadmap and wrap up. Again, at its current price levels, the OEY (owners earning yield) is ~5.1% (based on an FY1 FW PE of 19.6x). The growth rate is projected to be about 5.5% for GOOG by assuming a 10% reinvestment rate and 55% average ROCE as mentioned above (long-term growth rate = ROCE * reinvestment rate = 55% * 10% = 5.5%). As a result, the total expected return is about 10.5% at the current price.
At the target price of $95, the effective entry price would be only about $93.6 after adjusting for its cash as mentioned above. And its FW PE would only be 18.1x, translating into an OEY of 5.52%. Combined with the projected growth rate, the total return potential would be about 11%.
Source: author
Final thoughts and risks
Again, there is no shortage of risks in the near term. These risks include geopolitical considerations and currency headwinds, which are both common and important for multinational enterprises like GOOG. It has been combating rising costs lately, ranging from labor costs to general inflation. Besides the macroeconomic risks, GOOG constantly faces fierce competition and regulatory risks. For example, the rising popularity of short videos is pressuring its YouTube segment. And it has recently been fined by the European Union for violating the EU antitrust rules.
But once we look past these near-term issues, I see a buy-and-forget stock. The stock offers an all-around enticing package combining the highest rank of financial strength, excellent growth prospects, and double-digit annual return potential. At a target price of $95, the total return potential is projected to be about 11%, translating into an OEY of 5.52% consisting of about 5.5% of OEY and another 5.5% of organic growth. And note that my projection is on the conservative side here. Consensus estimates project its EPS growth to be 11.2% in the next 6 years as shown below. I won’t be surprised at all if the growth rates exceed my conservative estimates given the highly nonlinear opportunities such as its Cloud and the evolution (or even revolution) of its ecosystem.
Source: author and Seeking Alpha.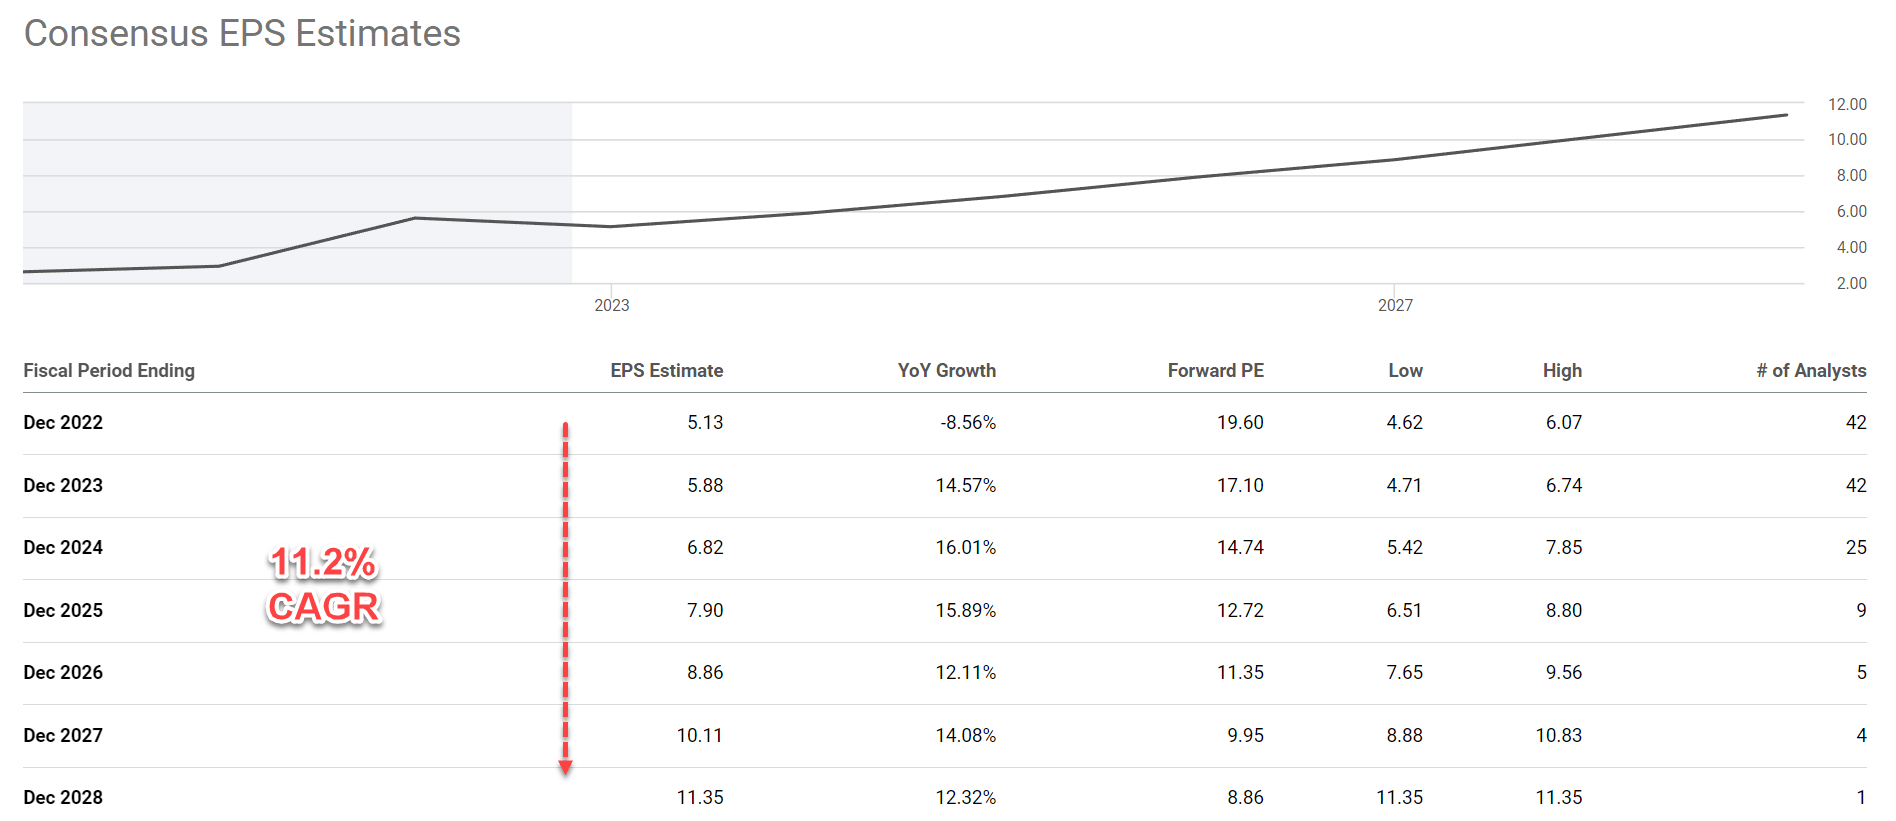
Be the first to comment