

peepo
Prologue
Nearly two weeks ago we wrote about ‘hedging through shorting’, while presenting our short positions in two 3x-leveraged ETFs: ProShares UltraPro QQQ ETF (NASDAQ:TQQQ) and Direxion Daily Semiconductor 3x Bull Shares ETF (SOXL).
In this article, we wish to remain within the same theme (hedging through shorting) and elaborate on this topic, particularly touching upon two very important aspects that are (not only related but) crucial to the theme:
1) Leveraged ETFs (in general): Buy vs. Sell, Pros and Cons, Risk and Reward.
2) Live demonstration of how leveraged ETFs’ mechanics work (or don’t work…): Specific examples using two pairs of growth/tech leveraged ETFs:
- Big Tech: ProShares UltraPro QQQ (TQQQ) vs ProShares UltraPro Short QQQ (NASDAQ:SQQQ)
- Semiconductors: Direxion Daily Semiconductor 3X Bull Shares ETF (SOXL) vs Direxion Daily Semiconductor 3X Bear Shares ETF (SOXS)
Leveraged ETFs – Key Features
Buy vs Sell
This is likely the most important aspect to keep in mind.
Since leveraged ETFs use options/derivatives to achieve the magnifying element (leveraging) – any leveraged ETF, by definition, suffers from time decay, aka “Theta”.
Time decay is a measure of the rate of decline in the value of an options contract due to the passage of time. Time decay accelerates as an option’s time to expiration draws closer since there’s less time to realize a profit from the trade. – [Source]
What you need to know:
- The closer an option is to its expiry date – the more rapidly it’s losing money (to time decay).
- An “At The Money” (“ATM”) option will receive the biggest premium at the start, but will lose the most, at an accelerating pace, towards the end.
- An “In The Money” (“ITM”) option will receive the smallest premium at the start, and it will lose that premium, at a fairly steady pace, along its life.
MyOptionsEdge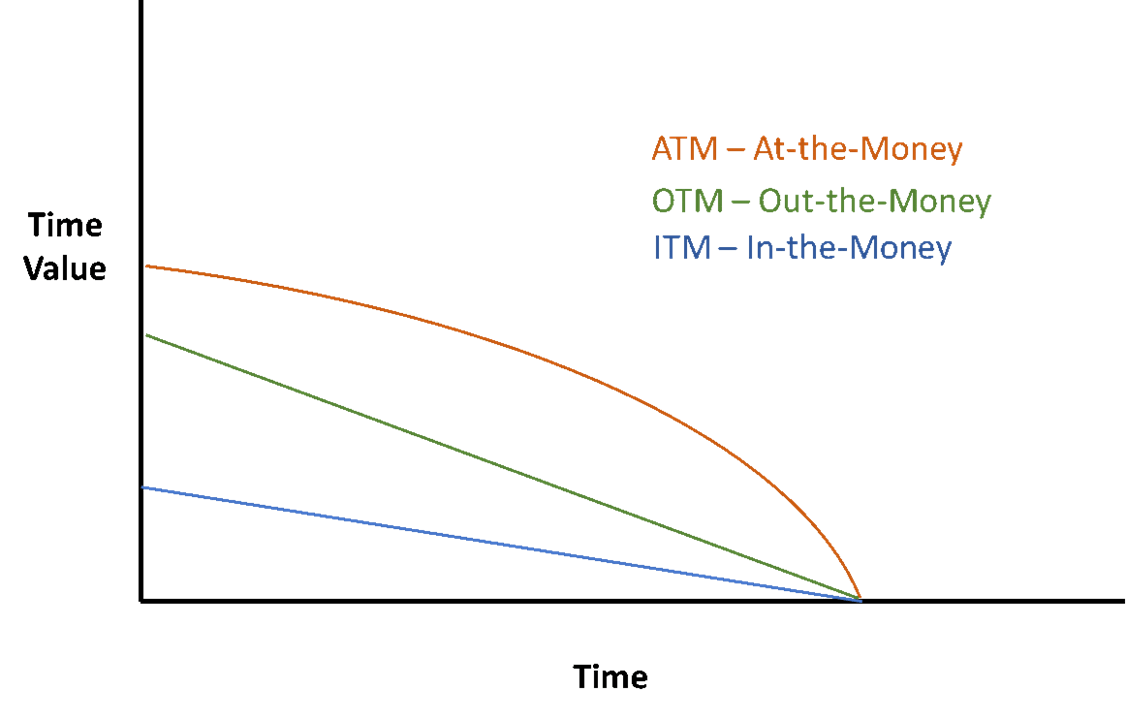
From a pure Theta perspective, it’s categorically better to sell a leveraged ETF than to buy one, because the (loss of) time decay is working in the investor’s favor.
Pros and Cons
Leveraged ETFs are risky instruments.
Therefore, there are certain features one must be aware of, and there are certain rules one would be better off adhering to.
- Leverage (of a benchmark)
Principally, all leveraged ETFs are aiming to amplify the return of a non-leveraged instrument, usually an index. For example:
S&P 500 (SP500)
| Bull version | Bear version | |
| Non-leveraged ETF | SPDR S&P 500 Trust ETF (SPY), iShares Core S&P 500 ETF (IVV), Vanguard S&P 500 ETF (VOO) | ProShares Short S&P 500 ETF (SH), Direxion Daily S&P 500 Bear 1x Shares ETF (SPDN) |
| 2x-leveraged ETF | ProShares Ultra S&P 500 (SSO), Direxion Daily S&P 500 Bull 2X Shares (SPUU) | ProShares UltraShort S&P 500 (SDS) |
| 3x-leveraged ETF |
ProShares UltraPro S&P 500 (UPRO), Direxion Daily S&P 500 Bull 3X Shares (SPXL) |
ProShares UltraPro Short S&P 500 (SPXU), Direxion Daily S&P 500 Bear 3X Shares (SPXS) |
NASDAQ-100 (NDX)
| Bull version | Bear version | |
| Non-leveraged ETF | Invesco QQQ Trust (QQQ) | ProShares Short QQQ ETF (PSQ) |
| 2x-leveraged ETF | ProShares Ultra QQQ (QLD) | ProShares UltraShort QQQ ETF (QID) |
| 3x-leveraged ETF | ProShares UltraPro QQQ (TQQQ) | ProShares UltraPro Short QQQ (SQQQ) |
Semiconductors (Various indices)
| Bull version | Bear version | |
| Non-leveraged ETF | VanEck Semiconductor ETF (SMH), iShares Semiconductor ETF (SOXX), Invesco PHLX Semiconductor ETF (SOXQ) | None (we’re aware of) |
| 2x-leveraged ETF | ProShares Ultra Semiconductors (USD) | ProShares UltraShort Semiconductors ETF (SSG) |
| 3x-leveraged ETF | Direxion Daily Semiconductor 3X Bull Shares ETF (SOXL) | Direxion Daily Semiconductor 3X Bear Shares ETF (SOXS) |
It’s important to remain within one’s comfort zone, and to ensure that the use of a leveraged ETF fits the investor’s profile, needs, and risk aversion.
Looking at the 30-Day Rolling Volatility, you can see that the leverage is amplifying not only the return, but also the volatility. A 3x-leveraged ETF is 3x as volatile as the benchmark it’s looking to copy.
Semis:
Y-Charts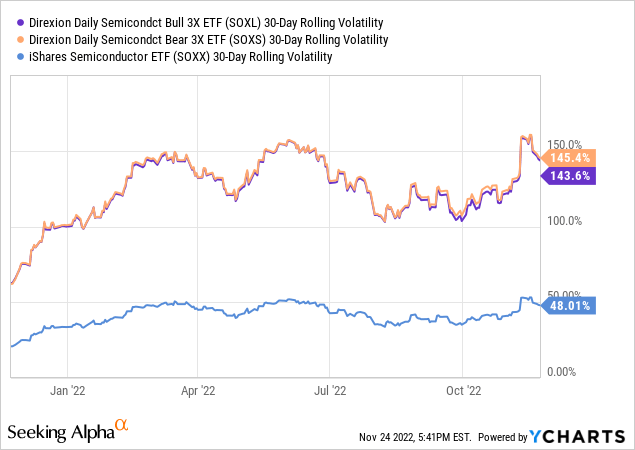
Tech:
Y-Charts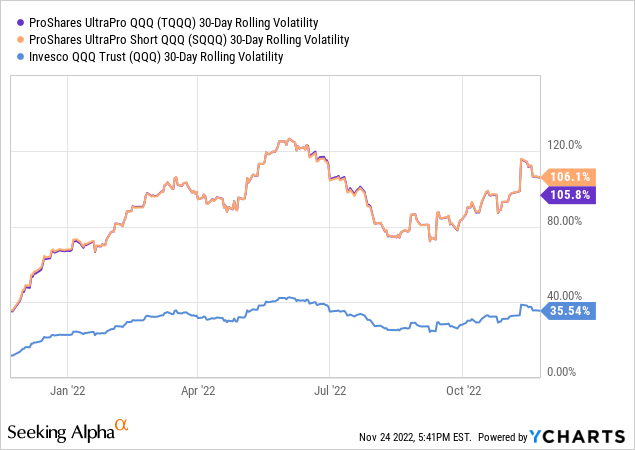
This is one of the features many investors miss or fail to understand.
Leveraged ETFs are trying to mimic the daily performance of a certain benchmark. As such, when you look at the daily (or short-term for that matter) performance – the leveraged ETF is likely to show a very/fairly close return to the leverage it offers (be it a long or a short mechanism). For example:
Semis’ 1-day price change: Daily returns of SOXL and SOXS are about +3x and -3x, respectively, the daily return of SOXX.
Y-Charts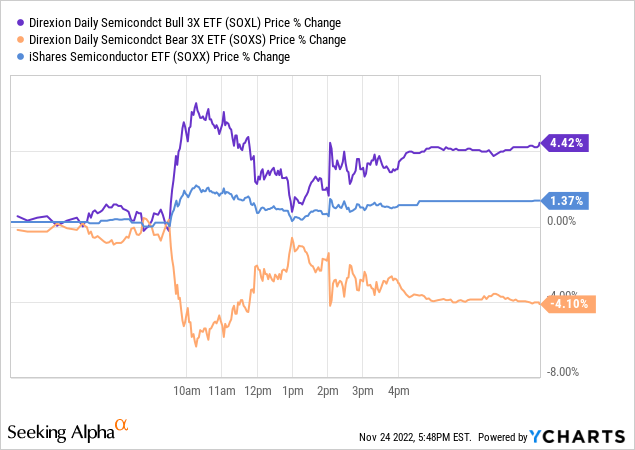
Tech’s 1-day price change: Daily returns of TQQQ and SQQQ are about +3x and -3x, respectively, the daily return of QQQ.
Y-Charts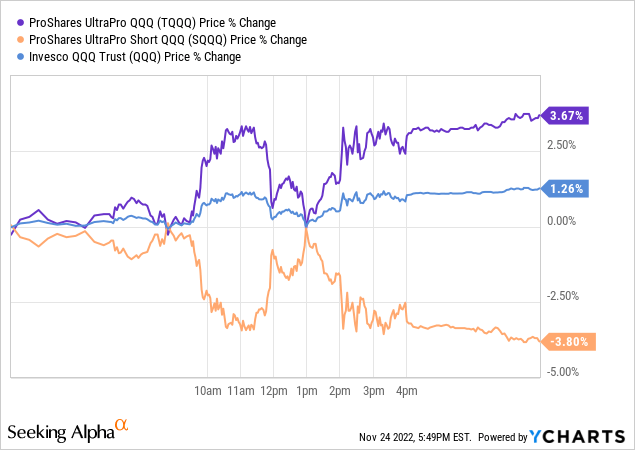
Nonetheless, if we move to a longer period, say 2022, the math isn’t as straight as it’s when we look at the short-term.
Semis’ YTD price change: YTD returns of SOXL and SOXS are about +2.65x and -0.07x, respectively, the YTD return of SOXX.
Y-Charts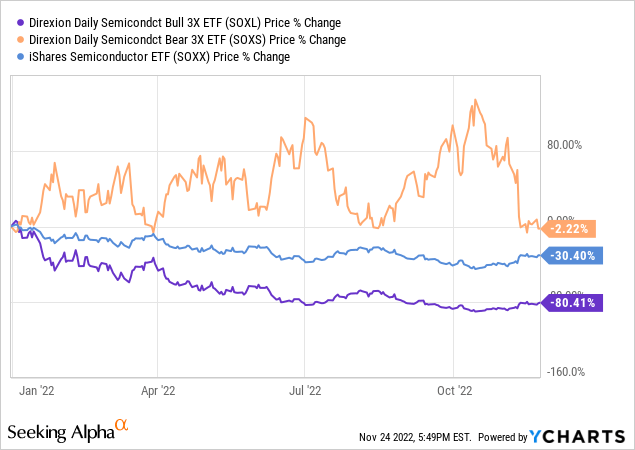
Tech’s YTD price change: YTD returns of TQQQ and SQQQ are about +2.61x and -2.87x [=(52.59+28.13)/-28.13], respectively, the daily return of QQQ.
Y-Charts![Tech's YTD price change: YTD returns of TQQQ and SQQQ are about +2.61x and -2.87x [=(52.59+28.13)/-28.13], respectively, the daily return of QQQ.](https://static.seekingalpha.com/uploads/2022/11/24/50038074-16693303135947628.png)
Over time, and assuming the benchmark/index doesn’t move in a (fairly) straight line – the performance of a leveraged ETF may differ significantly from the performance of the underlying benchmark.
Risk and Reward
- Phenomenal/Horrendous Total Returns
First and foremost, as you may well understand, the main risk is the (quite reasonable) scenario of losing a lot of money, quickly.
Of course, there’s always the flip-side of that coin, and leveraged ETFs may also deliver significant returns (during short periods).
If “Timing is Everything”, generally speaking, it’s even more crucial when it comes to buying leveraged ETFs. One must have a high conviction, a near-perfect timing, a short-term trading view/mentality, and an exit (including stop loss) strategy. [We elaborate on these elements at the end of this article.]
Below you can see the total returns of the leveraged ETFs we focus on during two very different periods.
1) Bear Market: Total Return since Dec. 27, 2021
Semis:
Y-Charts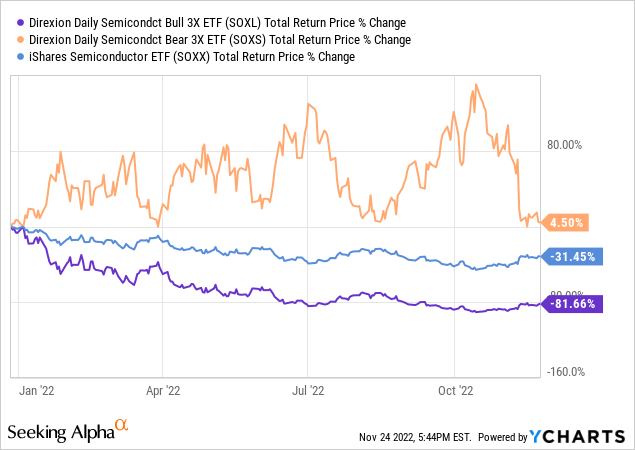
Tech:
Y-Charts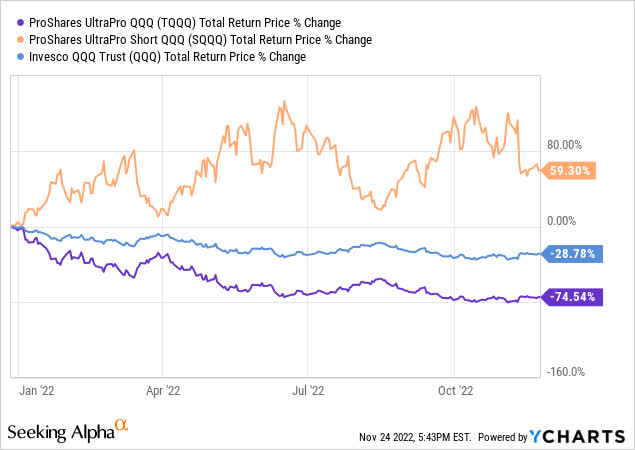
Clearly, there’s a lot of money to be lost (or made) during a bear market with any instrument, let alone 3x-leveraged ETFs. While the benchmarks (SOXX, QQQ) have lost ~30%, the ultra long ETFs (SOXL, TQQQ) have lost over 3/4 of their value, and the ultra short ETFs (SOXS, SQQQ) have actually gained.
Pay attention to the divergence between SOXS (a gain of only 4.5%) and SQQQ (a gain of 59.3%), a result of the recent speedy recovery of Semis (relative to Tech) in recent weeks.
2) Bull Market: Total Return from Mar. 23, 2020 to Dec. 27, 2021
Semis:
Y-Charts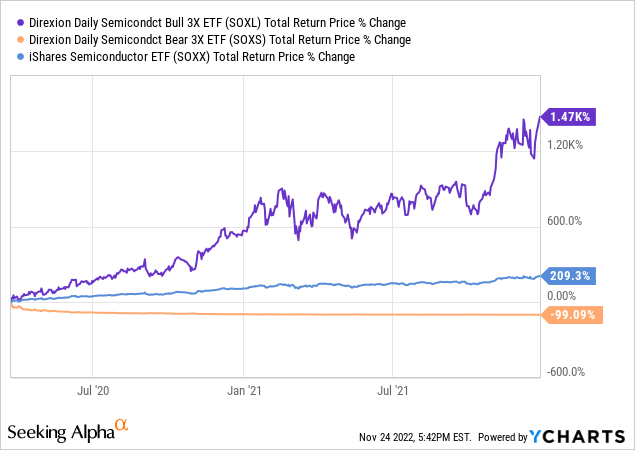
Tech:
Y-Charts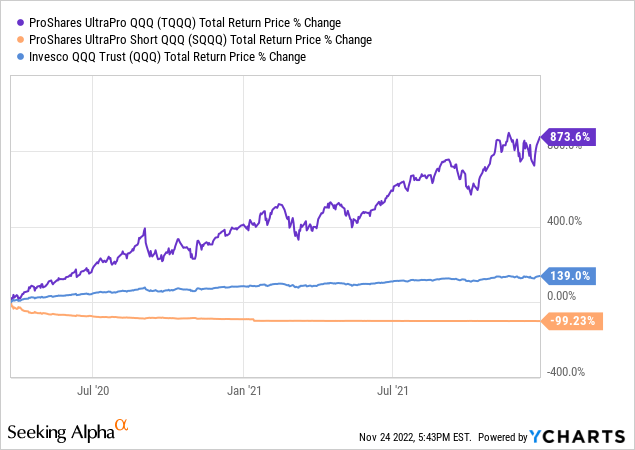
Clearly, there’s a lot of money to be lost (or made) during a bull market with any instrument, let alone 3x-leveraged ETFs. While the benchmarks (SOXX, QQQ) have gained low triple-digit %, the ultra long ETFs (SOXL, TQQQ) have delivered stunning returns. At the same time, the ultra short ETFs (SOXS, SQQQ) have practically vanished, leaving investors with (nearly) nothing out of their initial investments.
- The Longer the Tenure – the Higher the Risk of Losing Big
Secondly, and regardless of the (bull or bear) type of market we’re in and/or the total return over a certain period, leveraged ETFs are guaranteed to lose value over time. Putting it differently, the longer you stick to these instruments – the higher the odds of a significant drawdown.
Below you can see how deep is the decline that leveraged ETFs have (thus may) suffered from (% off-high) over different tenures.
- 3 years: While the long versions (SOXL, TQQQ) have lost 75%-80%, the short versions (SOXS, SQQQ) have lost nearly their entire value.
Y-Charts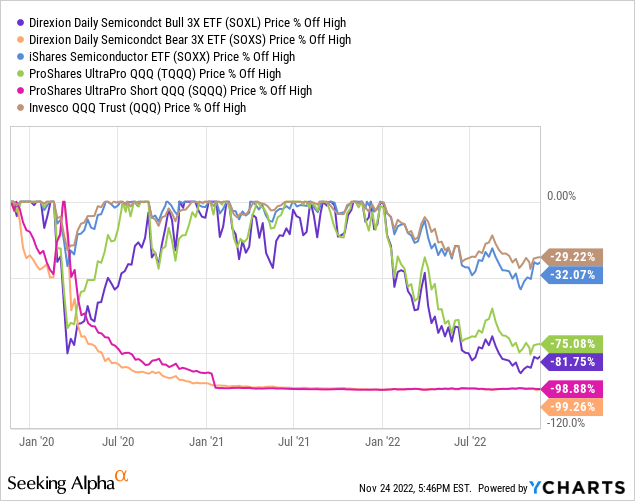
10 years: While the long versions (SOXL, TQQQ) have lost 75%-80%, the short versions (SOXS, SQQQ) have lost nearly their entire value.
Y-Charts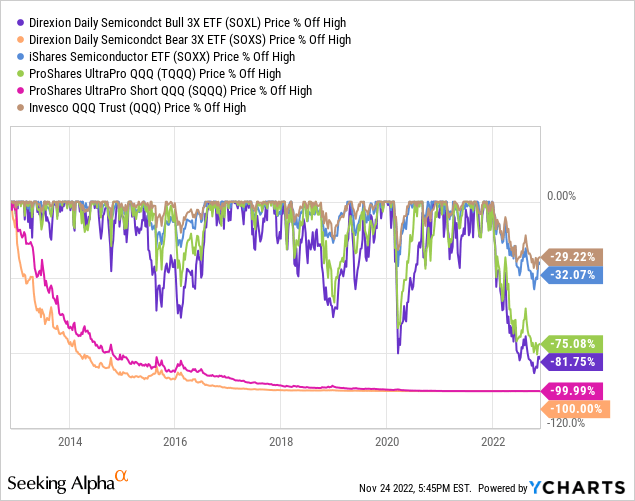
Although the past decade can definitely be described as a bull market (overall), leveraged ETFs have been hammered, no matter whether they were long or short the underlying benchmarks.
This, once again, proves that these instruments can’t be held (long position) over the long run. You can be long, but not for too long.
- “The Road is Long With Many a Winding Turn” [Source]
Finally, it’s important to understand that both time and slope play a major role in determining the return, therefore worthiness, of trading a leveraged ETF.
It’s very unlikely, almost impossible, for your long (short) leveraged ETF position to deliver a return equal to the (inverse) return of the underlying, non-leveraged, benchmark.
To explain this, let’s use the S&P 500 and its +/-1/2/3 leveraged versions.
Naturally, the 2x- (SSO, SDS) and 3x- (SPXL, SPXU) leveraged versions are 2x and 3x as volatile as the non-leveraged versions (SPY, SH).
Y-Charts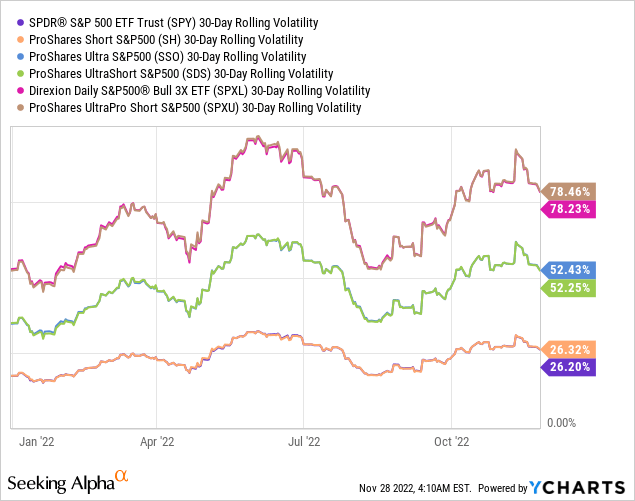
But does the extra volatility usually/automatically translate into higher returns? Not necessarily.
YTD: While the returns of the long versions (SPY, SSO, SPXL) make sense (from a leverage/volatility perspective), those of the short versions (SH, SDS, SPXS) don’t.
As a matter of fact, the 2x-leveraged SDS and the 3x-leveraged SPXS have delivered nearly the same total returns. If so, why would one pick the more risky SPXS over the less risky SDS!?
Y-Charts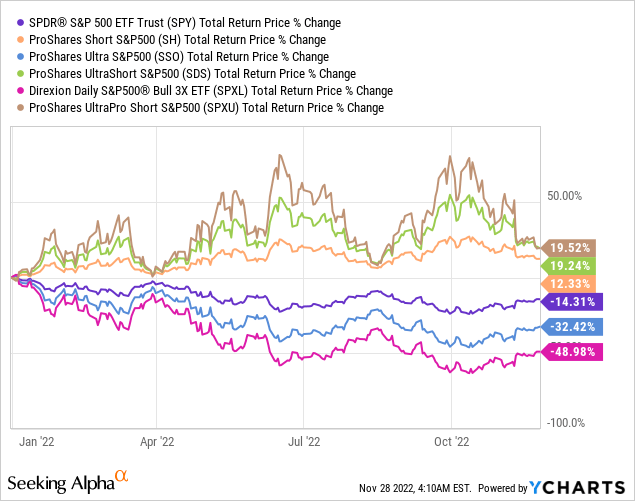
3-Year: The 2x-leveraged SSO has returned twice as much as the 3x-leveraged SPXL. Moreover, the non-leveraged SPY is only ~4.4% short of SSO’s total return.
In both cases, the extra risk (volatility) hasn’t resulted in a better performance; quite the contrary.
Y-Charts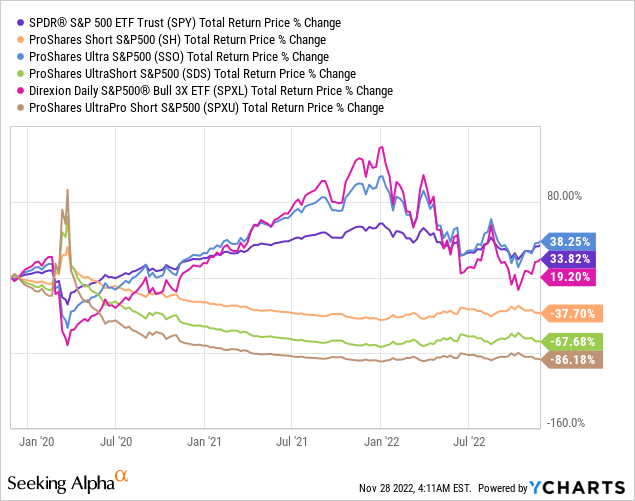
5-Year: Once again, the 2x-leveraged SSO has returned more than the 3x-leveraged SPXL. Moreover, the 2x-leveraged SDS hasn’t performed a lot better than the 3x-leveraged SPXS.
Y-Charts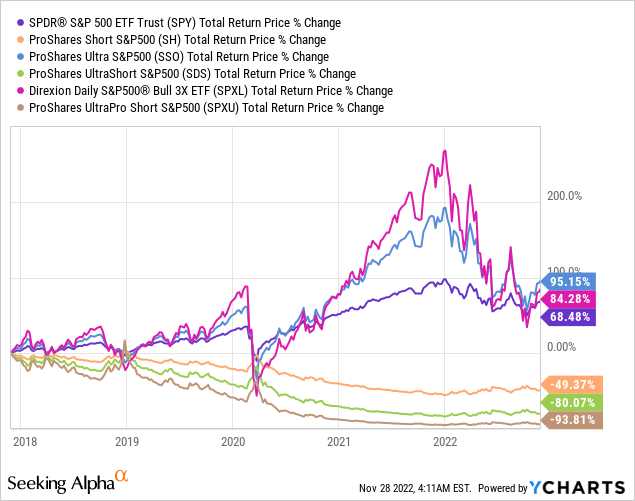
10-Year: The short ETFs, whether leveraged or not, got battered. The long ETFs, however, are looking as good as how you wish a leveraged ETF (that you buy) to be.
SPXL and SSO have returned more than 4x and ~2.5x, respectively, what SPY has.
Y-Charts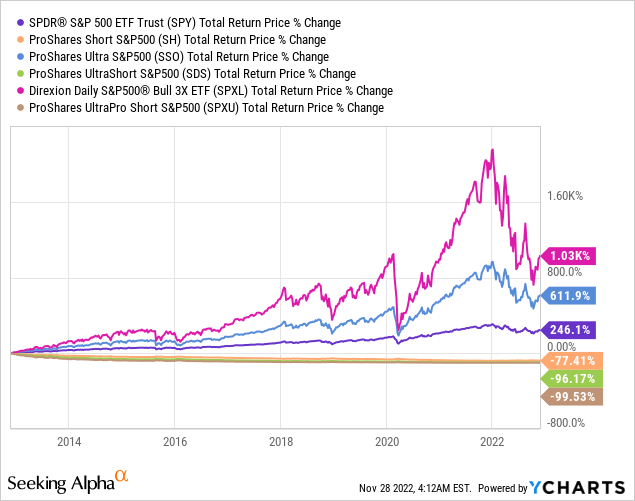
Macro Trading Factory – Trading Alerts
Here is some of the information that we posted when we issued the most recent trading alerts (“TAs”) to our subscribers.
We are happy to share this information here, as we believe it’s relevant and allows for a better understanding of the topic.
TA dated Nov. 14, 2022:
These TAs were discussed and explained in the piece that we’ve published Nov. 14.
The main message: With the SPX reaching the 4000 mark, we wish to employ some anti-tech/growth hedging again, and by doing so we’re (once again) reducing our net long exposure (back to the low 60s% area).
Recall that there are two pairs we’re referring to:
- Direxion Daily Semiconductor 3X Bull Shares ETF (SOXL) vs. Direxion Daily Semiconductor 3X Bear Shares ETF (SOXS) >>> We’re shorting SOXL, but one may buy SOXS for a similar (though not equivalent) effect.
- ProShares UltraPro QQQ (TQQQ) vs ProShares UltraPro Short QQQ (SQQQ) >>> We’re shorting TQQQ, but one may buy SQQQ for a similar (though not equivalent) effect.
Key points to keep in mind:
Total Assets Under Management:
The 3x-bullish ETFs (SOXL, TQQQ) are attracting a lot more money than their 3x-bearish counterparts (SOXS, SQQQ).
Having said that, last week no less than $658M was funneled into SQQQ. Per Bloomberg, that’s the largest-ever inflow for a product that aims to deliver 3x the opposite performance of the US benchmark for major technology companies.
Y-Charts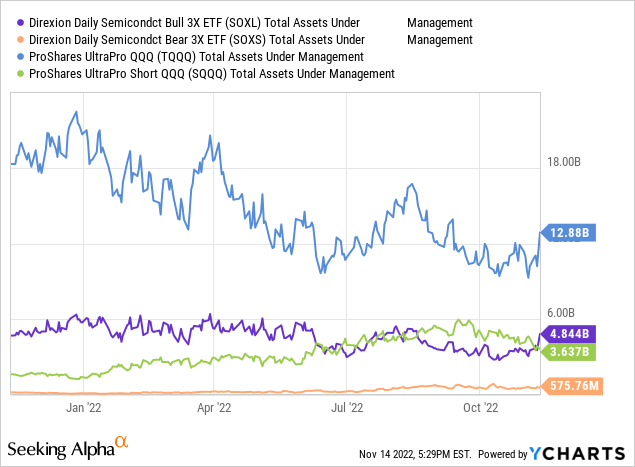
When looking at the Daily Price Change the movements are fairly close in absolute terms, i.e. SOXL is moving like SOXS and TQQQ is moving like SQQQ.
Y-Charts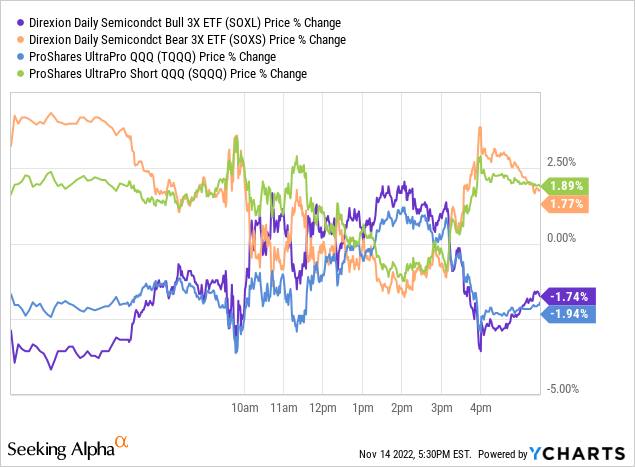
Nevertheless, things are changing over time.
- The longer the period – the greater the (potential) divergence.
- It’s not guaranteed, but shorting the 3x-bullish ETFs is likely to deliver a better return than buying the 3x-bearish ETFs.
Y-Charts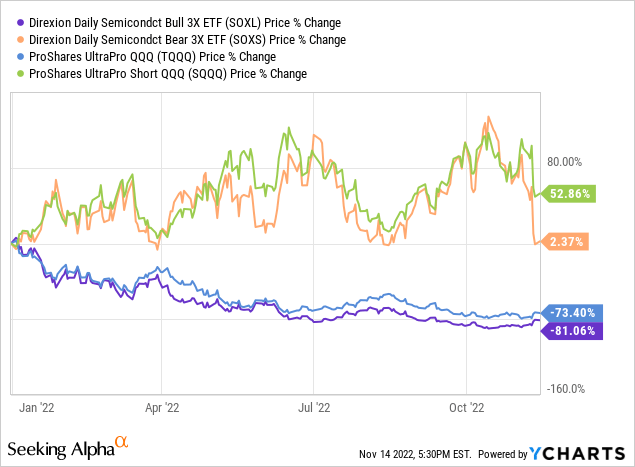
TA dated Nov. 15, 2022:
Nothing to add to what we wrote Nov. 14, but still – we would like to show you how even the technical analysis supports the fundamentals and risk aversion mode we see ahead.
Recall that it’s not advisable to do technical analysis using leveraged instruments. Leverage is just a “wrapper” not the base “package” which is the non-leveraged instrument.
Having that in mind, here are the two, relevant, non-leveraged instruments on which we conduct some technical analysis. [Note that they’re very similar in terms of nature and the message they deliver.]
SOXX is currently hitting (or just about to hit) three resistance levels:
- 200-DMA
- Long-term down-trending red line
- Short-term (horizontal) green line
Y-Charts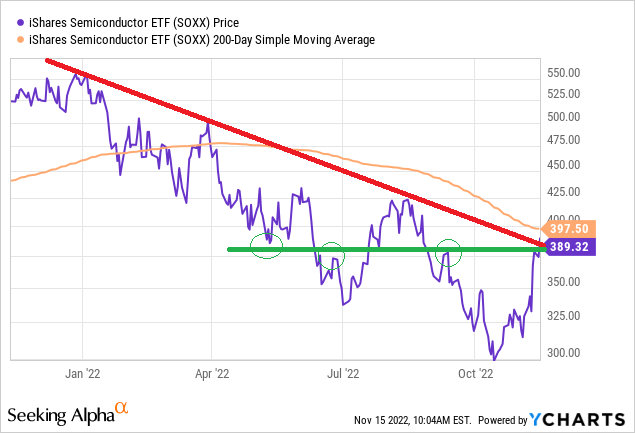
QQQ is coming close to hit three resistance levels:
- 200-DMA
- Long-term down-trending red line
- Short-term (horizontal) green line
Y-Charts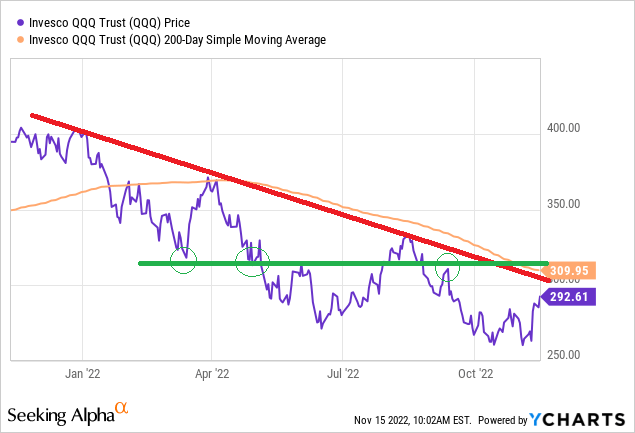
Epilogue
A leveraged ETF can be your best friend when you get the direction and timing right, but it can be your worst nightmare when you get the direction and timing wrong.
We hope that through this article, we’ve managed to assist you with better understanding the Dr. Jekyll (‘Home Run’) and Mr. Hyde (‘Loaded Gun’) natures (characteristics) of these instruments.
As we mentioned above, when buying a leveraged ETF, it’s very important to keep the pros and cons, risk and reward, in mind but it’s not enough. In addition to all these attributes, one musts also have the following:
1) High Conviction: Buying a leveraged ETF requires a higher-than-usual conviction, in line with the significantly higher volatility. “Feeling good” about the upside potential of an investing idea isn’t enough and an in-depth analysis regarding the downside risk is key.
If we believe the downside risk of the underlying (non-leveraged) to be significant (usually 20%), we’re less likely to move in, even if the upside is way more significant.
Unlike a non-leveraged security that we may buy (if the risk/reward is very attractive) even if the downside risk is significant, when it comes to a leveraged ETF downside risk rules (overcoming the risk/reward profile, no matter how attractive the latter is).
2) Near-perfect timing: It’s very hard to find the “right moment”, surely the “perfect timing”. The latter is based on pure luck and only retrospectively we are in position to know whether our timing was good or not.
Therefore, when we say “near perfect timing” we actually refer to maximum hesitation and patience. Take your time, don’t rush, and let the stabilization, consolidation, and/or capitulation periods show their pretty, and more important: less risky, face.
In line with that, it’s strongly advisable to build a position involving a leveraged ETF over time. Indeed, it’s likely going to be a relatively short time, in order to match the “hit the iron while it’s hot” concept. Still, it’s better to ‘hit’ a leveraged ‘iron’ several times rather than only once or twice.
3) Short-term trading view/mentality: We believe that investors mustn’t “get married” with any position, surely not with a leveraged ETF.
Any position has a (stretched) valuation where it warrants a sale, and when it comes to leveraged ETFs – quick “love affairs” is the name of the game.
Leveraged ETFs aren’t the type of instrument you wish to get older with. They are only suitable for certain times and there’s no reason to extend their hospitality for too long.
Best is to pre-set levels and targets, and once those get fulfilled – kiss the leveraged ETF goodbye. No hard feelings, and no need to shed tears.
4) An exit (including stop loss) strategy:
Not every encounter we have in life results in a pleasant experience. Some encounters are very enjoyable/profitable, some less, and a few may suck big time.
The idea is to minimize the latter type and to avoid stretching the former type.
If it works out quickly – say goodbye quickly.
If you still wish to examine the relationship – let it be, as long as the examining period doesn’t come at the expense of other, possibly better, encounters.
But if it looks as if there’s no future here – there’s really no reason to stick around. Cut your losses and move on.
Obviously, easier said (or written) than done, but here’s an example of all the trades we suggested involving SOXL, one of the leveraged ETF we were active with this year on both LONG and SHORT fronts.
Y-Charts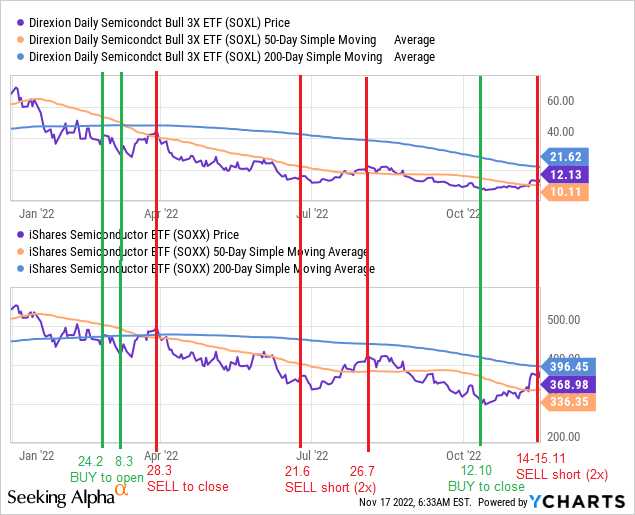
I don’t think we had perfect timing, but we did have pretty good timing.
More importantly, we had a high conviction [Note: different times = different directions!], we surely had/have a short-term trading view/mentality, and we certainly didn’t/don’t fall in love with the position – be it a LONG or a SHORT one.
Last but not least, keep in mind that we use leveraged ETFs as part of our HEDGING strategy, which means that there are LONG positions (we wish to protect) against the SHORT positions (if and when we open such positions).
This isn’t something we suggest the average investor do without having the necessary ingredients (knowledge, experience, guts/risk aversion) and tools (risk analysis, portfolio management, modeling) to support such an activity.
Be the first to comment