

NicoElNino
The market is going through a period of extraordinary uncertainty. Though we believe that no one can predict how the market is going to behave in the next week or next six months, there are enough dark clouds out there indicating a possibility of an incoming storm.
Inflation is at a 40-year high and shows no signs of slowing down, at least yet. A war is raging in Europe that appears to drag on for longer than anyone expected and could have unpredictable outcomes. The Fed is raising interest rates at lightning speed and withdrawing liquidity from the financial system. The 30-year mortgage rates have shot up from 3% to over 7%, causing the housing market to stop in its tracks. It could be argued that interest rates are still low from a historical perspective, but we have to keep in mind the speed at which they are going up and the amount of leverage (debt burden) that the government and the corporate sector have compared to previous such instances. At the same time, the Fed has embarked upon monetary tightening, squeezing the liquidity out of the system. There are likely two outcomes. Either the Fed’s actions will push the economy into a recession (possibly a severe one), which will obviously bring the inflation down, or something important enough in the system breaks, which will then cause the Fed to reverse its course. There is, of course, a third but very remote possibility of a so-called soft landing that the Fed is able to bring down inflation with a minor or no recession. However, the last outcome looks less and less likely.
In good times, a vast majority of investors (many of them in their 401Ks) invest in broad market indexes. With broad indexes, you invest in good, average as well as bad companies. Sure, if your time horizon is very long and you are investing at regular intervals, this strategy turns out to be okay. The problem with market indexes is that there is no escape from a roller-coaster ride with the extreme ups and downs of the market, and most people do not have tolerance for deep drawdowns and, many times, resort to panic selling exactly at the wrong time. Moreover, this strategy may not suit or work very well for retirees and investors in their 50s or older.
On the other hand, income investors, including retirees who live off that income, have an additional problem. Since they need to withdraw income on a regular basis, they may be forced to sell when the prices are low. Even if they do not withdraw income, more than likely, they are not adding any fresh money to take advantage of lower prices, as and when that happens. Retirees can also face the problem of sequential risk if the market happens to go into a deep correction for multiple years in the early phase of retirement, as it did during the period 2000-2003.
The other model that is often referred conservative and safe for retirees is the 60:40 stock and bond allocation model. However, we find two problems with that model. The year 2022 has shown that, at times, bonds can go down along with stocks, and then there is no escape from the deep drawdowns that can take years to come back even. The other problem that is often overlooked is that it compromises growth on 40% of your assets.
This is why we wanted to work on a strategy that could counter some of these thorny issues, and that’s how the NPP strategy evolved.
The NPP strategy described in this article should be of interest to any long-term investor, but especially to the following audiences:
- Income and conservative investors who don’t like the roller-coaster ride of the stock market and rather sleep relatively well even during the depth of a correction.
- Retirees or near-retirees who may want to avoid the sequential risk of the stock market.
- Folks who are already 50-plus or approaching 50 and would prefer a strategy that would offer lower volatility while maintaining higher returns in the long term.
- Investors who want to take control of their investments and are prepared to spend at least a few hours a month managing their portfolios.
That said, everyone’s situation is different, and one size does not fit all, so it is always a good idea to analyze any new strategy and see if it would suit your specific goals, needs, and temperament.
We started to write about this portfolio strategy that we like to call NPP (Near-Perfect Portfolio) strategy in early 2020. Since nothing is perfect, especially so in the investment world, hence the name Near-Perfect Portfolio. In fact, it is even hard to find anything that is even near-perfect, so we agree the name may still feel over the top. Generally, we’re looking for a strategy that performs reasonably well during the bull markets, preserves capital when the market throws a fit or performs poorly, and provides a decent enough income stream on a consistent basis. This is the basis of the Near-Perfect Portfolio.
We follow the NPP strategy in our Marketplace service, “High-Income DIY Portfolios,” but from time to time, we like to provide updates and the progress of the NPP portfolio here on the SA public platform for the benefit of our regular readers. As usual, we will provide an overview of the performance and a broad comparison of our NPP strategy vis-à-vis the S&P 500 (based on back-tested data as well as our live performance since January 2020). In the end, we will provide a sample NPP 3-bucket portfolio.
Why Do We Need a Strategy like NPP?
Here are some of the likely reasons:
- It is almost impossible to predict the market correctly, so we would want a strategy that works fairly well in most environments.
- We want a strategy that can avoid (to a large extent) the roller coaster ride of the stock market and index investing.
- The S&P 500 had an extraordinary streak of high performance during the past 13 years (prior to 2022), and it is unlikely to continue in the next decade. We want a strategy that could adjust to such a scenario.
- If you are a retiree or near-retiree or otherwise a conservative investor, you cannot afford large or deep drawdowns in your portfolios, as that may require years to come back even. Also, fresh retirees would like to avoid the risk of “sequence of returns” at all costs.
- The S&P 500 provides a lowly 1.68% yield even today (after a 22% correction), so index investing would not be an ideal option for most income investors. We want a strategy that could provide a respectable 5% income when needed.
- We want a strategy that produces low volatility (ideally less than 60% of S&P 500) preserves capital, provides a decent income, and reasonable total returns over the long term.
So, in brief, we think a conservative investor or a retiree would want low volatility, minimal drawdowns, consistent income, and decent growth on the overall value of the portfolio to meet inflation and support 30-40 years of retirement. This is exactly the objective of the NPP strategy that you would see in a comparative analysis of the NPP strategy and the broader market index like the S&P 500 in the next section.
What’s a Near-Perfect Portfolio?
To summarize, we expect our Near-Perfect Portfolio to achieve these three objectives:
- Preserve capital by limiting the drawdowns to less than 20%.
- Provide a consistent income of roughly 5% to those who need to withdraw.
- Grow the capital for the long term at an annualized rate of 10% or better (including the income).
We must caution that these strategies need some work on an ongoing basis and may not suit highly passive investors. In addition, they require patience.
NPP: A Combination of Divergent Strategies:
The importance of the need to diversify cannot be overstated, especially for older and conservative investors. We are currently in an environment that is testing the limits even for the most diversified portfolios. So, the question is how to diversify and how much to invest in various types of assets or strategies. First, we need to diversify our stock holdings among different sectors or industry segments of the economy. The stock market is inherently volatile, so we also have to structure our portfolio in such a way that we can avoid high volatility. High volatility and deep drawdowns bring in all kinds of emotions and issues, including selling at the wrong time, fear of missing out, and above all, overall low performance. So, for additional protection, we recommend diversifying in terms of types of investment strategies. We try to combine strategies that are likely to perform in divergent ways under different market conditions. This helps bring down the portfolio volatility and improve overall performance. The NPP portfolio combines monthly rotational strategies with some buy-and-hold DGI (dividend growth investing) and high-income strategies to perform well in different market conditions.
Performance Behavior of NPP Strategy During Bull & Bear Markets
We think it may be beneficial to readers, especially those who are new to this approach, to discuss the past performance and behavior of our rotational and buy-and-hold portfolios under different market conditions since the year 2008. Moreover, this will demonstrate how rotational portfolios can act as a counterbalance to buy-and-hold portfolios during tougher times. We run and manage many such rotational portfolios and several buy-and-hold portfolios inside our Marketplace service.
Note: All the tables and charts included in this article are sourced from Author’s work unless specified otherwise underneath the image. The stock market data, wherever used, is sourced from public websites like Yahoo Finance, Google Finance, Morningstar, etc.
Importance of Knowing Your Tolerance for Drawdowns:
Everyone’s situational and emotional makeup is different, so it is important to know your tolerance for drawdowns and deep corrections. During the good times (bull runs), it is natural that most folks do not think much about drawdowns. However, it is of paramount importance to know your risk tolerance and have an idea about how much of a drawdown would be tolerable. For retirees and near-retirees, in addition to the level of tolerance to drawdowns, there is always the inherent risk of negative sequential returns during the early years of retirement. Broad market indexes like S&P 500 had a drawdown (loss from top to bottom) of over 45%, 50%, and 30%, respectively, during the dotcom crash (2000-2002), financial crisis (2008-2009), and Covid-19 crash (Jan-March 2020). So, it may not be very frequent, but it does happen at least a couple of times in a decade. Sometimes a downturn can end quickly, as we experienced during the Covid-19 crash, but at other times it can be long, slow, and painful, for example, like what we witnessed from 2000-2002.
So, let’s compare the drawdown performance of our NPP portfolio and the S&P 500 during some of the worst times during the last 15 years (based on back-testing). We are not in a position to go beyond 2008 due to a lack of reliable data, but at least it would cover the financial crisis and a few other deep correction periods.
List of drawdown timeframes:
- Jan-2008 to Mar-2009 (Financial and Housing crash)
- Oct-2018 to Dec-2018 (Crash of 2018)
- Jan-2020 to Mar-2020 (Pandemic crash)
- Jan-2022 to Oct 17, 2022 (the current period)
Table-1:
Author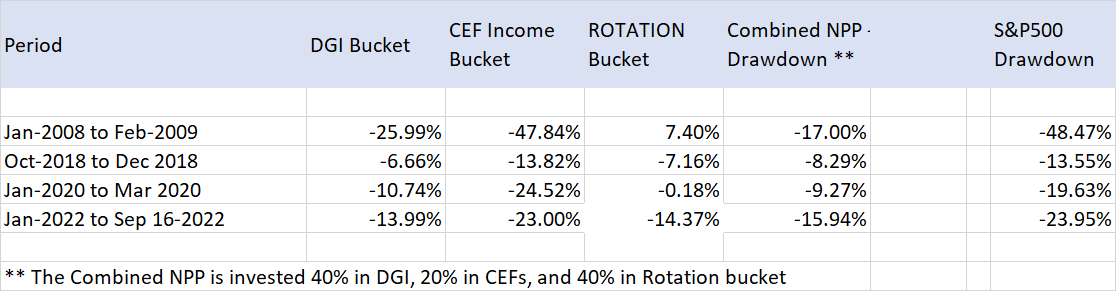
As you can see above, the drawdown of the NPP portfolio was less than half of the S&P 500 most times. During the current downturn, it is about 66% of the S&P 500. However, the current downturn is still in progress, so it will be premature to draw any conclusions.
Combined Portfolio [NPP] Performance:
Below is the combined NPP portfolio performance (based on back-testing results since 2008). We will then provide more details on the three components of the NPP portfolio.
Table-2:
|
As of 17-Oct-2022 |
CAGR** |
|
CAGR of DGI bucket since 2008: |
13.0% |
|
CAGR of CEF-High-Income bucket since 2008: |
9.53% |
|
CAGR of ROTATION bucket since 2008: |
14.66% |
|
CAGR of Combined NPP portfolio since 2008: |
13.39% |
|
CAGR of S&P 500 since 2008: |
8.46% |
** CAGR – Compound Annual Growth Rate
Chart-1: The Combined NPP portfolio vs. S&P 500 (from Jan 2008 to 17-Oct-2022)
Author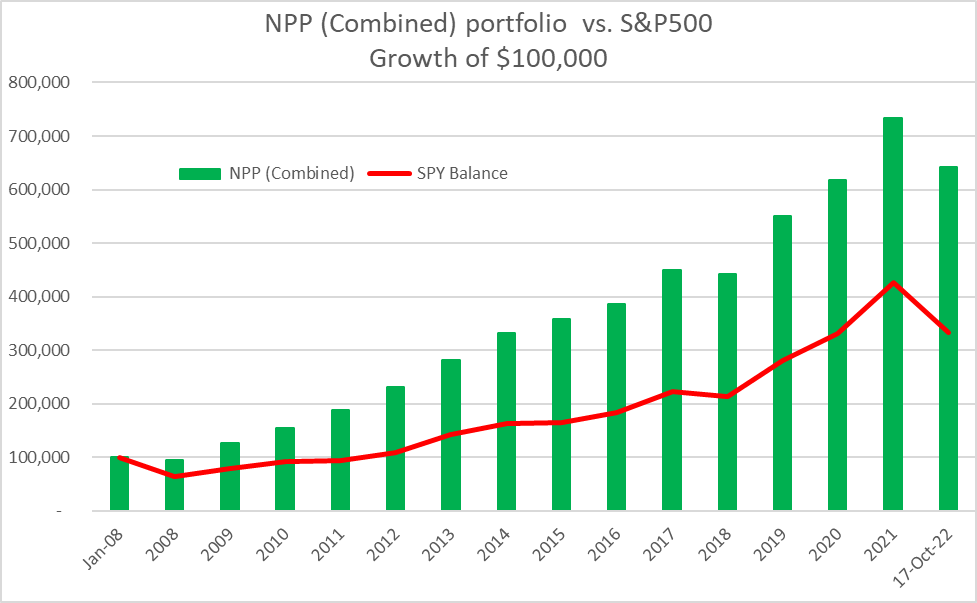
Chart-1A: The Combined NPP portfolio vs. S&P 500 ( with 6% Income Withdrawals)
Now, the below chart is the same as above but with a 6% withdrawal (inflation-adjusted) each year from the portfolio. It is amazing to see how the S&P 500 could never really recover from its drawdown in 2008 due to annual withdrawals, in spite of an extraordinary bull run between 2010 and 2021. However, the NPP portfolio did pretty well during the same circumstances.
Author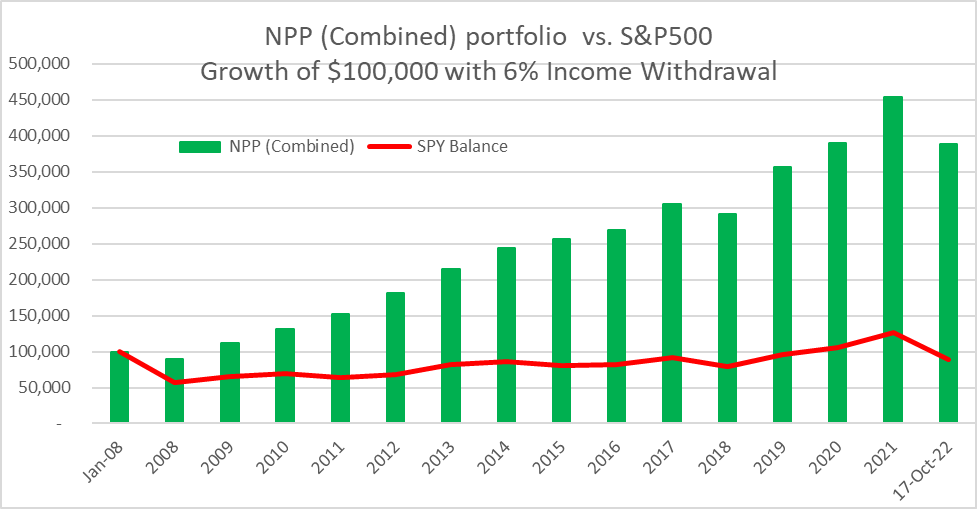
Below is the chart from the “live performance” of the NPP Portfolio since Jan. 2020. (Since this comes from our Marketplace service, it takes into account 6 Rotational portfolios and 3 Buy-and-hold portfolios). In practice, an investor would just need two buy-and-hold buckets and one (or maybe two) rotational buckets. In the chart below, you will notice that at the market bottom in March 2020, S&P 500 and Dow Jones were down nearly 30% and 35%, respectively; however, NPP was down only about 15%. During the current downturn, as of 17-Oct-2022, the S&P 500 is down -21.9% (year-to-date), while the 3-bucket NPP is down -12.39%.
Chart-1B:
Author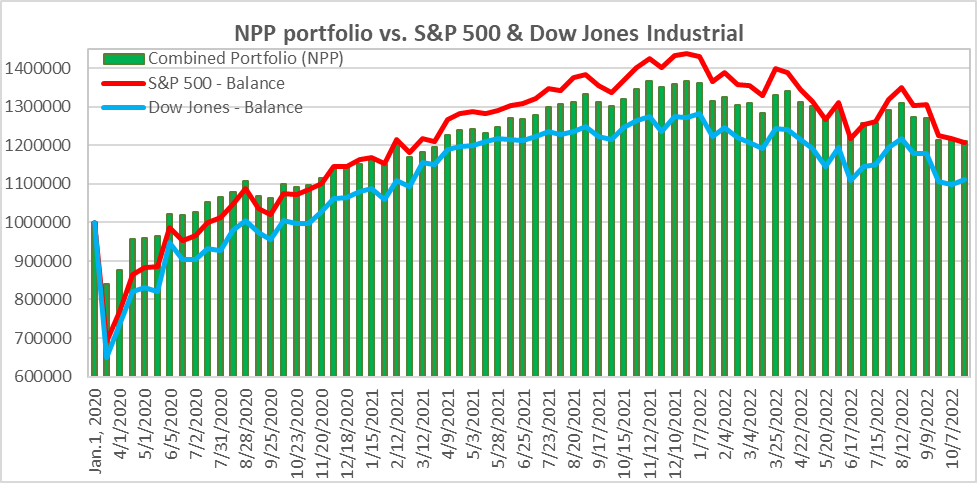
3-Bucket NPP Portfolio (An Example Portfolio)
In this section, we will provide an overview of each of the three buckets and their individual performances vis-à-vis the S&P 500.
Bucket 1: DGI Bucket (40% of the assets)
Bucket 2: Rotational Bucket (40 – 45% of the asset)
Bucket 3: CEF High-Income Bucket (15 – 20% of the assets).
Bucket-1: DGI-Core
We believe that a diversified DGI (dividend growth investing) portfolio should form the foundation of any strategy. A DGI portfolio should hold roughly 15-25 individual stocks, though it can vary to some extent. In this article, we will focus on individual DGI stocks; however, more passive investors could make this portfolio entirely of some select dividend ETFs (exchange-traded funds). For our sample portfolio presented below, we will look for companies that are large-cap, relatively safe, and have solid dividend records. Most of them will likely provide a high level of resistance to downward pressure in an outright panic situation. We will present 15 such stocks based on our past research, current dividend payouts, and a high level of dividend safety. There are many more equally good companies out there, and readers could add/replace them as per their own research and preference, but dividend safety and sustainability should be the main focus.
The goals of the DGI Bucket are:
- Long-term investments 3%-4% dividend income
- Long-term total return in line with the broader market
- Drawdowns to be about 70% (or less) of the broader market
This is our long-term buy-and-hold bucket. It will be our core investments in solid, blue-chip dividend stocks. It’s relatively easy to structure and form this bucket. However, we must put emphasis on diversifying among various sectors and industry segments of the economy. A selection of roughly 15-25 stocks could provide more than enough diversification.
For this part of the portfolio, our focus is to select stocks that tend to do well in both good times and during recessions/corrections. This is especially important if you are a retiree. Please note that this is just a list for demonstration purposes, and there can be many other stocks that could be equally qualified.
Stocks selected:
AbbVie Inc. (ABBV), Amgen (AMGN), Clorox (CLX), Digital Realty (DLR), Enbridge (ENB), Fastenal (FAST), Home Depot (HD), Johnson & Johnson (JNJ), Kimberly-Clark (KMB), Lockheed Martin (LMT), McDonald’s (MCD), Altria (MO), NextEra Energy (NEE), Texas Instruments (TXN), and Verizon (VZ).
Table-3:
Author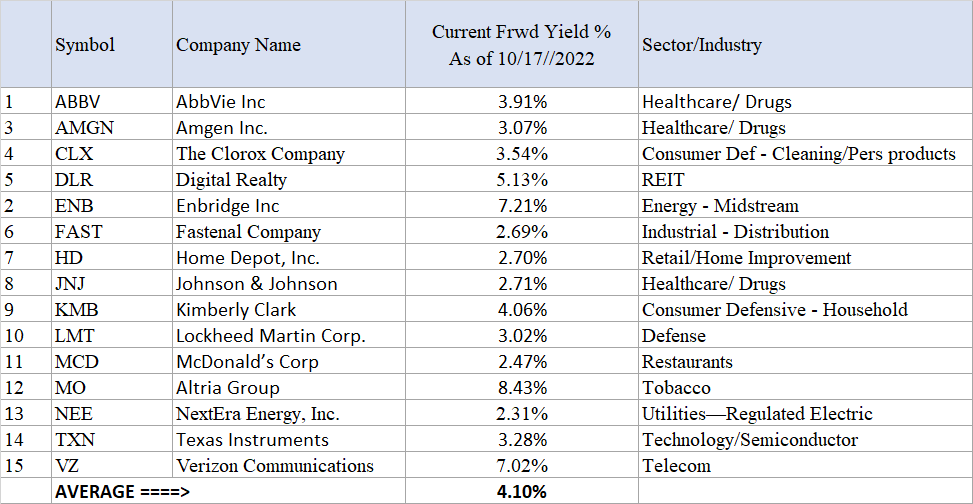
The average yield from this group of 15 stocks is quite attractive at 4.10% compared to 1.65% from S&P 500. If you still have some years before retirement, reinvesting the dividends for a few years would take the yield on cost up to 5% easily.
Chart-3:
Author
Note: For performance analysis, ABBV was replaced with its parent co. ABT, prior to the year 2013 (prior to spinoff).
Bucket-2: Rotational Bucket
This is our insurance bucket (or hedging bucket), which should preserve our capital in times of crisis or panic. In addition, it would reduce volatility, provide a very decent return, and some of them could provide a good income as well.
Along with the DGI portfolio, this bucket is an essential part of our overall portfolio. Investment in stocks is inherently risky, and the Rotational strategies provide the necessary hedge against the risk. They bring the overall volatility of the portfolio down and limit the drawdowns in a panic or a major correction scenario. The biggest advantage is that they let the investor sleep well at night. They bring a level of assurance that helps the investor to maintain calm and stay invested in good times and bad.
Just like most things in life, these strategies can have some downsides as well. First, these strategies require some regular work on a monthly basis. Also, they are most suitable inside a tax-deferred account as they require monthly trading. Many times, the market can have frequent whipsaws (change in direction) in an overall stagnant market, which may cause the Rotation strategy to give negative returns even though the market may be flat.
One can start with one rotation strategy, but as one gains more experience and confidence, one could diversify into multiple strategies. We provide eight such strategies in our Marketplace service, but for most folks, two (or a maximum of three) such strategies should be more than enough.
Note: A word of caution for new investors – just because we’re allocating 40% of the portfolio to this strategy, we are not recommending that you change to this strategy overnight with large sums of money. Rather, it should be done gradually over time in smaller steps, and one should preferably use more than one such strategy.
A Rotation Strategy for the Bull as well as Bear markets:
In the Rotational bucket, we normally rotate between a fixed set of securities on a periodic basis (usually a month), based on the relative performance of each security during the previous period of defined length.
This portfolio is designed in such a way that it aims to preserve capital with minimal drawdowns during corrections and panic situations while providing excellent returns during bull periods. Due to much lower volatility, this portfolio is likely to outperform the S&P 500 over long periods of time. However, it may underperform to some extent during the bull runs.
The strategy is based on seven diverse securities but will hold any two of them at any given time, based on relative positive momentum over the previous three months. Basically, we will select the two top-performing funds. The rotation will be on a monthly basis. The seven securities are:
- Vanguard High Dividend Yield ETF (VYM)
- Vanguard Dividend Appreciation ETF (VIG)
- iShares MSCI EAFE Value ETF (EFV)
- iShares MSCI EAFE Growth ETF (EFG)
- Cohen & Steers Quality Income Realty Fund (RQI)
- iShares 20+ Year Treasury Bond ETF (TLT)
- iShares 1-3 Year Treasury Bond ETF (SHY)
- ProShares Short 20+ Year Treasury Bond ETF (TBF)
Chart-4:
Author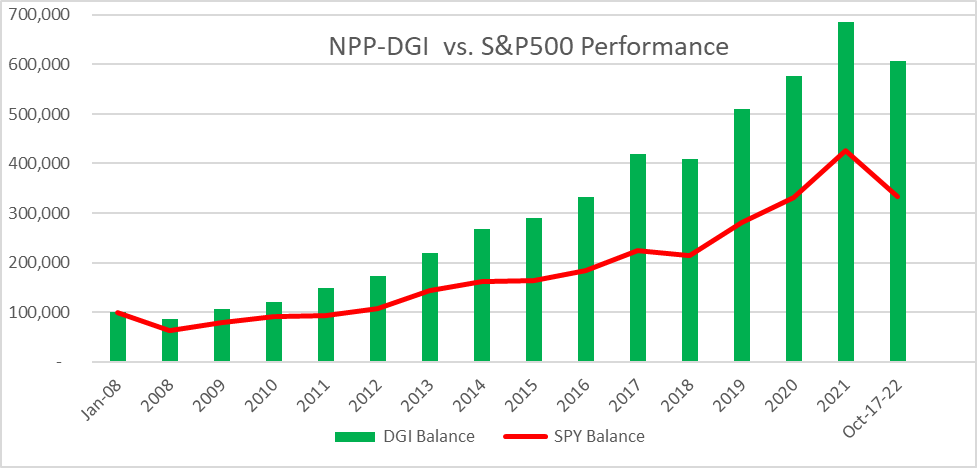
Aggressive version of the above Rotational Model:
In this model, we will try to make it more aggressive but more adaptable to handle bear markets.
In the list of securities, we will add two more securities:
ProShares Ultra QQQ (QLD) ProShares UltraShort S&P500 (SDS)
The rest of the model remains the same. The backtesting model is presented below from Jan. 2010 to Oct 18, 2022.
Chart 4B:
Author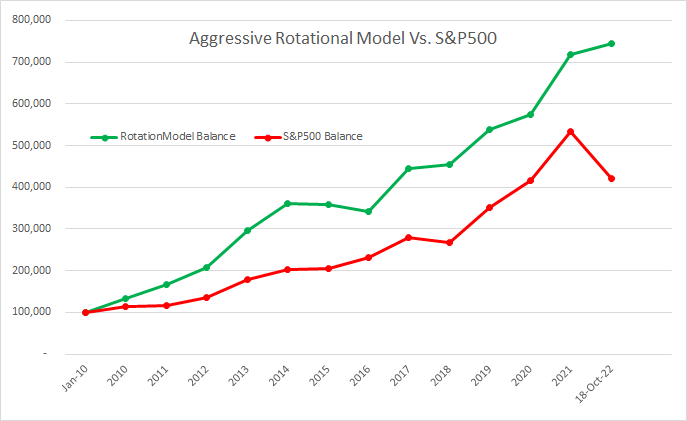
Bucket-3: CEF High Income Bucket
Anything high yield tends to be high risk, right? Well, it is not entirely true, as long as we choose the right kind of securities and in limited proportions. Earning a high enough income while preserving the capital and getting a decent total return has been a challenge for much of the last decade. That’s where CEFs (Closed-End Funds) and this high-income bucket fit in. However, we recommend that they are part of a broader overall portfolio with limited exposure. The purpose is to boost the overall yield of the broader portfolio to over 5%.
Investors should recognize that this is a relatively high-risk bucket. Some of these securities use leverage to generate high income. Leverage works both ways, and in times of panic or recessions, these securities tend to lose more than the broader market. So, we will caution not to over-invest in them. We recommend up to 25% exposure to this bucket.
For high income, one has to essentially look at investment vehicles like REITs (Real Estate Investment Trusts), mREITs, BDCs (Business Development Companies), MLPs (Master Limited Partnerships), and CEFs (Closed-End Funds).
For this income bucket, we need to be highly selective and choose the best of the best funds in each of the respective asset classes. Also, one should consider this part of the portfolio as a sort of “annuity” subset of the overall portfolio. However, we believe they are much better in many aspects compared to annuities.
We present here a set of 11 high-income investment funds; most of them are CEFs. However, one of them is an individual stock (Magellan Midstream Partners (MMP)), being a partnership. Please be aware that a partnership usually issues a K-1 form (partnership income) at tax time instead of dividend income.
Below are some of the best funds within each asset class. The average yield of the portfolio presented below is very attractive at roughly 10.10%.
The funds/securities that we would consider in a long-term portfolio would be: (CHI), (UTF), (UTG), (PDI), (BBN), (FFC), (BST), (HQL), (MMP), (USA), and (RQI).
Table-4:
Author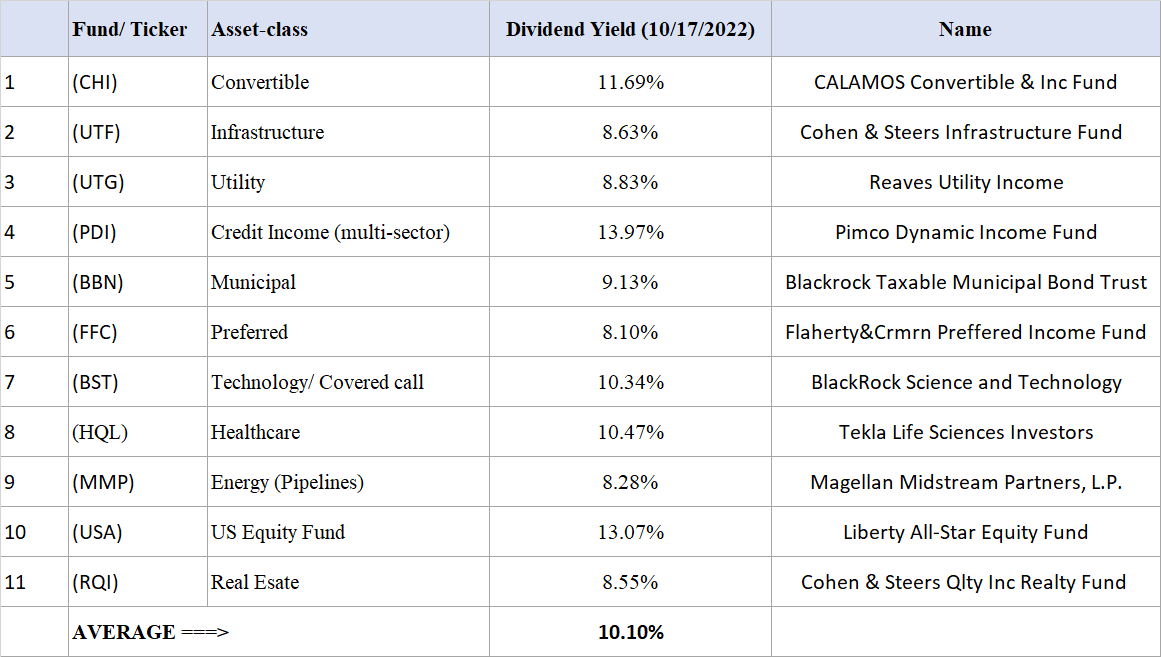
Chart-5:
Author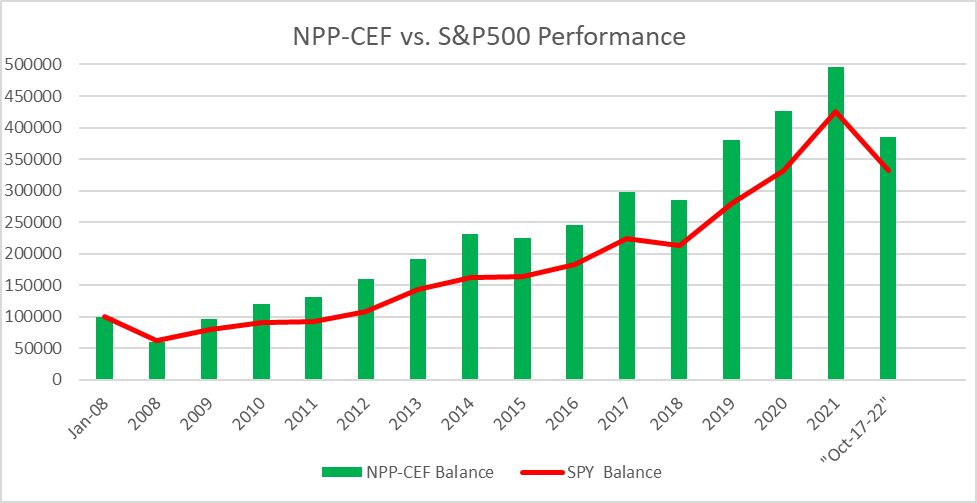
Note: For performance analysis, a couple of funds did not have a history prior to 2013, so they were suitably replaced for the prior period.
Concluding Thoughts
Obviously, the market is going through a period of very high uncertainty. No one can predict where the market will be next week, month, or next year. However, the risk to the downside appears to be greater. If the market was to go down another 20 or 25% from here, most folks are going to see their portfolios lose even more. So, the question is how to preserve wealth to a great extent now without compromising on the upside whenever that happens.
We have tried to answer the above question with the help of our NPP portfolio. What we need is a well-rounded, diversified, and multi-asset investment strategy. We have presented one such diverse investing approach with three baskets, which should provide lower volatility, wealth preservation, and long-term growth. Above all, the combined portfolio should generate a very decent income of 5% and provide protection from bigger drawdowns.
We recognize that the approach outlined in this article may not be appropriate for everyone. These strategies require a long-term investment horizon, discipline, and some time and effort on a monthly basis, especially in managing the Rotational part of the portfolio. Also, the Rotational strategies don’t work very well in a table account. They work best inside a tax-deferred account. The main idea of this series of articles is to get the readers to think and explore and research a multi-basket investment approach.
Be the first to comment