

NosUA
Background
For those interested in John and Jane’s full background, please click the following link here for the last time I published their full story. The details below are updated for 2022.
- This is a real portfolio with actual shares being traded.
- I am not a financial advisor and merely provide guidance based on a relationship that goes back several years.
- John retired in January 2018 and now only collects Social Security income as his regular source of income.
- Jane officially retired at the beginning of 2021, and she is collecting Social Security as her only regular source of income.
- John and Jane have decided to start taking draws from the Taxable Account and John’s Traditional IRA to the tune of $1,000/month each. These draws are currently covered in full by the dividends generated in each account.
- John and Jane have other investments outside of what I manage. These investments primarily consist of minimal-risk bonds and low-yield certificates.
- John and Jane have no debt and no monthly payments other than basic recurring bills such as water, power, property taxes, etc.
I started helping John and Jane with their retirement accounts because I was infuriated by the fees their previous financial advisor was charging them. I do not charge John and Jane for anything that I do, and all I have asked of them is that they allow me to write about their portfolio anonymously in order to help spread knowledge and to make me a better investor in the process.
Generating a stable and growing dividend income is the primary focus of this portfolio, and capital appreciation is the least important characteristic. Providing John and Jane with as much certainty in their retirement remains the primary objective.
Dividend Decreases
No stocks in Jane’s Traditional or Roth IRA paid a decreased dividend during the month of September.
Dividend And Distribution Increases
Four companies paid increased dividends/distributions or a special dividend during the month of September in the Traditional and Roth IRAs.
I covered CMI in the Taxable Account update so I will only include information about the dividend increase. For those interested in reading the summary of these two companies the link is included at the end of the article.
BP
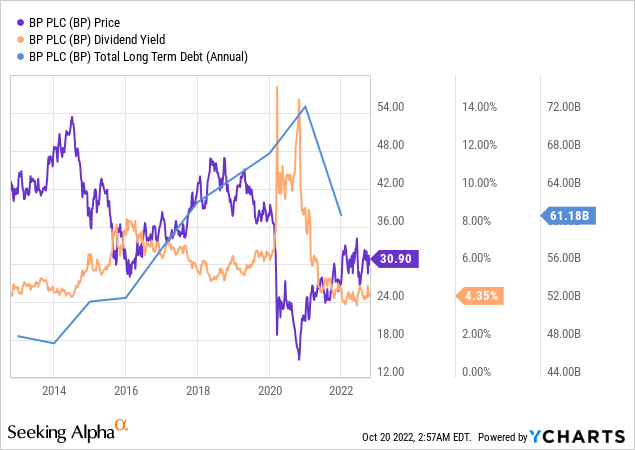
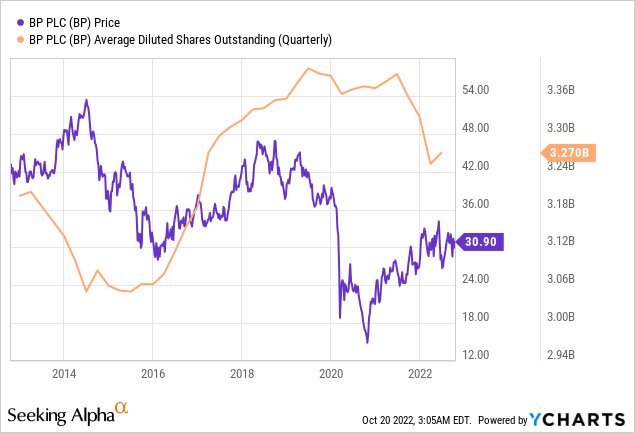
BP has been one of my least favorite energy stocks in recent years with multiple factors negatively impacting their performance. Even as we look at the company over the last decade a substantial increase in debt didn’t pay off when oil prices came crashing down. Making matters worse, BP increased its share count (second image below) by approximately 400 million shares during the same time frame.
Looking at their revamped business model focusing on green energy (now emphasizing a focus on renewable natural gas with their purchase of Archaea Energy (LFG)) which resulted in a significant dividend reduction and share prices dropping to all-time lows. The good news is that BP has used its recent dividend cut and strong oil prices to deleverage with the total debt load being reduced by over $10 billion in the last two years. Share count since 2021 has been reduced by a significant amount as well. Share buybacks for Q4-2022 are estimated to be approximately $3 billion or approximately 96.7 million shares based on a share price of $31/share.
The big question is whether or not we will see competing bids for LFG and can BP accelerate the growth of these assets to make the purchase price worth it. I am more optimistic about BP moving forward now than I was just a few months ago.
Cummins
The dividend was increased from $1.45/share per quarter to $1.57/share per quarter. This represents an increase of 8.3% and a new full-year payout of $6.28/share compared with the previous $5.80/share. This results in a current yield of 2.79% based on the current share price of $220.28.
Main Street Capital
MAIN continues to be the gold standard in the BDC space and its Q3-2022 earnings resulted in a record net investment income (‘NII’) and expected to see net asset value (‘NAV’) increase to nearly $26/share. With the current share price off of the highs this is a great opportunity to accumulate more shares. MAIN’s portfolio benefits from rising interest rates and they have continued to find new projects to continue funding with nearly $270 million of new commitments in Q3-2022. Management has also been prudent about raising capital at opportune times with the most recent share issuance coming in at $42.85/share. We are continuing to add more shares (usually in tranches of 25/shares) even though MAIN represents one of the largest combined positions in John and Jane’s portfolios.
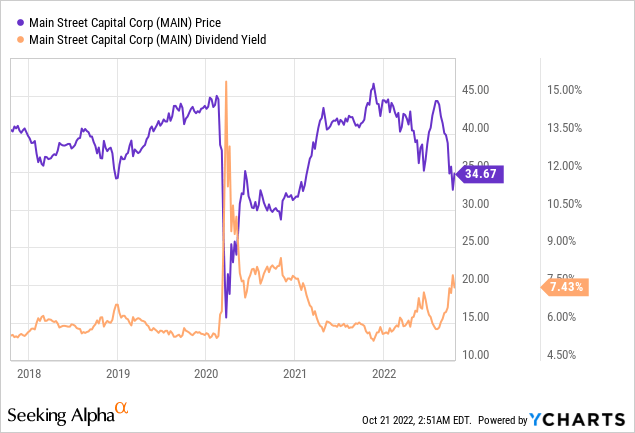
MAIN paid a one-time special dividend of $.075/share in the month of September.
PPG Industries
PPG has had a rough time over the last several months (which is no different than many of its competitors) but the Q3-2022 announcement has the company coming in 5-7% below the low end of adjusted earnings ($1.75-$2.00/share) that was announced in July. Demand in Europe and China are said to be the biggest contributors to this miss and the article also notes that the strong dollar has also created pressure. PPG may be suffering in the short-term but the stock is priced below its 10-year P/E average of 20.8x and current estimates suggest meaningful earnings growth potential in 2023 and 2024. We will continue to add in small quantities and would be willing to make a large increase in the position if the share price drops below $100/share.
PPG Industries (FastGraphs)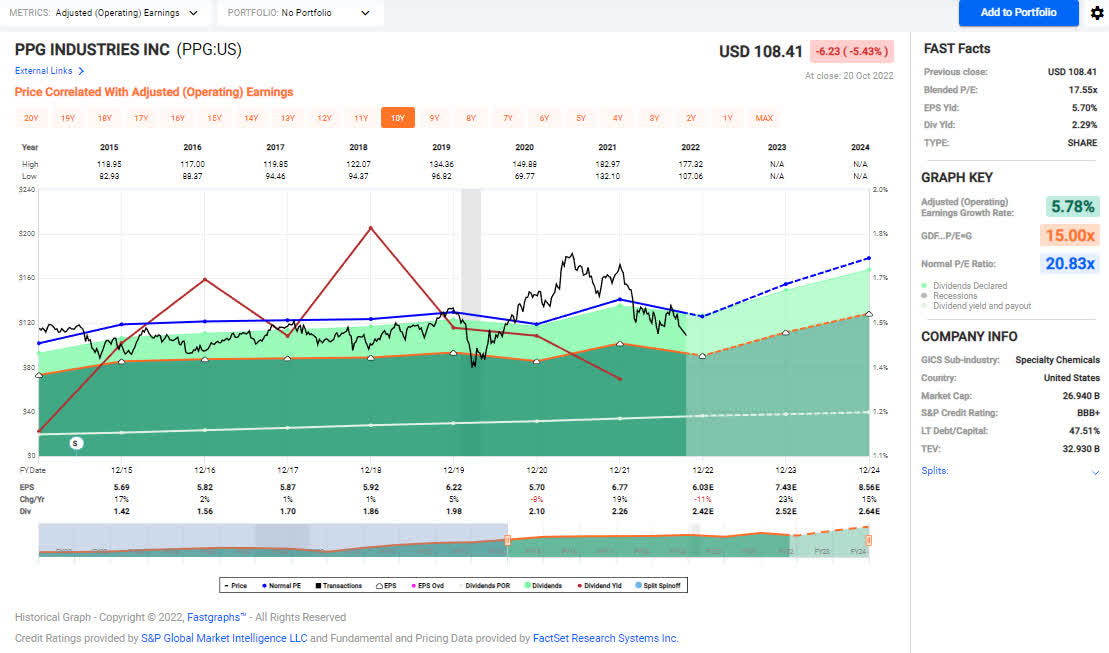
The dividend was increased from $.59/share per quarter to $.62/share per quarter. This represents an increase of 5.1% and a new full-year payout of $2.48/share compared with the previous $2.36/share. This results in a current yield of 2.16% based on the current share price of $108.41.
Retirement Account Positions
There are currently 38 different positions in Jane’s Traditional IRA and 21 different positions in Jane’s Roth IRA. While this may seem like a lot, it is important to remember that many of these stocks cross over in both accounts and are also held in the Taxable Portfolio.
Below is a list of the trades that took place in the Traditional IRA during the month of September.
Traditional IRA – 9-2022 – Trades (Charles Schwab)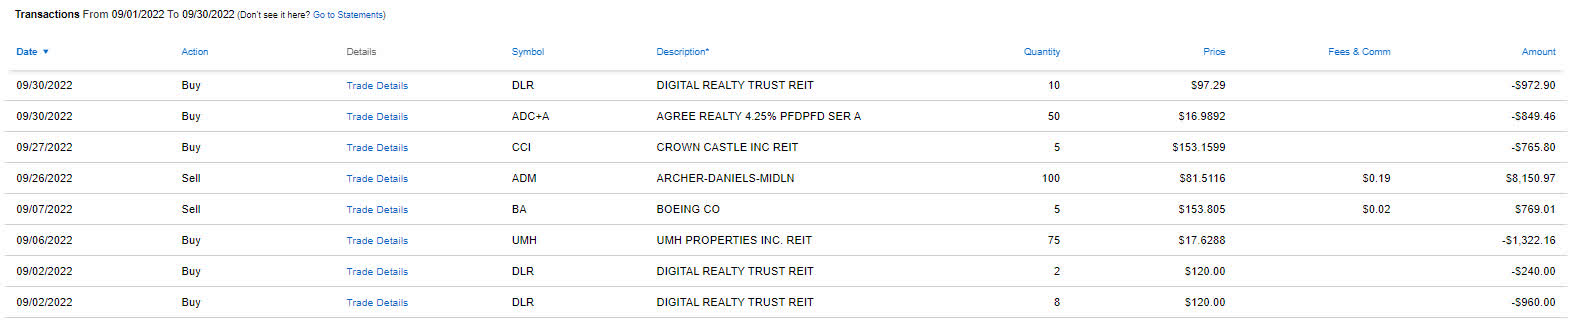
Below is a list of the trades that took place in the Roth IRA during the month of September.
Roth IRA – 9-2022 – Trades (Charles Schwab)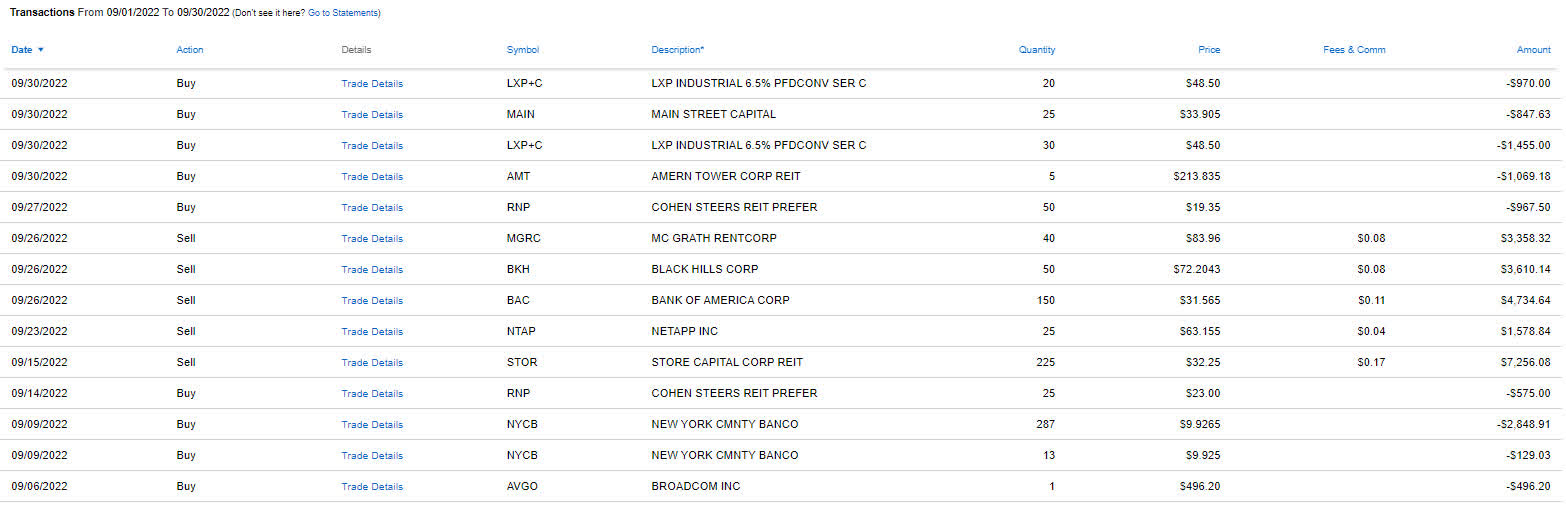
For a more detailed discussion about these trades and the rationale behind them please see my articles on Recent Purchases and Limit Trades. I will be working on an update in the next week covering the most recent trades.
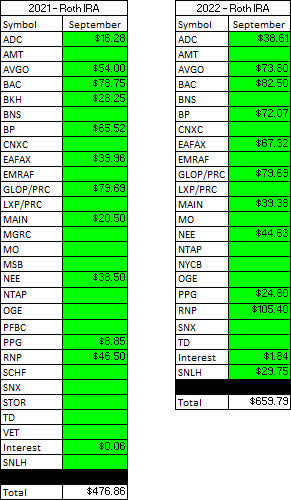
September Income Tracker – 2021 Vs. 2022
Income for the month of September was up significantly year-over-year for Jane’s Traditional and Roth IRAs. The average monthly income for the Traditional IRA in 2022 is expected to be up about 14.2% based on current estimates (roughly half of this increase is due to LYB‘s special dividend) and the Roth IRA is looking to grow by 10.7%. This means the Traditional IRA would generate an average monthly income of $1,583.64/month and the Roth IRA would generate an average income of $655.91/month. This compares with 2021 figures that were $1,386.13/month and $592.61/month, respectively.
SNLH = Stocks No Longer Held – Dividends in this row represent the dividends collected on stocks that are no longer held in that portfolio. We still count the dividend income that comes from stocks no longer held in the portfolio even though it is non-recurring.
All images below come from Consistent Dividend Investor, LLC. (Abbreviated to CDI).
Traditional IRA – 2021 V 2022 – September Dividends (CDI) Roth IRA – 2021 V 2022 – September Dividends (CDI)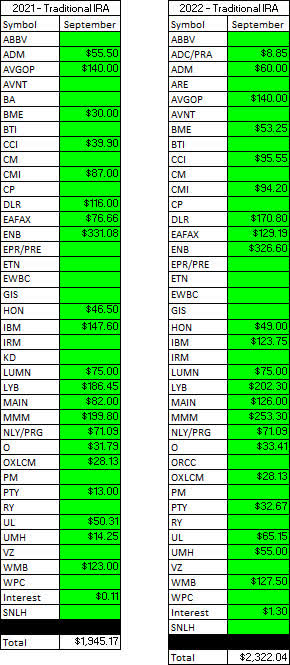
Here is a graphical illustration of the dividends received on a monthly basis for the Traditional and Roth IRAs.
Retirement Projections – 2022 – September – Monthly Dividends (Bar Graph) (CDI)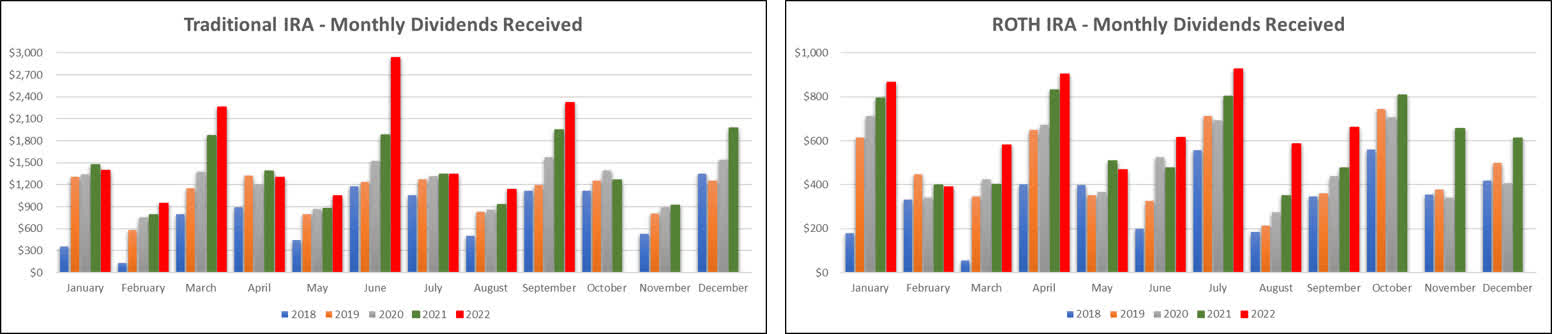
The table below represents the actual full-year results for 2022 and the prior year.
Retirement Projections – 2022 – September (CDI)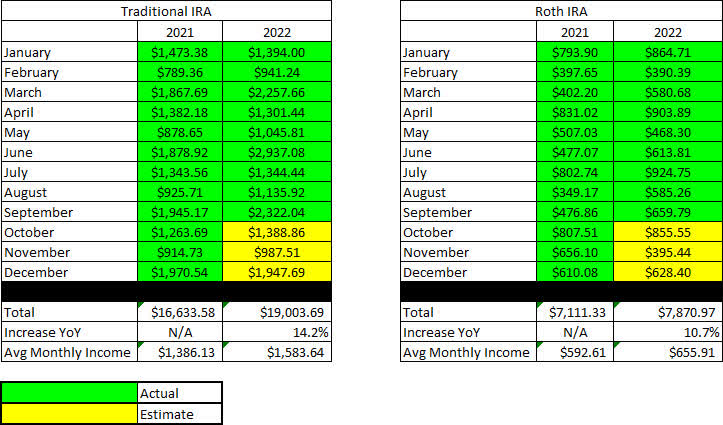
Below is an expanded table that shows the full dividend history since inception for both the Traditional IRA and Roth IRA.
Retirement Projections – 2022 – September – 5 YR History (CDI)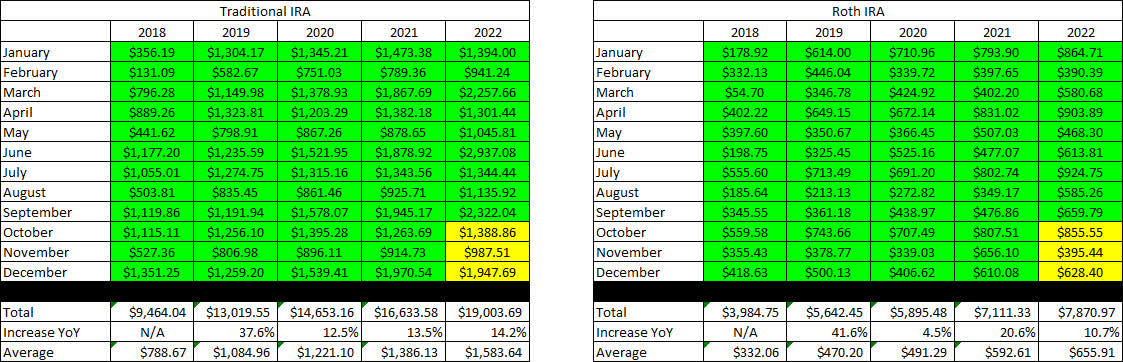
I have included line graphs that better represent the trends associated with Jane’s monthly dividend income generated by her retirement accounts. The images below represent the Traditional IRA and Roth IRA, respectively.
Retirement Projections – 2022 – September – Monthly Dividends (CDI)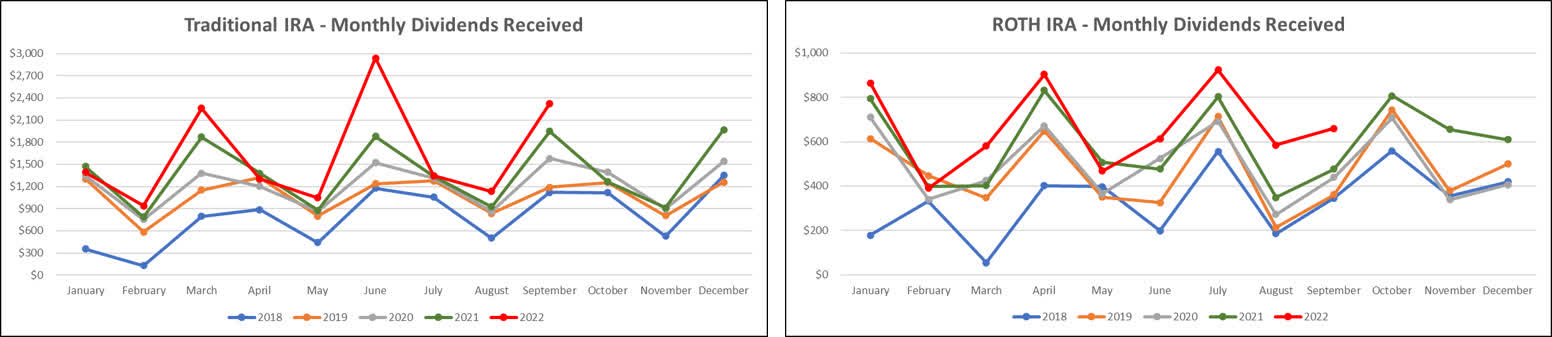
Here is a table to show how the account balances stack up year over year (I previously used a graph but believe the table is more informative).
It is worth noting that with John and Jane Retired, there will be no additional contributions to these accounts. In fact, they have already begun to take regular distributions from the Taxable Account and John’s Traditional IRA.
Retirement Account Balances – 2022 – September (CDI)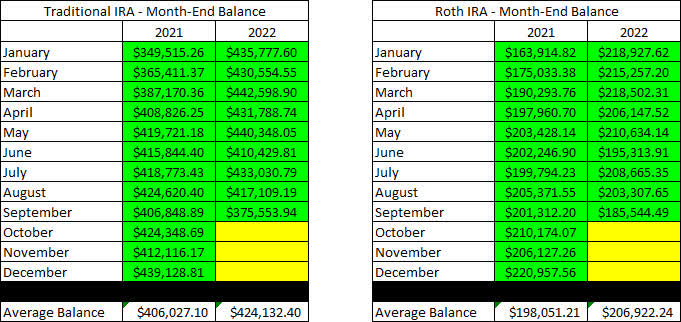
The next images are the tables that indicate how much cash Jane had in her Traditional and Roth IRA Accounts at the end of the month as indicated on their Charles Schwab statements.
Retirement Projections – 2022 – September – Cash Balances (CDI)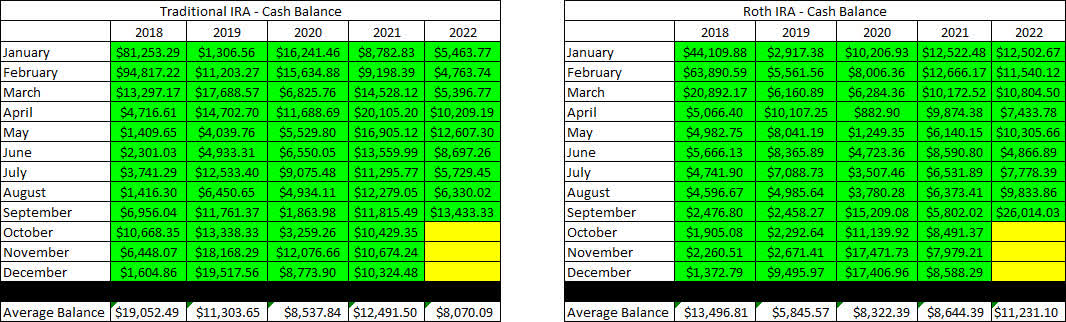
The next image provides a history of the unrealized gain/loss at the end of each month in the Traditional and Roth IRAs going back to the beginning in January of 2018.
Retirement Projections – 2022 – September – Unrealized Gain-Loss (CDI)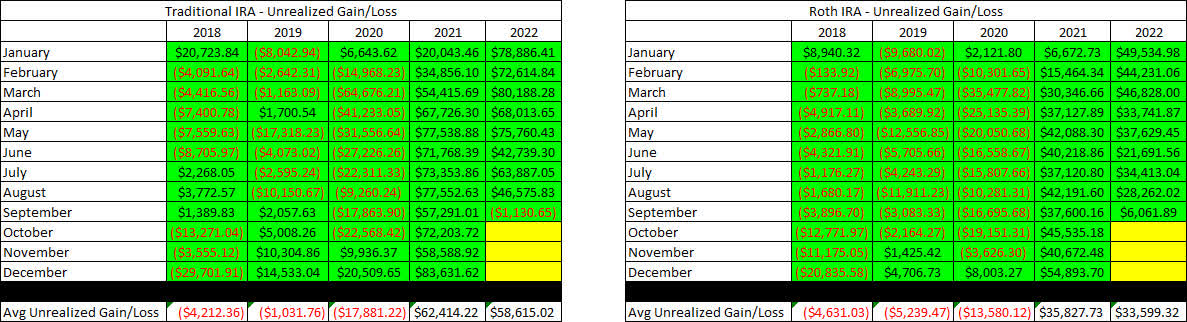
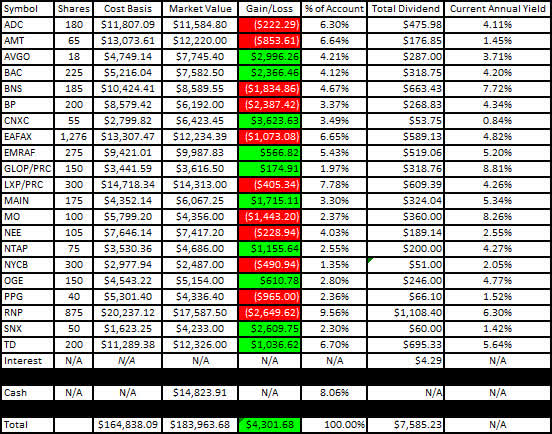
I like to show readers the actual unrealized gain/loss associated with each position in the portfolio because it is important to consider that in order to become a proper dividend investor, it is necessary to learn how to live with volatility. The market value and cost basis below are accurate at the market close on October 20th.
Here is the unrealized gain/loss associated with Jane’s Traditional and Roth IRAs.
Traditional IRA – 2022 – September – Gain-Loss (CDI) Roth IRA – 2022 – September – Gain-Loss (CDI)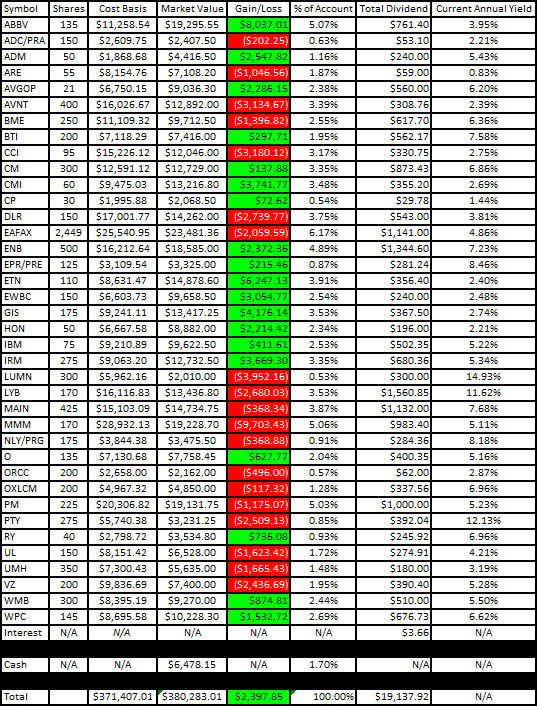
The last two graphs show how dividend income has increased, stayed the same, or decreased in each respective month on an annualized basis. I believe that the graph will continue to become more valuable as more years of data become available (with the fifth year of data being added, we can really see the trajectory of the income change for each month).
Traditional IRA – 2022 – September – Monthly Year-Over-Year Comparison (CDI) Roth IRA – 2022 – September – Monthly Year-Over-Year Comparison (CDI)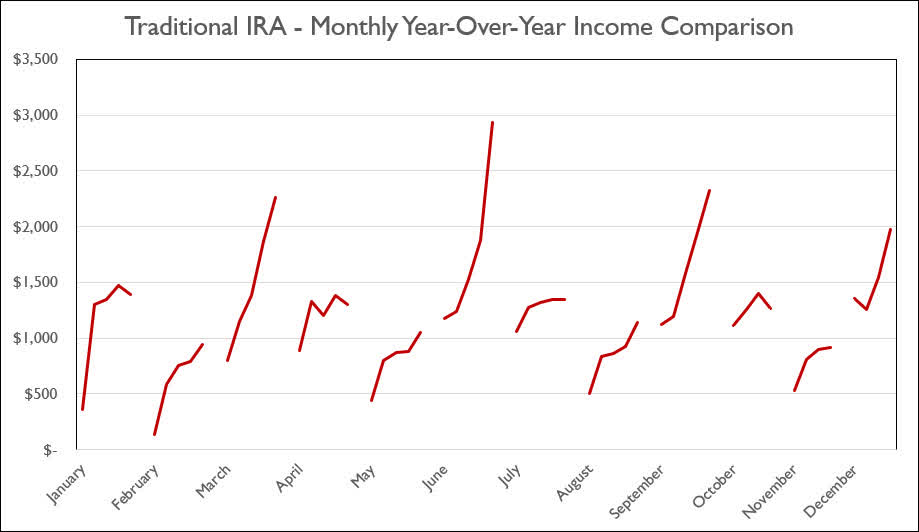

Conclusion
It’s a little disheartening to see the unrealized gains of these accounts evaporate with recent market movement. As much as this is unpleasant it’s important to remember that the dividend growth and sustainability of those cash-flows takes precedence because that is what will matter a decade from now when John and Jane are still looking for income so they can continue living their best retirement.
The transaction history, especially in the Roth IRA, has been particularly heavy over the last month and this is because we have trimmed or eliminated certain positions in an effort to redeploy capital towards those investments that are much more attractively priced and provide a more compelling yield. For example, we have eliminated our position in McGrath RentCorp (MGRC) and Black Hills (BKH). We have also trimmed shares of NetApp (NTAP) and Bank of America (BAC).
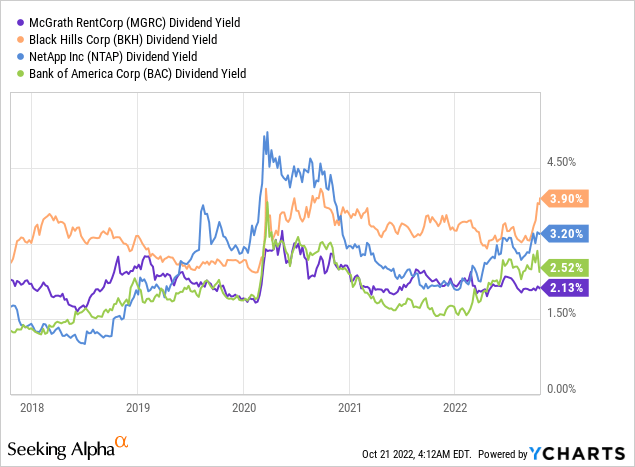
The currently low dividend yields (BKH is the exception and is actually back on the Buy list because we sold at $72.20/share and its now available at $61/share) indicate that there is more likelihood of downside (similar to my recent article about Archer-Daniels-Midland (ADM)) than there is for price appreciation.
Prudent capital rotation has been part of our strategy but the month of September saw an increased number of trades as some stocks (MGC, ADM, etc.) now have nothing more than minimal dividend yield with a modest dividend growth outlook. Without much upside potential, the value proposition of these stocks has been significantly reduced.
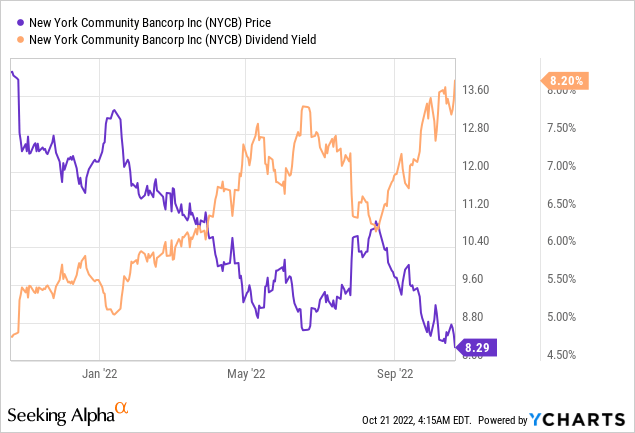
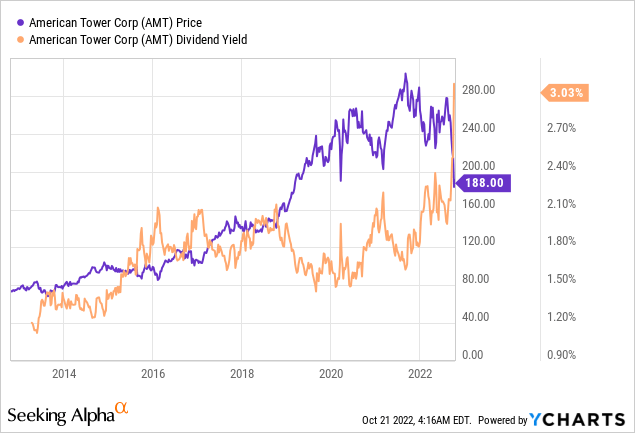
We have decided to reallocate these funds towards New York Community Bancorp (NYCB) and American Tower (AMT). It wasn’t long ago that we were selling shares of AMT for $250+ because we wanted to eliminate our high cost-basis shares and now the stock is available at a yield that hasn’t been seen in a decade.
We have also continued to add to Lexington Industrial (LXP) Preferred Series C shares and MAIN shares as mentioned in the article.
Other companies that are of interest also include other high-quality REITs, including some of the following:
My goal is to continue finding additional undervalued opportunities (including adding to existing positions) because as long as the business model is intact, then these present the greatest opportunity of generating yields that meet John and Jane’s needs.
September Articles
I have provided the link to the September 2022 Taxable Account below.
The Retirees’ Dividend Portfolio: John And Jane’s September Taxable Account Update
In Jane’s Traditional and Roth IRAs, she is currently long the following mentioned in this article: AbbVie (ABBV), Agree Realty (ADC), Agree Realty Preferred Series A (ADC.PRA), Archer-Daniels-Midland (ADM), Broadcom (AVGO), Avient (AVNT), Broadcom Preferred Series A (AVGOP), Bank of America (BAC), BlackRock Health Sciences Trust (BME), Bank of Montreal (BMO), Bank of Nova Scotia (BNS), BP (BP), British American Tobacco (BTI), Canadian Imperial Bank of Commerce (CM), Cummins (CMI), Concentrix (CNXC), Digital Realty (DLR), Eaton Vance Floating-Rate Advantage Fund A (EAFAX), Enbridge (ENB), EPR Properties Preferred Series E (EPR.PE), Eaton Corporation (ETN), Emera Inc. (OTCPK:EMRAF), East West Bancorp (EWBC), General Mills (GIS), GasLog Partners Preferred C (GLOP.PC), Honeywell (HON), International Business Machines (IBM), Iron Mountain (IRM), Lexington Realty Preferred Series C (LXP.PC), Lumen Technologies (LUMN), LyondellBasell (LYB), Main Street Capital (MAIN), 3M (MMM), Altria (MO), Annaly Capital Preferred Series G (NLY.PG), NextEra Energy (NEE), NetApp (NTAP), New York Community Bank (NYCB), Realty Income (O), OGE Energy Corp. (OGE), Oxford Lane Capital Corp. 6.75% Cum Red Pdf Shares Series 2024 (OXLCM), Philip Morris (PM), PPG Industries (PPG), PIMCO Corporate & Income Opportunity Fund (PTY), Cohen & Steers REIT & Preferred Income Fund (RNP), Royal Bank of Canada (RY), TD SYNNEX Corp. (SNX), STORE Capital (STOR), Toronto-Dominion Bank (TD), Unilever (UL), UMH Properties (UMH), Verizon (VZ), Williams Companies (WMB), W. P. Carey (WPC).
Be the first to comment