

chonticha wat/iStock via Getty Images
Gold stood out as an effective hedge in Q1
Q1 Key highlights
- Gold leapt 8% in Q1, its best quarterly performance since Q2 2020, after gold rose a further 2% in March
- Rapidly rising inflation and unexpected geopolitical risks more than offset the drag from higher nominal rates
- Inflows into gold ETFs totalled 269t (US$17bn) in Q1, the highest quarterly total since Q3 2020, while Q1 US Mint gold coin sales hit the highest level since 1999.
Looking forward
- The US Treasury curve has flattened sharply with some sections of the curve inverting – an environment in which gold has historically outperformed
Gold delivers in Q1
Gold rose for the second consecutive quarter in Q1, ending 8% higher at US$1,942/oz – its best quarterly performance since Q2 2020. It was among the best-performing assets amid significant weakness in both equity and bond markets. In a period marked by economic uncertainty and increased volatility, gold proved a reliable source of diversification and wealth preservation.
Gold’s Q1 performance was primarily driven by:
- rapidly rising inflation
- higher interest rates
- unexpected geopolitical risk.
The Gold Outlook 2022 outlined our expectation for the competing forces of higher, more persistent inflation and rising rates to be the biggest influences on gold’s performance. The Russia-Ukraine war added an additional layer to this, as investors sought high-quality safe havens like gold amid equity market volatility and compounding unanticipated inflation pressures, including record oil prices.
Our Gold Return Attribution Model (GRAM) confirms this (Chart 1). With headline inflation rising in many countries, not least in the US and Europe, which had experienced tame inflation for decades, investors remained concerned by the outlook. Inflation expectations, captured in the ‘risk & uncertainty’ category and measured by US 10-year breakeven rates, rose by 30 basis points (bps) during the quarter, almost touching 3% – a new all-time high. This supported gold investment during the quarter, evidenced by US$17bn inflows into gold ETFs which are captured in the ‘momentum’ category. But gold also faced higher ‘opportunity costs’. The 10-year US Treasury yields rose by 100bps in Q1, as the Fed, among others, confirmed the hawkish shift to combat rapidly rising prices.
Chart 1: Higher inflation and geopolitical risks drove gold’s positive Q1 performance
Contributions of gold price drivers to periodic gold returns*
Bloomberg, World Gold Council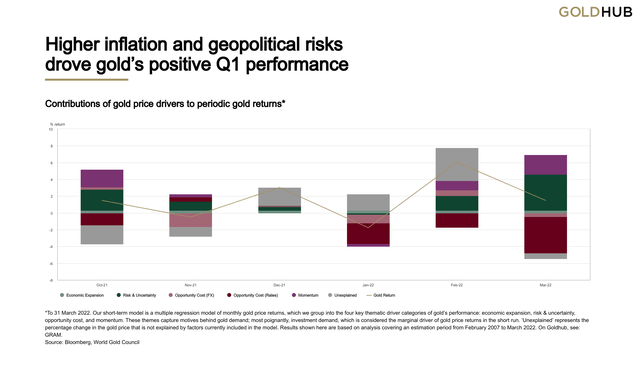
*To 31 March 2022. Our short-term model is a multiple regression model of monthly gold price returns, which we group into the four key thematic driver categories of gold’s performance: economic expansion, risk & uncertainty, opportunity cost, and momentum. These themes capture motives behind gold demand; most poignantly, investment demand, which is considered the marginal driver of gold price returns in the short run. ‘Unexplained’ represents the percentage change in the gold price that is not explained by factors currently included in the model. Results shown here are based on analysis covering an estimation period from February 2007 to March 2022. On Goldhub, see: GRAM.
Looking ahead: nominal rates remain a risk, but inflation and geopolitics support the need for hedges
The geopolitical situation remains an important driver for gold. A prolonged conflict in Ukraine will likely result in sustained investment demand. In contrast, a swift resolution, something which we all hope for, may see some tactical positions in gold unwind, but much like in 2020 we believe significant strategic positions will remain.
However, we believe that the opposing forces of inflation and rising rates will likely be the strongest influences on gold in Q2.
The post-COVID economic recovery and supply-side disruptions, which have been exacerbated by the Russia-Ukraine war, will likely keep inflation higher for longer.
Central banks have shown they are prepared to act. The Fed has begun to raise rates, following the Bank of England (BOE) which has now raised rates in the last three meetings. Even the European Central Bank (ECB), which has resisted growing calls to action, indicated a more hawkish stance at its most recent meeting. While our historical analysis shows that gold has typically performed well following the first rate hike in a tightening cycle, we believe gold may come under renewed pressure around the forthcoming Fed and ECB meetings.
But the war is also affecting the global economic recovery.1 This has recently prompted a number of rating agencies – such as Fitch – to downgrade their 2022 growth forecasts. Widespread rising inflation expectations, low growth, and falling consumer confidence may further complicate central bankers’ policy decisions.
They have also reignited the fear of stagflation, an environment in which gold has historically performed well.
Chart 2: US Treasury curve has flattened sharply, inverting by the end of March*
Bloomberg, World Gold Council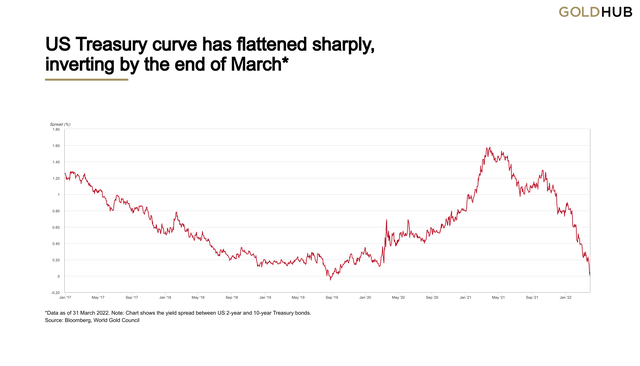
*Data as of 31 March 2022. Chart shows the yield spread between US 2-year and 10-year Treasury bonds.
The combination of higher inflation and interest rates has already led to an increasingly flatter 2/10 US Treasury yield curve, which inverted towards the end of March (Chart 2). Since September 2021, the 2-year yield has increased by almost 2% compared to a near 1% move in 10-year yields, with the spread between the two narrowing to 19bps. Inversion of the Treasury yield curve is usually considered a signal of an impending recession, which could also provide an element of support for gold investment.
Our analysis shows that during phases of 3-m/10-y curve flattening gold has tended to outperform. Gold’s annualised returns during curve flattening were over 5%, compared to just under 3% when the curve is steepening (Chart 3).
Chart 3: Gold outperforms during phases of 3m/10y curve flattening*
Bloomberg, World Gold Council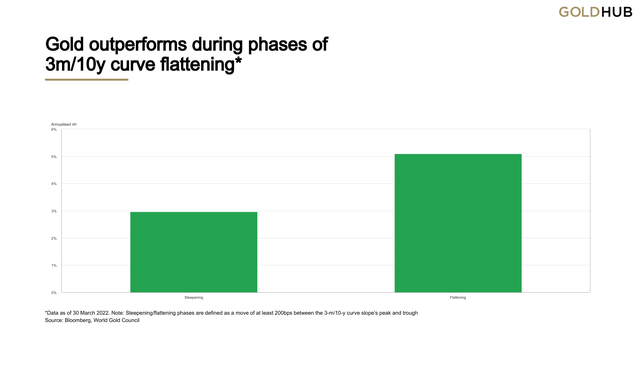
*Data as of 31 March 2022. Steepening/flattening phases are defined as a move of at least 200bps between the 3-m/10-y curve slope’s peak and trough. Analysis from 1969 to 2022.
In addition, despite the prospect of higher nominal rates, both nominal and real yields remain historically low. This, combined with the possible shift to a positive co-movement between bonds and equities, will likely continue the shift into alternative assets.2 It also presents an opportunity for gold, as both an alternative to bonds and a hedge against the greater risk generated by higher allocations to alternative assets.
But while gold investment demand will likely remain strong, price-sensitive consumer elements of demand may be negatively impacted. Anecdotal evidence suggests that gold demand in markets such as India and China has been impacted by a combination of higher and more volatile prices, and by rising COVID cases in the latter.
Regional insights
China: As COVID-19 cases surged in Q1, major cities implemented lockdown measures, weighing on local gold consumption in March. This was also reflected in a compression of the spread between the local and international price of gold during the month.
On the other hand, Chinese gold ETF holdings rose in March. While gold investment may have been supported by falling local equity markets, the listing of three new gold funds in late March also helped. Chinese investors’ choices have now increased to 15 gold ETFs.
India: Retail demand remained sluggish during March as buyers postponed purchases in anticipation of a correction in local gold prices. Wholesale purchases by retailers and manufacturers also remained muted as they opted to close their books ahead of the end of the financial year. Interactions with trade also highlighted higher recycling in March as the gold price surged. Combined sluggish demand and higher recycling volumes led to official gold imports falling 80% m-o-m and the local gold price discount widening to US$60/oz from a discount of US$14-15/oz at the end of February.
Indian gold ETFs witnessed marginal inflows of 0.2t in March, primarily driven by the correction in the gold price which might have spurred investor interest.
US coin sales: US Mint data shows that gold coin sales (American Eagle and Buffalo) totalled US$427mn (220,000oz) in March. This pushed Q1 total US gold coin sales to over US$1bn (518,000oz), the second highest Q1 sales total in volume terms since 1999 (Chart 4). This performance clearly shows that the strong retail interest in physical gold investment products from last year has continued into 2022.
Chart 4: Interest in US Mint gold coins remained elevated in Q1*
Ten highest Q1 American Eagle gold coin sales*
US Mint, World Gold Council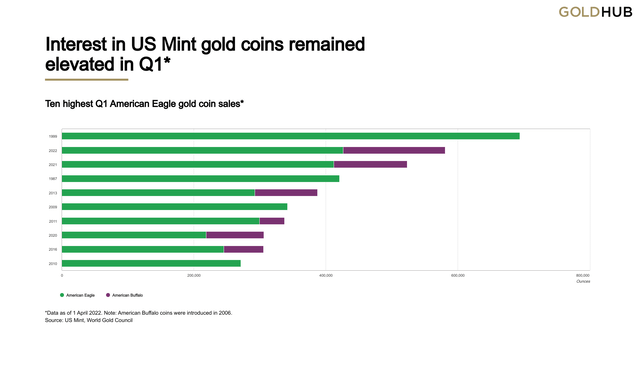
*Data as of 1 April 2022. Note: American Buffalo coins were introduced in 2006.
ETFs: Gold ETF net inflows totalled 187t in March, contributing to net inflows of 269t (US$17bn) in Q1. This is the highest level of quarterly net inflows since Q3 2020, and eclipses the 174t of net outflows in 2021 (Table 1).3 Total AUM in these products now stands at 3,836t (US$240bn), the highest tonnage level since November 2020.4 Inflows throughout the quarter were concentrated in North American and European funds, while Asian funds saw modest outflows led by Chinese and Indian funds.
Table 1: Regional changes in gold-backed ETF holdings in Q1*
| AUM (US$bn) | Holdings (tonnes) | Change (tonnes) | Flows (US$mn) | Flows (% AUM) | |
|---|---|---|---|---|---|
| North America | 123.2 | 1,972.8 | 170.9 | 10,508.1 | 10.0% |
| Europe | 104.6 | 1,675.6 | 110.8 | 6,902.2 | 7.5% |
| Asia | 8.0 | 125.1 | -14.8 | -879.9 | -10.5% |
| Other | 3.9 | 62.4 | 1.9 | 115.8 | 3.3% |
| Total | 239.7 | 3,835.9 | 268.8 | 16,646.3 | 8.0% |
*Data to 28 February 2022. On Goldhub, see: Gold-backed ETF flows.
Source: Bloomberg, Company Filings, ICE Benchmark Administration, World Gold Council
Footnotes
1Recent comments from BoE Governor Andrew Bailey about a “historic shock” to UK growth and incomes could easily be echoed in other key markets.
2Fund houses buy up ‘alts’ specialists to move beyond equities and bonds
3We regularly review the global gold-backed ETF universe and adjust the list of funds and holdings based on newly available data and information.
4All value figures based on the LBMA Gold Price PM as of 28 February 2022.
Editor’s Note: The summary bullets for this article were chosen by Seeking Alpha editors.
Be the first to comment