

Oat_Phawat
Introduction
In 2021, Johannesburg-based Gold Fields Ltd. (NYSE:GFI) released its Operational update for the quarter that ended September 30, 2022, on November 3, 2022.
Note: This article is an update of my article published on September 20, 2022. I have followed GFI on Seeking Alpha since April 2021.
The South African gold miner had a better-than-expected production quarter of 596.9K Au Oz for 3Q22. Revenues for 3Q22 were $1,699 million, not including the JV Asanko, where GFI owns a 45% stake.
On November 8, 2022, Gold Fields Ltd. terminated its takeover deal with Yamana Gold Inc. (AUY), ending its bid to buy the Toronto-based gold producer days after a rival offer emerged from two Canadian miners, Agnico Eagle (AEM) and Pan American Silver (PAAS). GFI jumped over 13% on the news.
It was unexpectedly good news for GFI shareholders. As a reminder, I was not favorable of such a deal, and I am glad the company decided to terminate it and said:
Gold Fields believes the most disciplined and prudent course of action to maximize Gold Fields’ shareholder value is to terminate the arrangement agreement.
Important Note: Yamana Gold is expected to pay GFI a $300 million termination fee within two business days. This termination fee represents about $0.33 per GFI share.
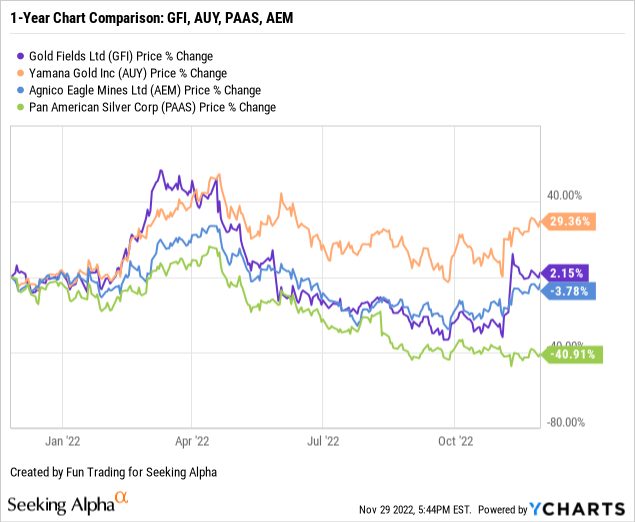
1 – Stock Performance – A visible boost from the termination of the Yamana Gold acquisition.
GFI has significantly jumped on the news and is now up 2% annually. However, the big winner of this situation is AUY which is now up 29% on a one-year basis.
2 – The investment thesis
Gold Fields is an excellent choice for a long-term investment that I suggest in the gold sector. The company is well diversified (Africa, Australia, and South America) and presents a good growth potential with its Salares Norte project, completed at 82% as of September 30, 2021.
I am glad that the company decided to terminate the Yamana Gold takeover, and I believe the company will be in a better position now. By ending the takeover, Yamana Gold has paid Goldfield a $300 million termination fee.
However, this gold miner is highly correlated to the gold price even if the company produces little copper.
The outlook for gold has weakened significantly since the FED decided to fight rampant inflation aggressively, and we may experience further weakness in the gold sector with the US dollar strengthening.
Thus, it is imperative to trade short-term volatility, and I recommend using about 40-50% of your position to take advantage of the short-term fluctuation.
I recommend trading LIFO while keeping a core long-term position for a much higher level and enjoying a significant dividend yield of 3.12% while waiting.
Gold Fields: Balance sheet and Production details
Note: As most are South African gold and PGM miners, results are posted every six months. However, quarterly operational updates are posted in 3Q and 1Q.
1 – Revenues were $1,699 million in 3Q22
GFI Revenues history, including the 3Q22 interim. (Fun Trading)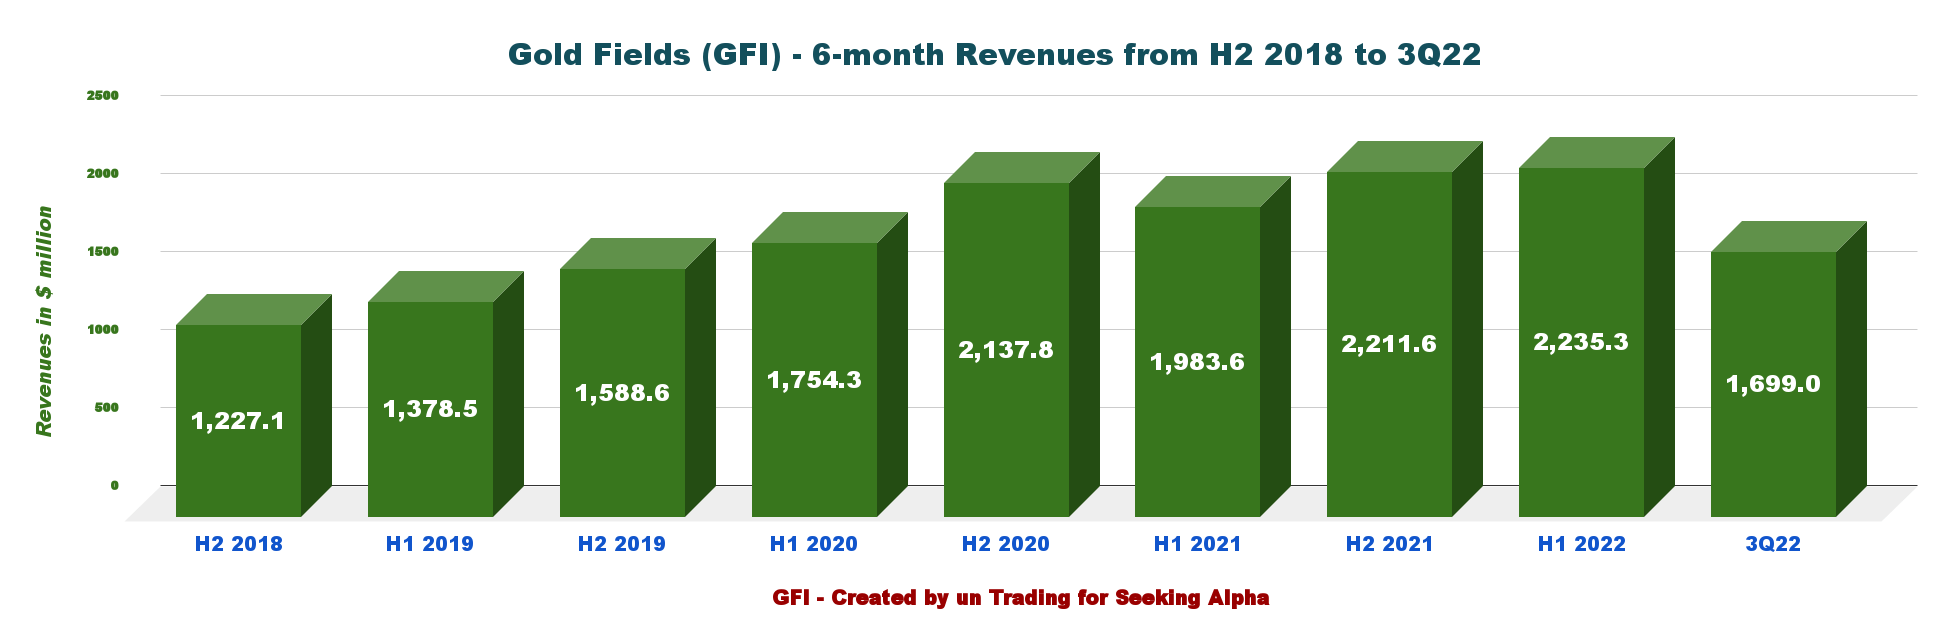
GFI announced quarterly revenues of $1,699 million for 3Q22. The revenues are not including Asanko mine JV. Revenues for the JV Asanko mine were $76.911 million.
2 – Net debt was $997 million at the end of September 2022, including lease liabilities.
During Q3 2022, there was an increase in the net debt balance (including leases) to $997 million from $851 million on June 30, 2022, mainly due to the interim dividend payment of $151 million. Net debt to EBITDA of 0.40x, compared to 0.33x in 2Q22.
The net debt balance (excluding leases) increased to $603 million from $451 million at the end of June 2022.
3 – 3Q22 gold equivalent production details
Attributable gold production was 596.9K Oz in 3Q22 (including Asanko), against 605.7K Oz in 3Q21.
GFI Quarterly attributable Gold production history (Fun Trading)
4 – Gold Fields operates eight mines and one project in five locations across the globe.
- West Africa generated 32.7% of the group’s earnings (consolidated basis): Gold production increased by 5% to 134.7K oz in the September quarter from 128.8K oz in June.
- Australia generated 43.1%: Gold production decreased by 12% to 84.5K oz in the September quarter from 96.4K oz in the June quarter due to a 12% reduction in ore milled due to haulage constraints a result of haulage contractor manning issues.
- South Africa generated 14.2%: Total gold mined marginally decreased by 2% to 86K oz in the September quarter from 87.7K oz in the June quarter due to a decrease in ore mined volumes.
- And the Americas region, Cerro Corona in Peru generated 10%: Gold equivalent production decreased by 19% to 59K oz in the September quarter from 73.9K oz in the June quarter, mainly due to lower gold and copper grades in line with the planned mining sequence for the September quarter. However, full-year production is still in line with the guidance in February 2022.
- Joint Venture Asanko mine (equity accounting): Gold production decreased by 12% to 43.9K oz (100% basis) in the September quarter from 50K oz (100% basis) in the June quarter, mainly due to lower yield. The lower yield is mostly due to lower grades fed primarily from the stockpile. Galiano Gold (GAU) operates the mine and owns 45% of the JV.
Note: A majority of the producing mines are partially owned, as you can see in the chart below:
GFI Quarterly production history per mine (Fun Trading)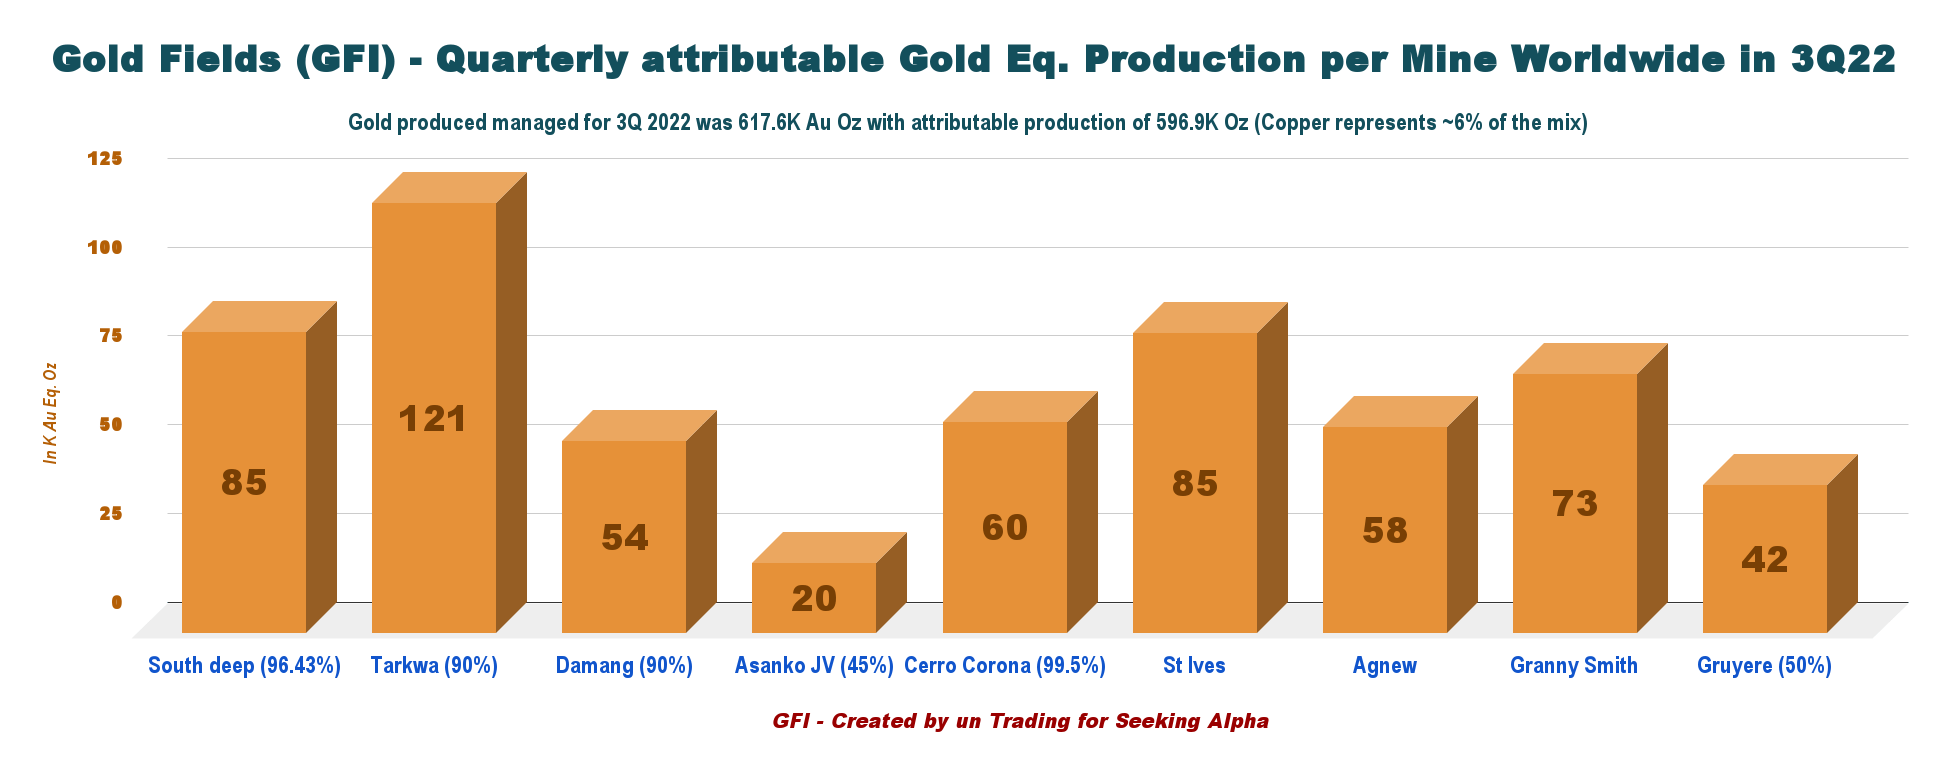
South Deep, in particular, had another excellent quarter, with production up 2% QoQ.
5 – AISC and Gold price history.
Inflationary pressures are hurting. The gold price was $1,699 per ounce in 3Q22 compared to $1,770 per ounce in 3Q21. AISC for 3Q22 is $1,061 per ounce, up 4.4% compared to 3Q21 but down 7.4% sequentially. The strong US$ is helping.
GFI Quarterly AISC and gold price history (Fun Trading)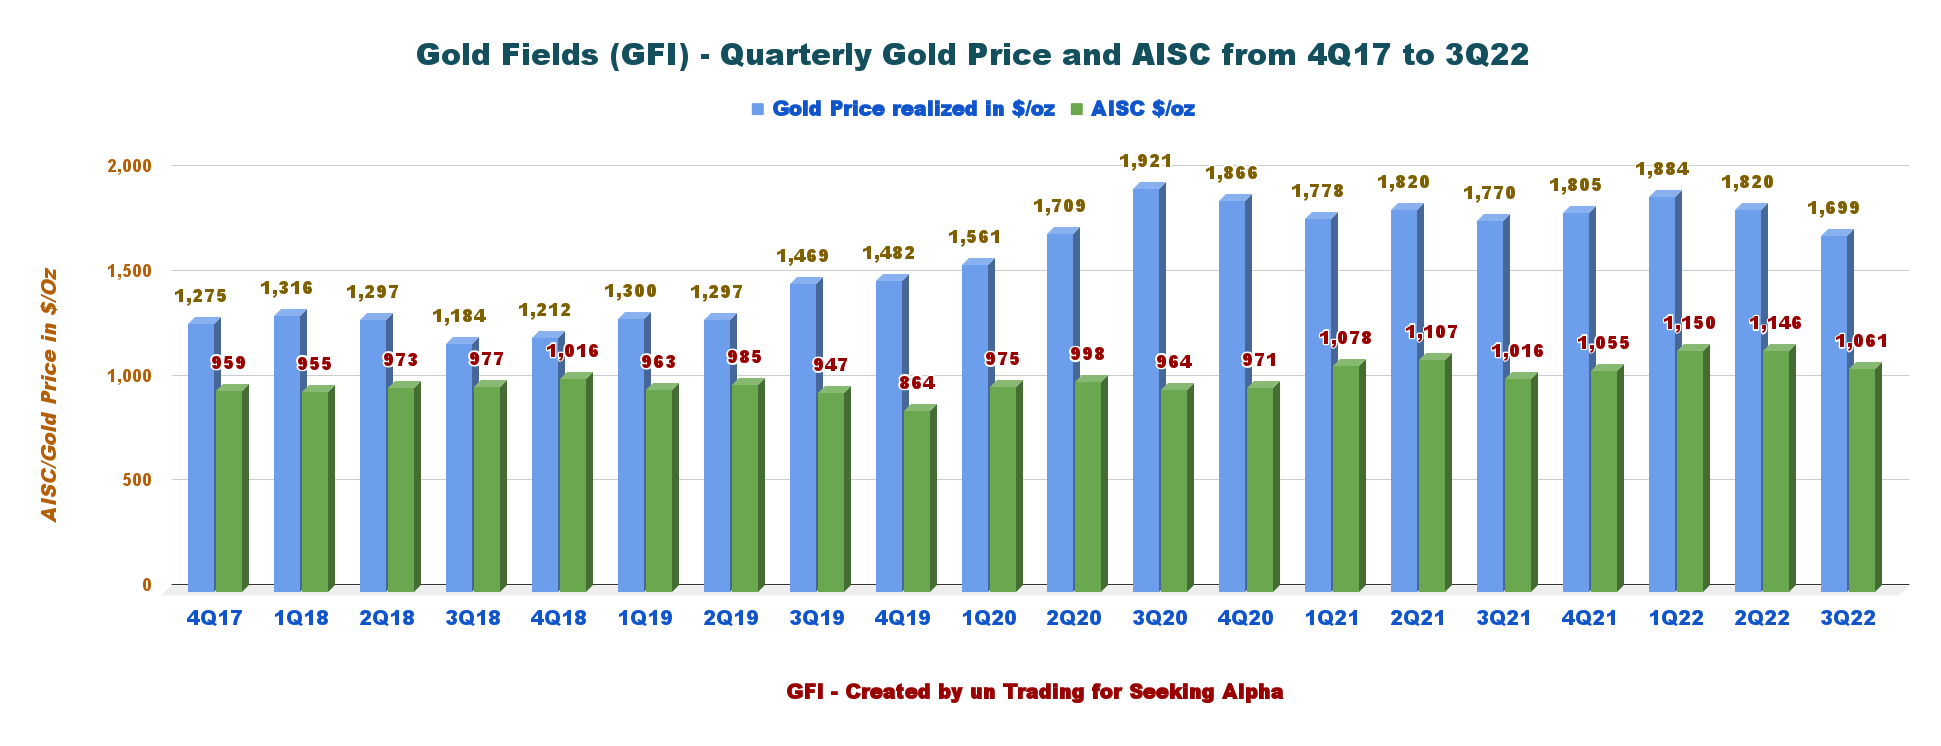
6 – Salares Norte project: Progress reached 82% at the end of September 2022.
The Salares Norte project continued progressing during Q3 2022 but at a slower pace. The total project progress at the end of September was 82% compared to 77% at the end of Q2 2022. The company said in the press release:
Q3 2022 construction activities at Salares Norte were again impacted by Covid together with severe weather conditions that flowed over from the second quarter.
Construction progress decreased to 7.0% for the three months ended 30 September 2022 compared with 9.3% for the three months ended 30 June 2022.
It was no surprise here; the company announced in the preceding quarter that the project would experience some delays (one to three months) due to severe weather, impacting construction activities toward the end of 2Q22.
Pre-stripping at the Brecha Principal pit continued as planned, and 7.3M tonnes were stripped during 3Q22 compared with 9.0M tonnes for 2Q22. Project to date pre-stripping is 50.0M tonnes, and pre-striping was completed on October 10, 2022, ahead of plan.
7 – 2022 guidance (excluding Asanko) is unchanged.
The company is on track to achieve the Group production guidance provided in February 2022. Gold equivalent production is expected to be 2.25 Moz to 2.29 Moz in 2022. Including Asanko, attributable gold equivalent production is expected to be between 2.31Moz and 2.36Moz.
AISC (excluding Asanko) is expected to be between $1,140/oz and $1,180/oz. The exchange rates for 2022 guidance are R/US$ 15.55 and US$/A$0.76. A strong dollar is helping GFI.
Note: South Deep mine has been tracking well against its production targets throughout the year. As a result, the team has revised gold production guidance to 321,500 ozs for 2022. Previous guidance was 308,600 ozs to 311,800 ozs.
Part III – Technical Analysis (short-term) and Commentary
GFI TA Chart short-term (Fun Trading StockCharts)
Note: The chart has been adjusted for dividends.
GFI forms an ascending wedge pattern with resistance at $12.5 and support at $10.75.
The trading strategy I recommend is to take LIFO profits between $12.25 and $12.75 (about 25%) and buy back between $10.75 and $10.25 with possible lower support at $8.80.
However, depending on the gold price strength and the action of the Fed, which is expected to raise interest rates by 50 points or 75 points on December 14, GFI could cross the resistance and retest $13-$13.5 or go down below $9.
The market is pushing for a lower rate right now, which gives some support to the gold price at around $1,750 per ounce, but the FED may be reluctant to water down its hawkish action so soon.
Watch Gold like a Hawk.
Warning: The TA chart must be updated frequently to be relevant. It is what I am doing in my stock tracker. The chart above has a possible validity of about a week. Remember, the TA chart is a tool only to help you adopt the right strategy. It is not a way to foresee the future. No one and nothing can.
Author’s note: If you find value in this article and would like to encourage such continued efforts, please click the “Like” button below as a vote of support.
Be the first to comment