

Deagreez/iStock via Getty Images
This article was originally published on Dividend Kings on Tuesday, January 24th, 2023.
—————————————————————————————
What kind of stocks do you think of when you hear “life-changing investments?”
Maybe Apple (AAPL)? Or Amazon (AMZN)? Or Microsoft (MSFT)? Those famous growth kings that minted millionaires the moment they IPOed?
You probably don’t think of names like CVS (CVS), Smuckers (SJM), or Procter & Gamble (PG) do you.
Well, guess what? People like Ronald Read and Anne Scheiber used nothing but dividend blue-chips to wind up fabulously wealthy.
Who are these people? Ronald Read was a Vermont janitor who was the first in his family to graduate from high-school.
Anne Scheiber worked for the IRS and never made more than $4,000 per year. She retired on a $3,100 annual pension in 1947.
And yet using pure buy-and-hold dividend blue-chip investing, Mr. Read and Miss Scheiber were able to amass an $8 million and $22 million fortune.
That’s because dividend growth blue-chips, while not the most exciting thing you can buy, are historically the most lucrative.
Legacy Research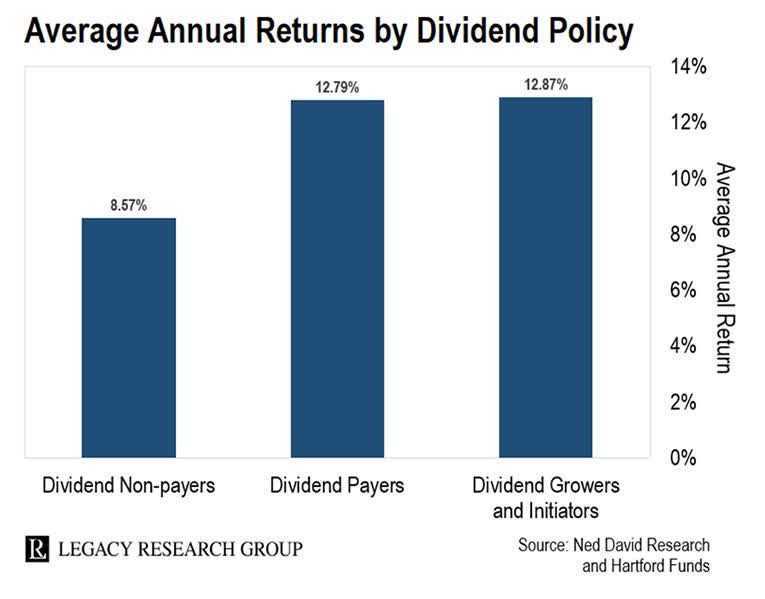
Over the last 50 years, dividend blue-chips delivered 13% annual returns. $1 turned into $413, and they delivered 7X better returns than non-dividend stocks.
The point is that boring is beautiful, as well learned in 2022, when red hot growth names fell off a cliff, and high-yield value became the new hotness.
Can you really earn market-beating returns from boring old dividend stocks? Yes, just take a look at Enbridge (NYSE:ENB), the boring old pipeline utility that has delivered life-changing income and wealth for decades.
Total Returns Since 1990: $1,000 Initial Investment
Portfolio Visualizer Premium 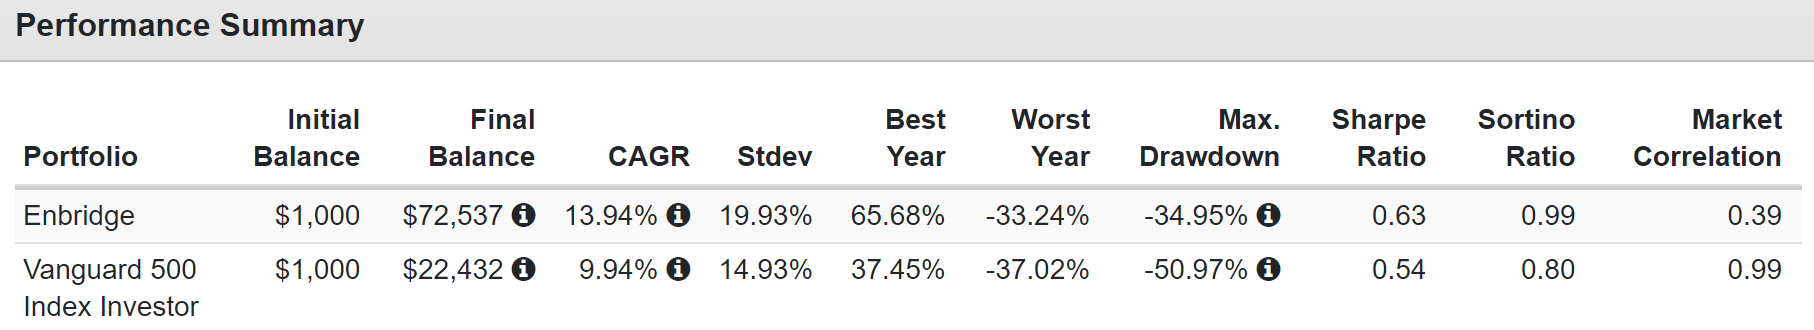
Enbridge delivered market-beating returns of 14% for 32 years, turning $1,000 into $73,000 and minting plenty of millionaires.
Can Enbridge keep generating 14% returns in the future? No, that would be better than the Nasdaq’s 13.5% 37-year track record.
But can this 6.3% yielding dividend aristocrat change your life? It absolutely can.
In fact, that’s what my family is counting on.
Enbridge is the 4th largest holding in my family hedge fund (DK ZEUS Income Growth) portfolio.
I’ll eat my hat if ENB doesn’t become a dividend king in 2044. How confident am I in Enbridge? I have $144,000 invested in this company.
- I’m currently overweight the high-yield blue-chips in order to be able to afford to pay medical bills with our 6.7% yielding dividends
It’s the single largest stock position in the portfolio.
Why? Is it because ENB is the highest-yielding blue-chip midstream? No, that would be MPLX (MPLX).
Is it the fastest growing? No, that would be ONEOK (OKE).
Is it the most undervalued? No, that would be National Fuel Gas (NFG).
But what makes ENB special and worthy of a spot in my “buy and hold forever” ZEUS Income Growth portfolio is its industry-leading safety and quality.
My ZEUS Income Growth portfolio is designed to make all of my family’s dreams come true.
- each year I give a bit of it to my family and closest friends in the form of gifts
- eventually, they will own 5% to 10% of it
What is my family hedge fund meant to do?
- pay my grandparent’s medical bills (what it’s currently doing with its dividends)
- send my sister’s children to college
- send my best friend’s kids to college
- send my kids to college
- ensure my sisters have a rich retirement
- ensure my best friend has a rich retirement
- buy my sister’s houses
- buy my parents a retirement house in Poland
- buy me a house for my family in North Oaks (the best city in Minnesota to raise a family in)
- let me donate millions to my favorite charities
So this portfolio needs to own the world’s best companies with the safest and most dependable dividends. Not just companies that are likely to do well in the next few years but for decades to come.
So why does my family trust Enbridge with our future hopes and dreams? Why can you? Let me show you, and I think you’ll agree ENB is one of the safest high-yield aristocrats you can buy today.
Reason One: The Safety And Quality King Of Midstream
- ENB is a Canadian company
- NO K1 tax form
- qualified dividends
- 15% dividend tax withholding for US investors in taxable accounts
- non in retirement accounts
- tax credit is available to recoup the withholding in taxable accounts
Why Enbridge Is The Ultimate Buy And Hold Forever Midstream Blue-Chip
Enbridge was founded in 1949 in Calgary, Canada. It’s the oldest and largest midstream company in North America.
Investor Presentation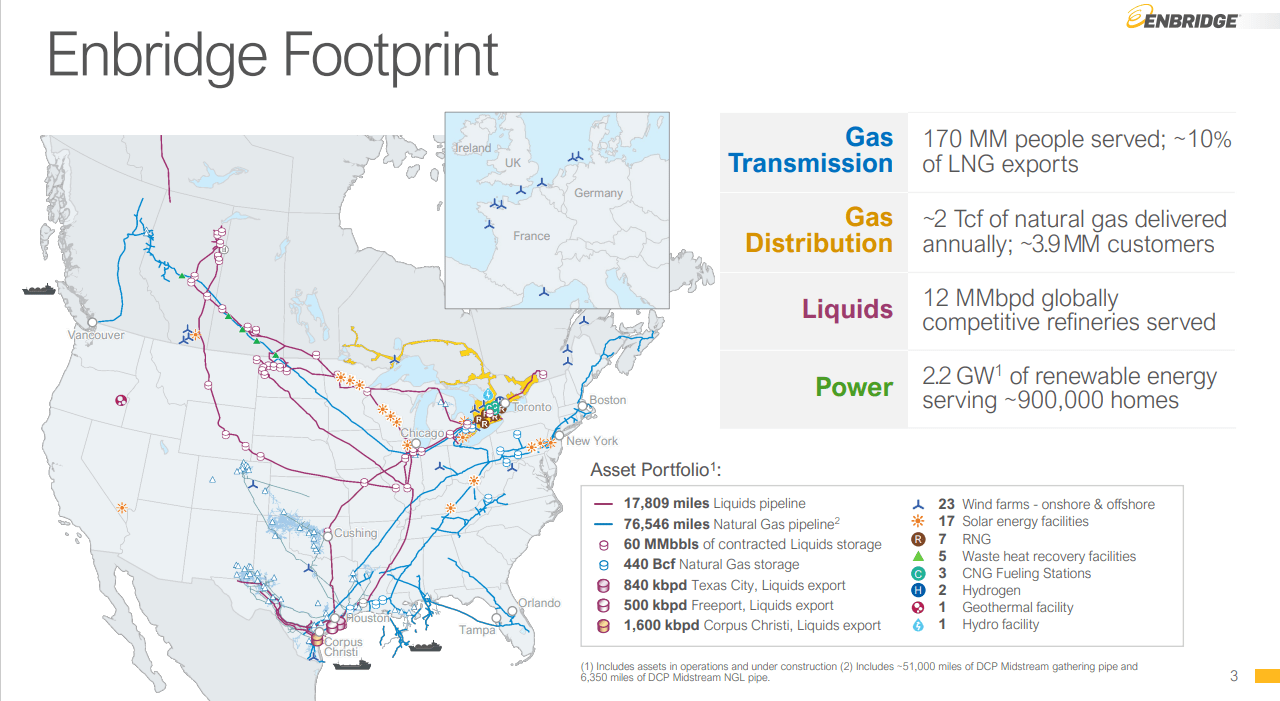
Enbridge is the most utility-like midstream, with 98% of cash flow not exposed to commodity prices. It literally is a utility, with 900,000 power customers in Ontario and 4 million natural gas customers (mostly Toronto).
It owns North America’s largest and most diversified pipeline assets, totaling almost 93,000 miles of natural gas and crude pipelines.
For context, the entire nation of Iran, an OPEC country, has 80,000 miles of total pipelines.
- If ENB were a country, it would have the 5th most pipeline assets on earth
Investor Presentation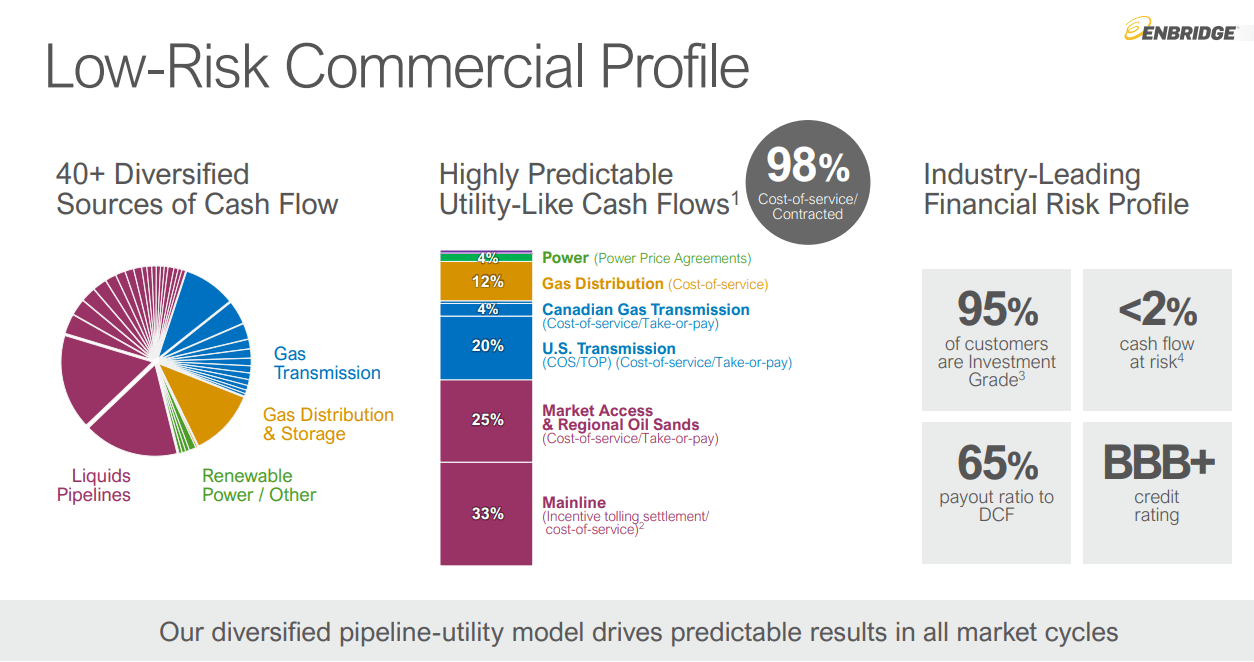
80% of ENB’s cash flows are protected against inflation, and it supplies 70% of Canada’s crude transportation capacity.
Investor Presentation
ENB is essential to life in North America. It supplies 30% of the crude this continent uses, 20% of its natural gas, and 75% of the gas used in Ontario (including Toronto), and powers 900,000 European homes with wind power.
Management is skilled at managing risk (the best in the industry, according to S&P). It’s also long-term focused on the best investment opportunities that support dividend growth.
Investor Presentation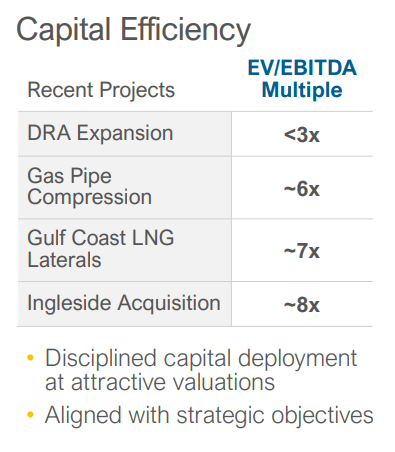
That includes investing in new growth projects that generate 12.5% to 33% EBITDA yields, compared to an average interest cost of 3.9%.
Investor Presentation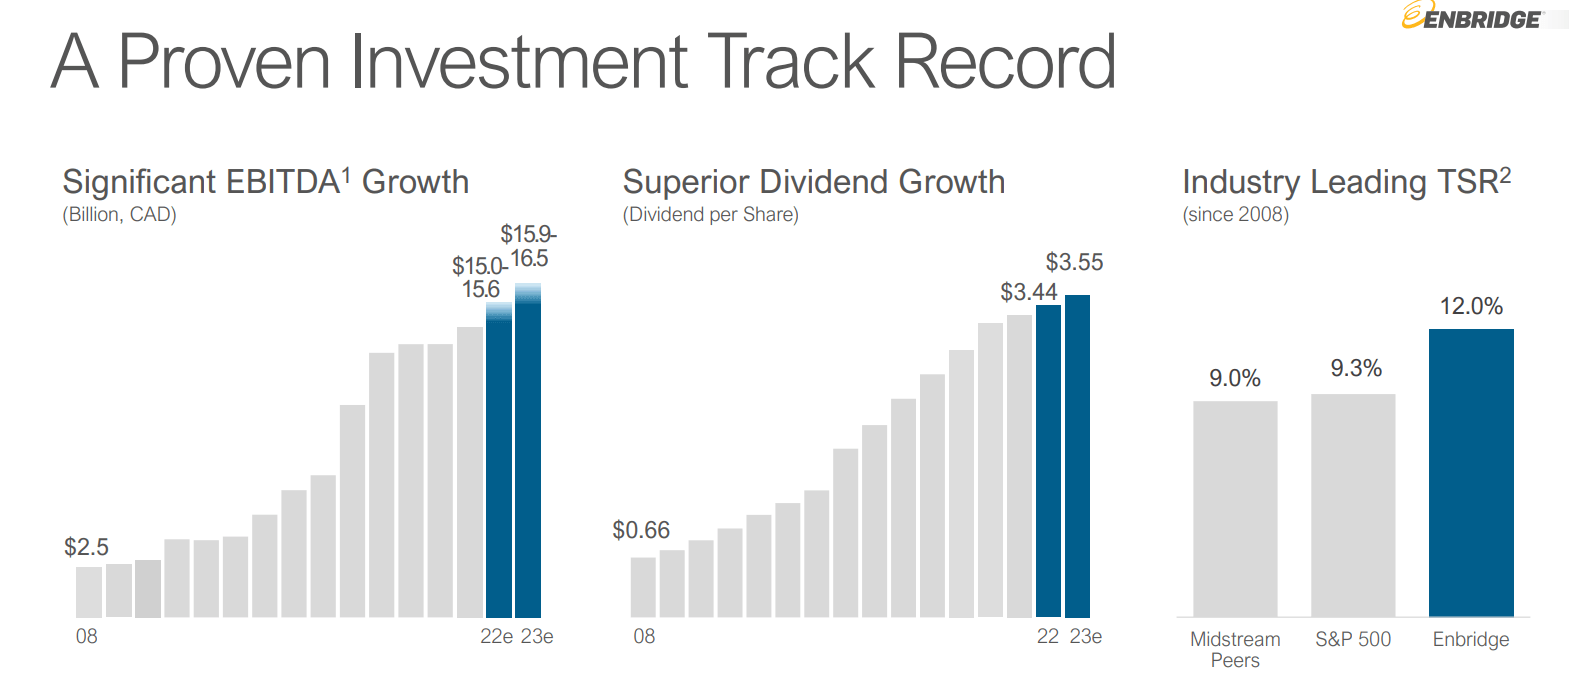
It’s investing discipline like that which has allowed ENB to deliver industry-leading growth, including a 28-year dividend growth streak. All while outperforming not just its peers but also the S&P 500.
Investor Presentation
According to the International Energy Agency, or IEA, by 2030, the world will need about $7 trillion in conventional energy investment to meet demand.
ENB plans to be a part of the bridge to a green energy future, including natural gas, renewable natural gas, solar, wind, hydrogen, and carbon sequestration and storage.
Investor Presentation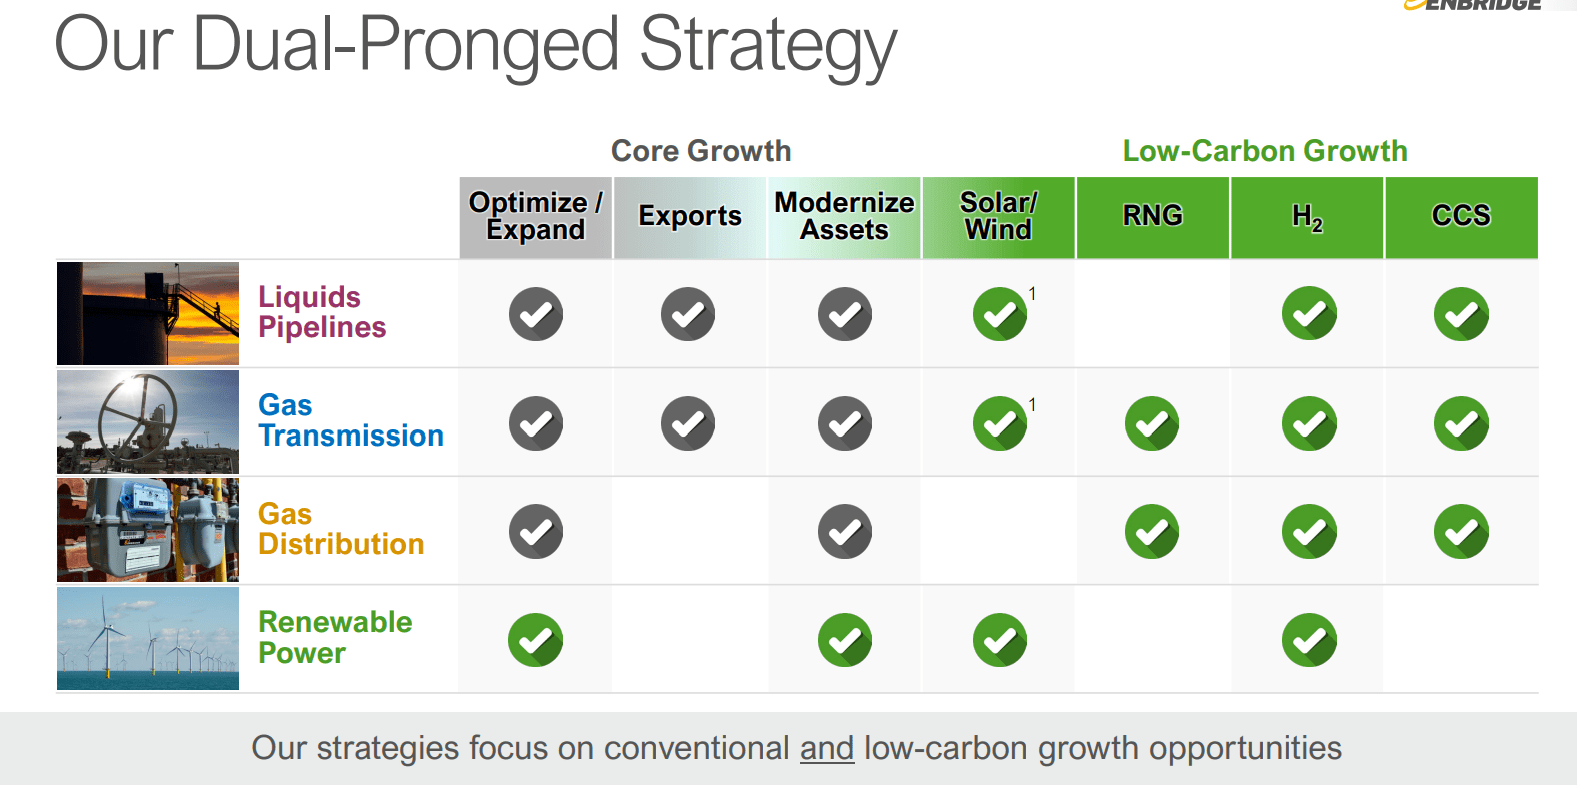
ENB’s massive growth opportunities span decades and already include $12.7 billion in contracts and secured growth projects.
Investor Presentation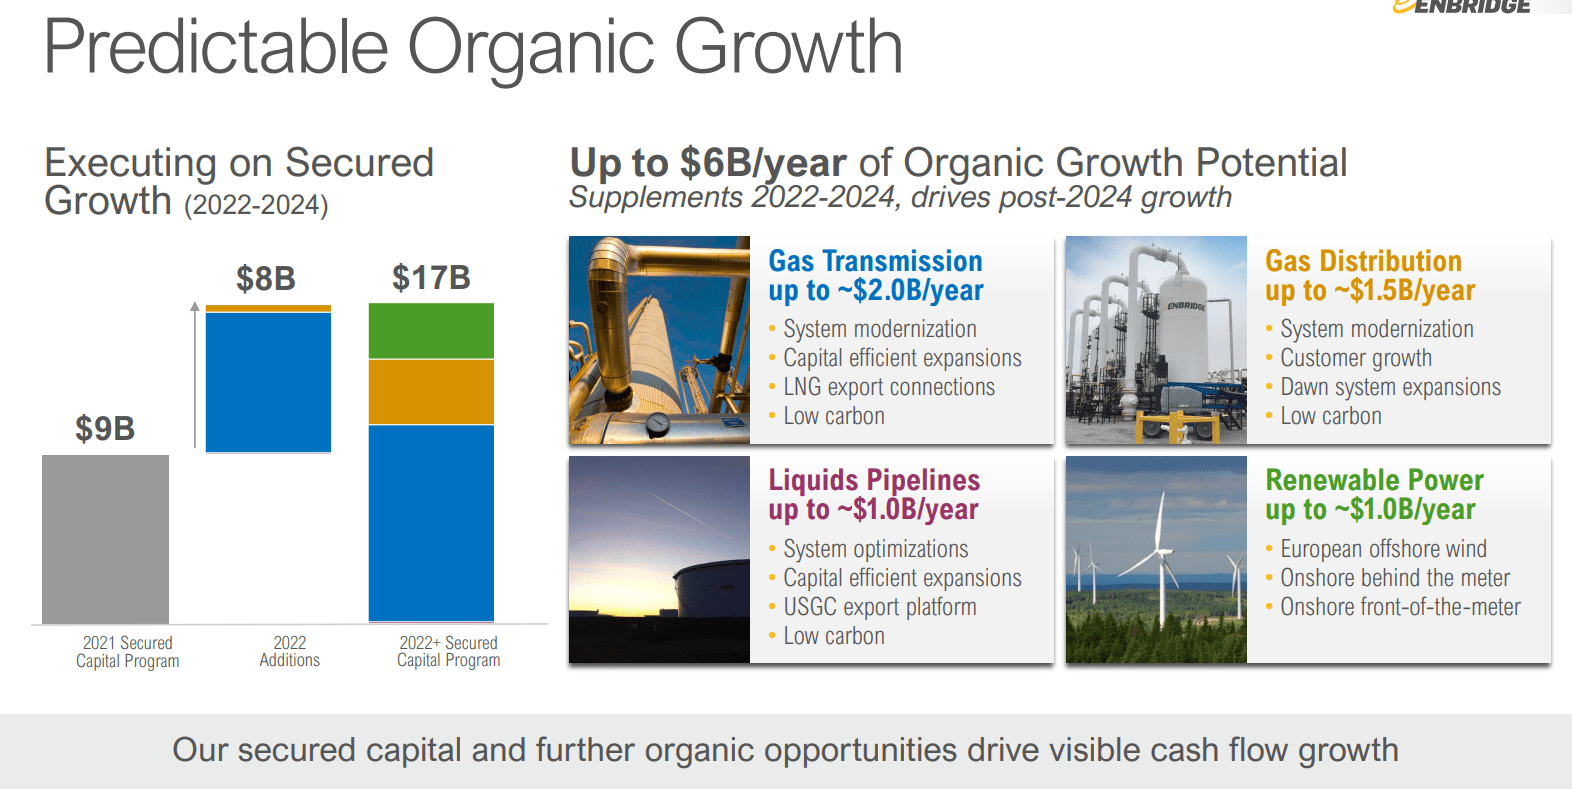
Long-term management thinks it can sustainably invest $4.5 billion per year into growing its assets, including $750 million per year into green energy.
ENB is already one of the world’s leading offshore wind producers.
- Its wind farms power 900,000 European homes
Investor Presentation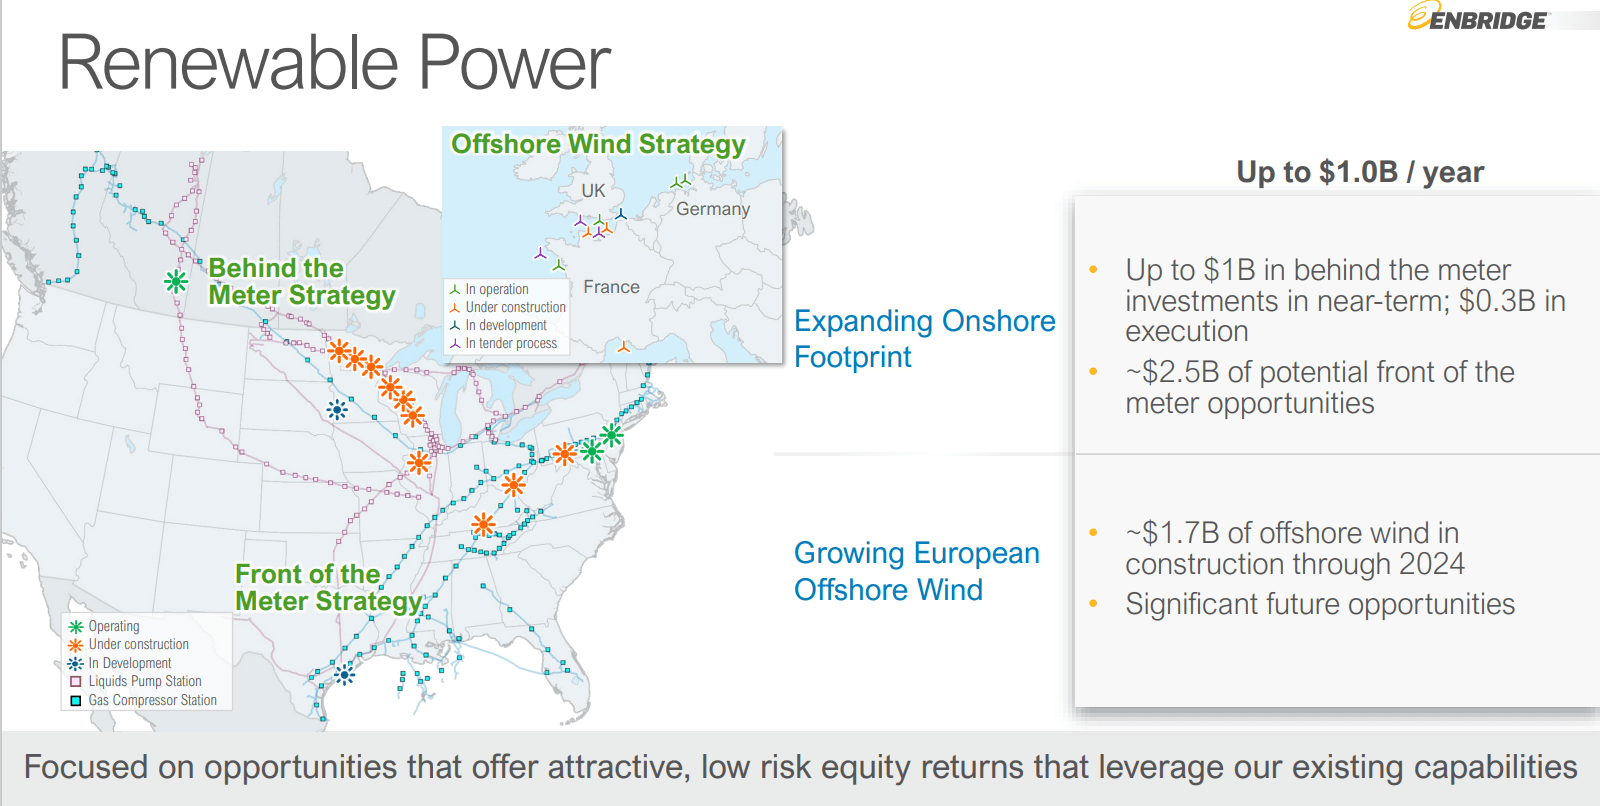
According to Bloomberg Intelligence, green energy is a potential $150 trillion growth opportunity over the next 30 years. Offshore wind alone is a potential $7 trillion opportunity, and ENB is an industry leader in that space.
Investor Presentation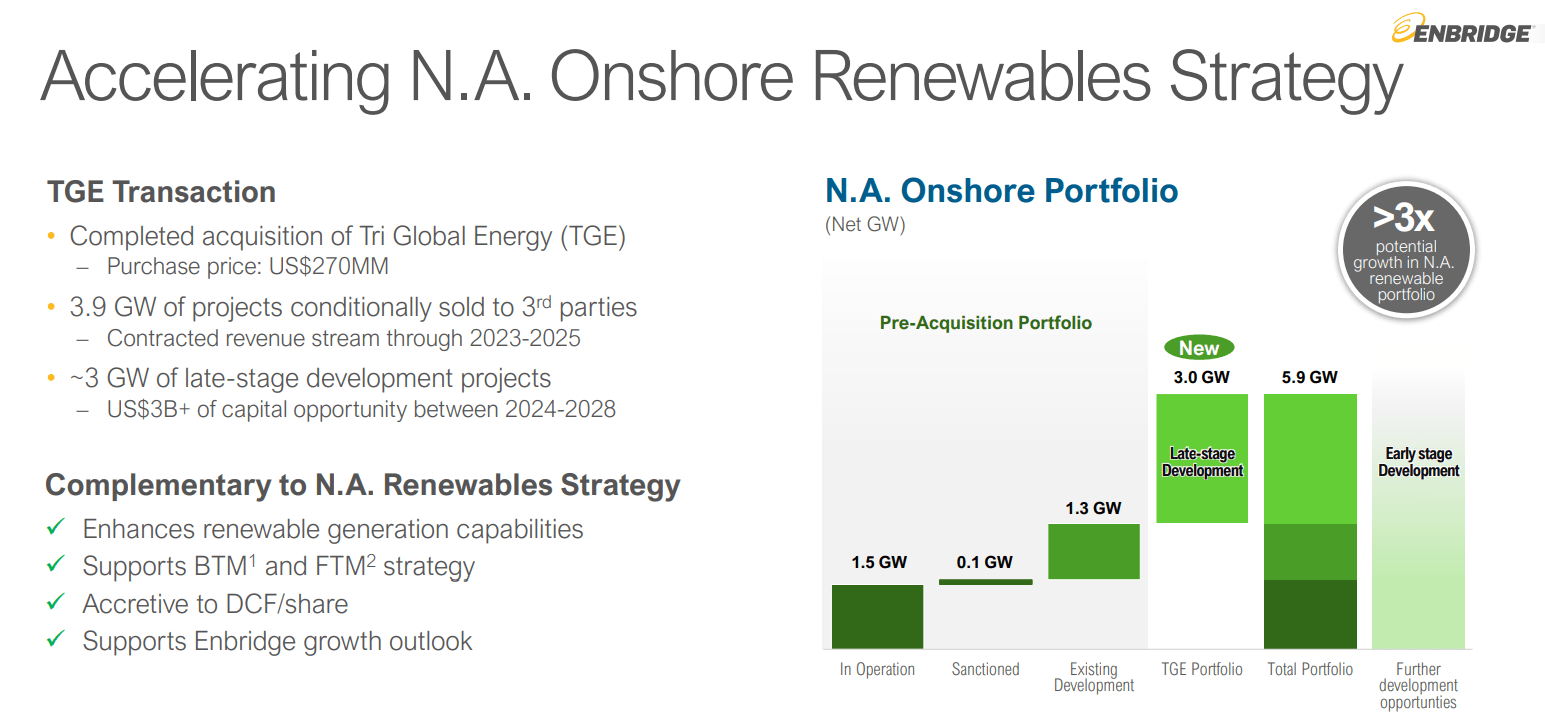
As part of a plan to potentially more than triple its North American wind capacity, ENB recently bought Tri Global Energy for $270 million.
That means that within a few years, ENB could have 6 GW of wind production capacity in North America alone.
- equal to six large nuclear reactors
- enough to power 4.5 million homes
- there are 256 million homes in North America
- within five years, ENB might be able to supply about 2% of them with wind power
Investor Presentation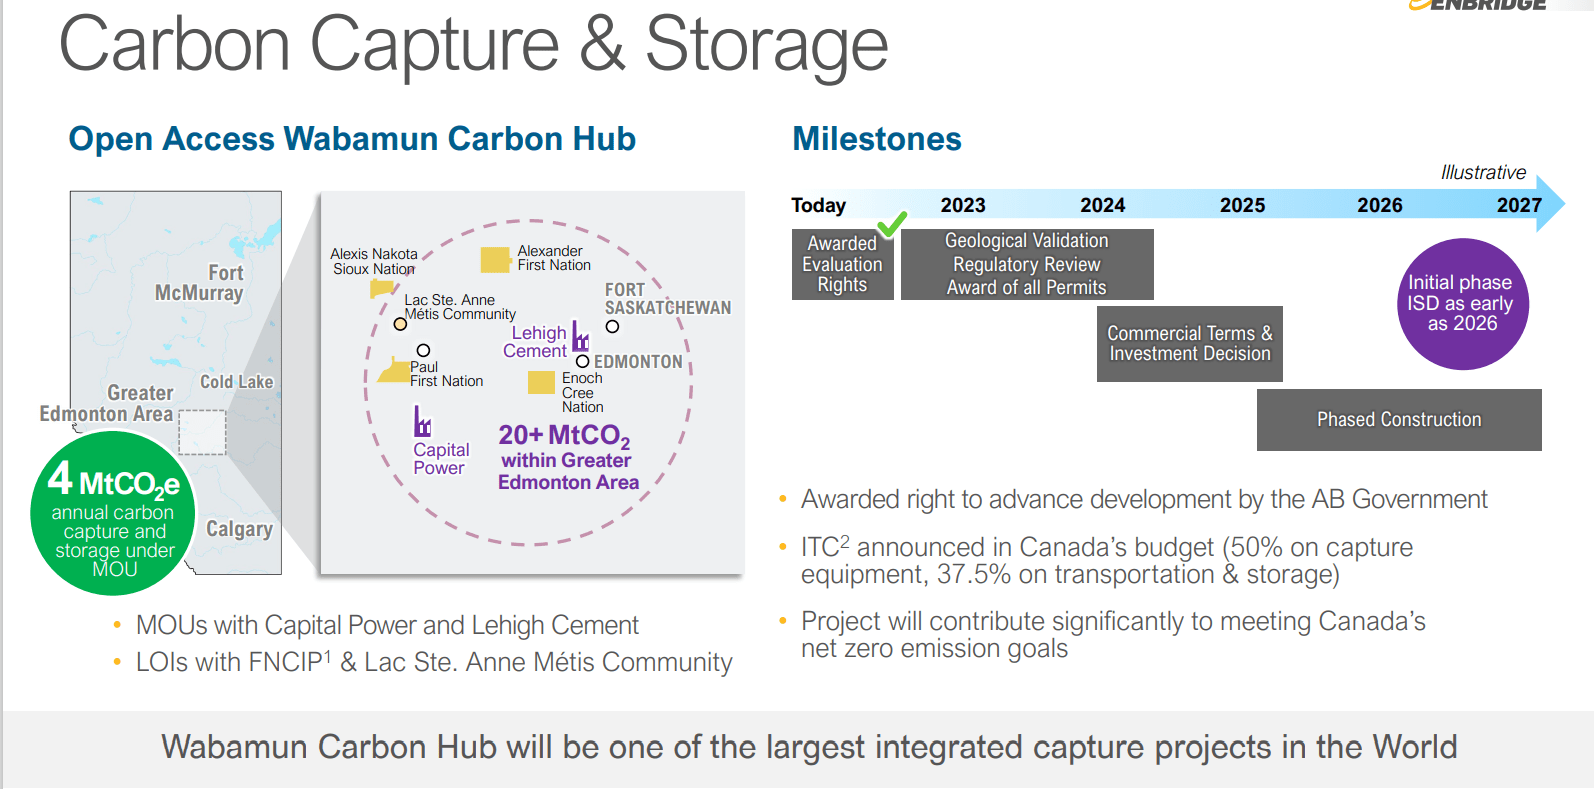
ENB is building one of the world’s largest carbon capture and storage facilities, which is expected to start going online in 2026.
- it will pump CO2 back into the ground
Investor Presentation
Right now, green energy is just 4% of ENB’s business, but eventually, management plans to ramp that up so that ENB can keep growing at 5% to 7% for decades.
Investor Presentation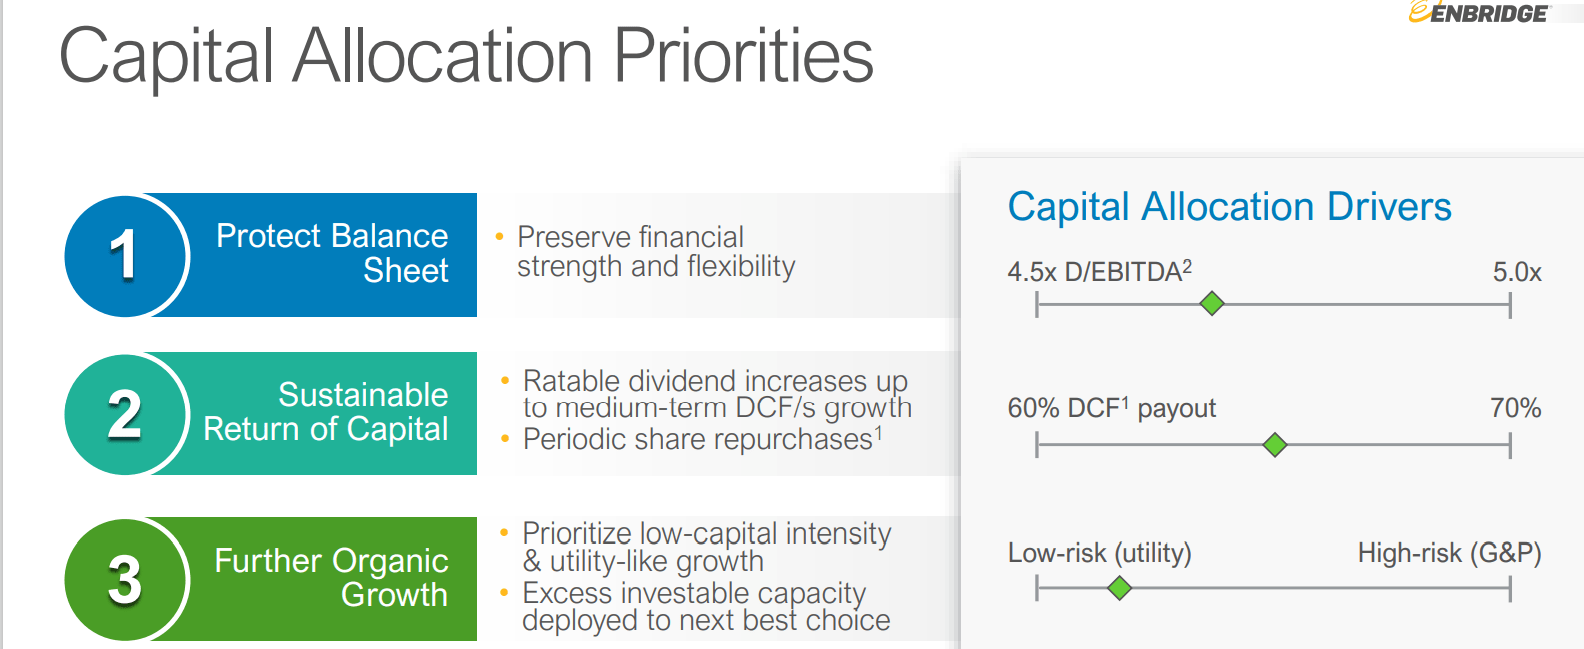
Rating agencies consider 5.0X or less debt/EBITDA a safe leverage ratio for this industry. Management plans to keep leverage at 4.5X to 5X and maintain a 60% to 70% distributable cash flow payout ratio over time.
Today it’s 65%, and ENB is focused almost exclusively on low-risk utility-like projects.
Investor Presentation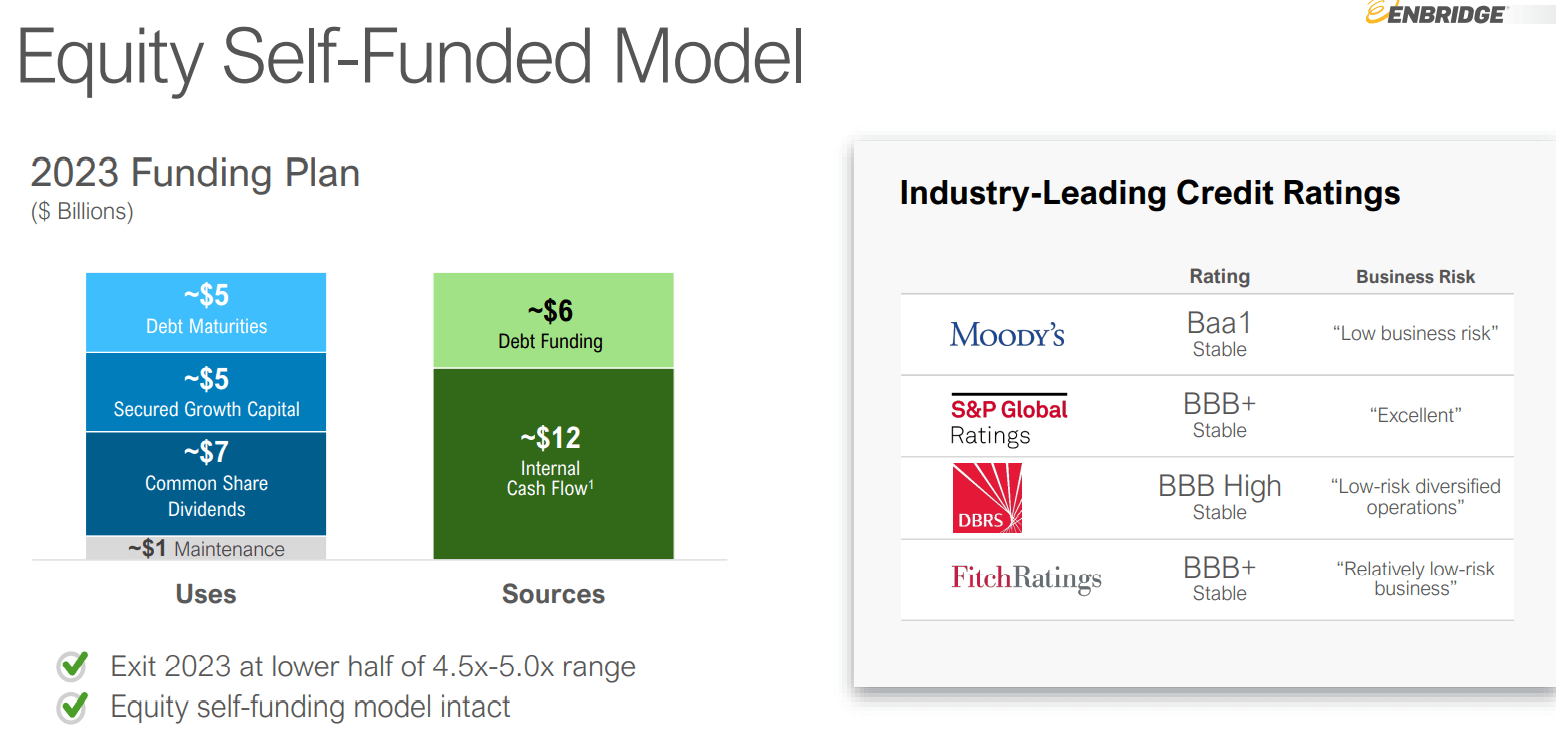
The rating agencies all rate ENB BBB+ stable or its equivalent and consider it a low-risk business model with excellent risk management.
- 5% 30-year bankruptcy risk
- tied for the best credit rating in the industry
- the best risk management in the industry (96th percentile among all companies according to S&P)
Investor Presentation
ENB’s growth plans are 100% independent of the stock price, as it’s a self-funding midstream.
Enbridge: Free Cash Flow Self-Funding
| Year | Distributable Cash Flow | Free Cash Flow | Dividends | DCF Payout Ratio | FCF Payout Ratio | Dividend/Share |
| 2022 | $8,165.0 | $7,107.75 | $5,204.25 | 63.7% | 73.2% | $2.57 |
| 2023 | $8,318.0 | $7,512.75 | $5,386.50 | 64.8% | 71.7% | $2.66 |
| 2024 | $8,358.0 | $7,857.00 | $5,548.50 | 66.4% | 70.6% | $2.74 |
| Annual Growth | 0.78% | 3.40% | 2.16% | 1.37% | -1.20% | 2.16% |
(Source: FactSet Research Terminal)
ENB isn’t just offering a sustainable and very safe dividend; it’s also self-funding all its growth and retaining 30% of free cash flow each year to invest in things like buybacks, acquisitions, and paying down debt.
- most utilities aren’t free cash flow self-funding
- but the best midstreams are
- and ENB is the highest-quality midstream of all
Investor Presentation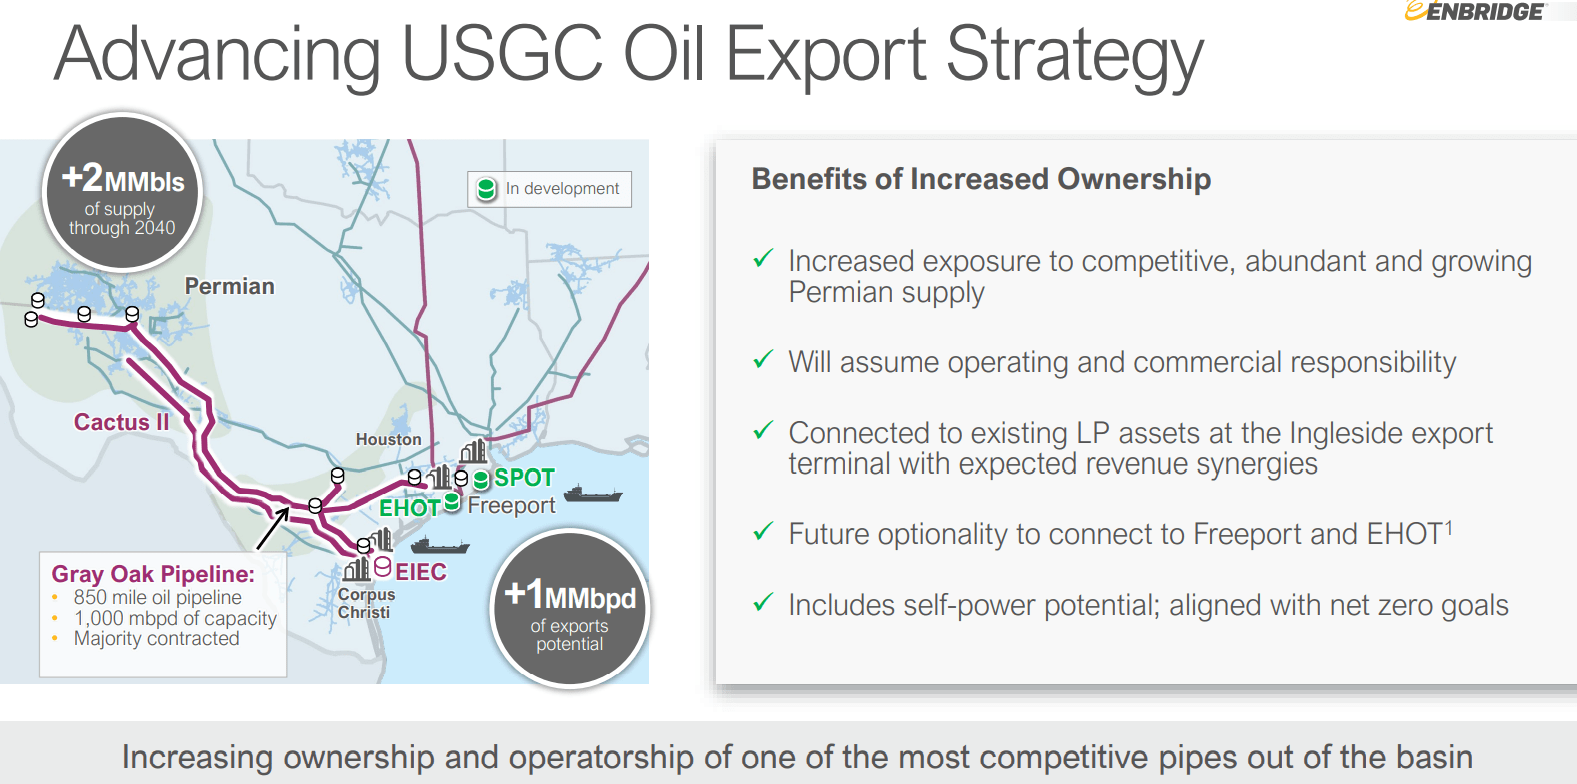
ENB completed an asset swap with Phillips 66 in 2022, giving it 60% ownership of the Gray Oak Pipeline. This will give ENB 1 million barrels/day of oil export capacity.
- US oil exports are expected to boom now that Europe needs to become energy independent from Russia.
Investor Presentation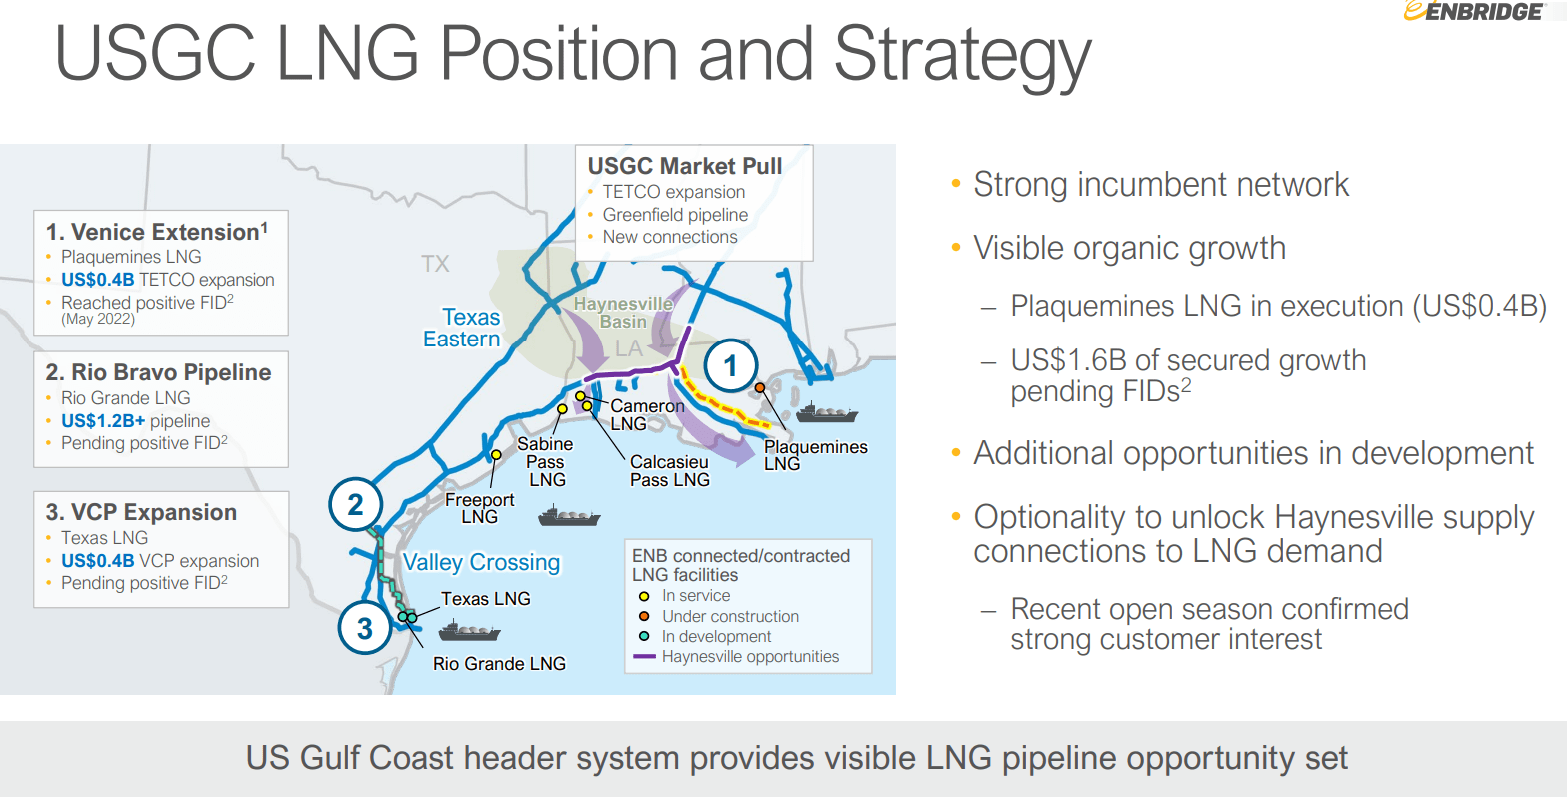
ENB is planning on investing $1.6 billion in liquified natural gas export capacity, something Europe can’t get enough of.
Investor Presentation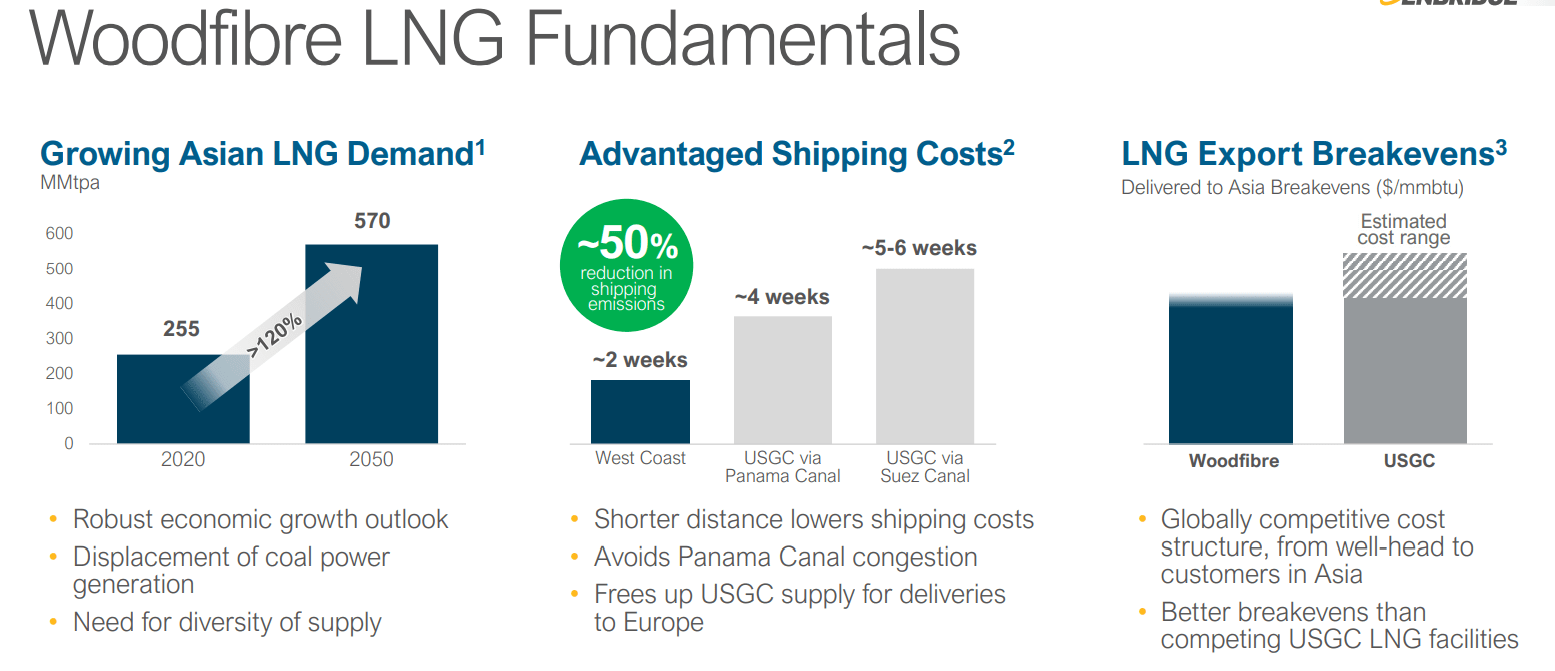
Over the next 30 years, Asian demand for LNG is expected to grow 120%. ENB’s facility is expected to offer a low-cost solution, with deliveries arriving 3X faster than the Suez Canal and 2X as fast as the Panama Canal.
Investor Presentation
What about ENB’s industry-leading renewable portfolio? That’s slated to grow to about 7GW of capacity within a few years.
- Enough to power 5.25 million homes
Investor Presentation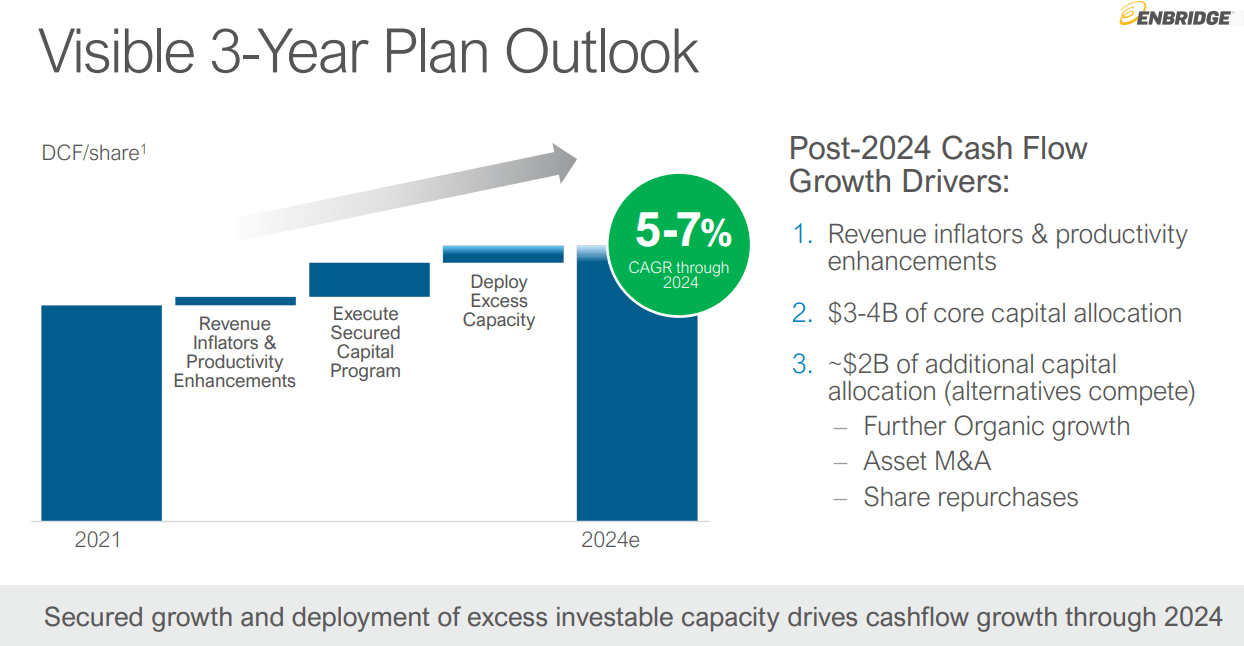
Management believes it has a clear path to about 6% growth through 2024 and a growth runway that could extend that out for decades.
The bottom line is that ENB might not be the most impressive midstream in terms of yield or growth, but if you’re looking for the safest high-yield source in this industry for the next 50+ years, ENB is the best option.
Reason Two: Steady Growth Prospects For Decades To Come
In the short-term, ENB isn’t expected to grow very quickly.
| Metric | 2022 Growth Consensus | 2023 Growth Consensus | 2024 Growth Consensus | 2025 Growth Consensus | 2026 Growth Consensus |
2027 Growth Consensus |
| Sales | 4% | 2% | -2% | -8% (Data Artifact) | NA | NA |
| Dividend | 3% | 4% | 3% | 2% | 3% | 13% |
| Operating Cash Flow | 3% | 13% | 0% | 0% | NA | NA |
| Distributable Cash Flow | 3% | 2% | 1% | 1% | 5% | 5% |
| EBITDA | 27% | 5% | 2% | 0% | NA | NA |
| EBIT (operating income) | 39% | 7% | 1% | NA | NA | NA |
(Source: FAST Graphs, FactSet)
Based on its current growth backlog, analysts expect 5% growth to begin around 2026.
But the dividend is expected to grow steadily, achieving a 33-year dividend growth streak in 2027.
Enbridge Long-Term Growth Outlook
FactSet Research Terminal
Twenty-three analysts expect ENB to grow about 5% over time, the low end of management’s guidance.
FAST Graphs, FactSet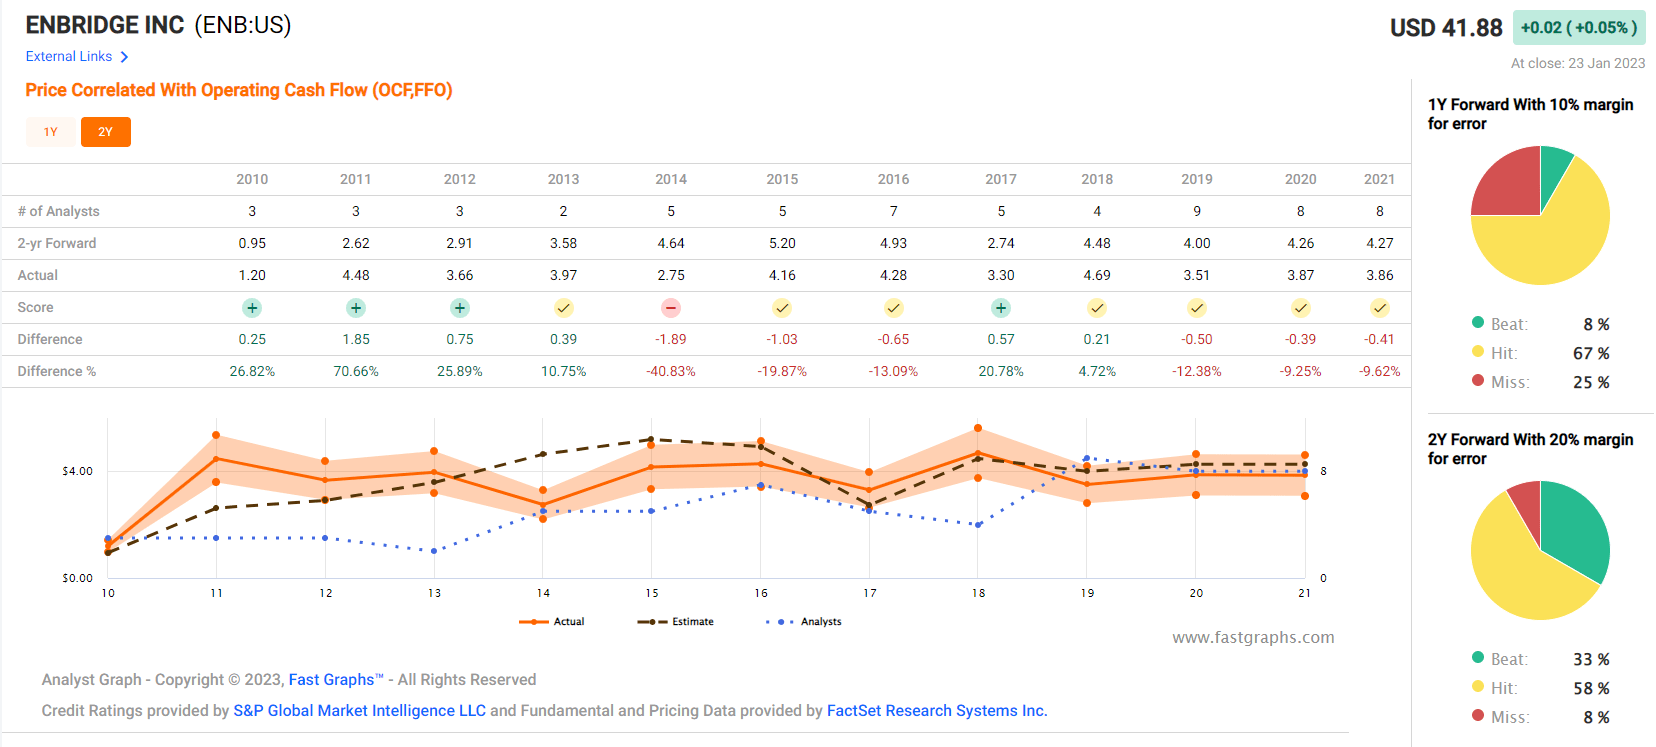
Smoothing for outliers ENB’s analyst margins-of-error are 5% to the downside and 15% to the upside.
- 4% to 7% CAGR margin-of-error adjusted growth consensus range
Consensus Long-Term Return Potential
| Investment Strategy | Yield | LT Consensus Growth | LT Consensus Total Return Potential | Long-Term Risk-Adjusted Expected Return |
| Enbridge | 6.3% | 4.9% | 11.2% | 7.8% |
| REITs | 3.9% | 6.1% | 10.0% | 7.0% |
| Schwab US Dividend Equity ETF | 3.4% | 8.6% | 12.0% | 8.4% |
| 60/40 Retirement Portfolio | 2.1% | 5.1% | 7.2% | 5.0% |
| Vanguard Dividend Appreciation ETF | 1.9% | 10.0% | 11.9% | 8.3% |
| Dividend Aristocrats | 1.9% | 8.5% | 10.4% | 7.3% |
| S&P 500 | 1.7% | 8.5% | 10.2% | 7.1% |
| Nasdaq | 0.8% | 10.9% | 11.7% | 8.2% |
(Source: DK Research Terminal, FactSet, Morningstar)
ENB offers the potential for aristocrat and S&P beating returns but with a very safe 6.3% yield.
Inflation-Adjusted Total Return Consensus Forecast: $1,000 Initial Investment
| Time Frame (Years) | 7.9% CAGR Inflation-Adjusted S&P 500 Consensus | 8.9% CAGR Inflation-Adjusted ENB Consensus | Difference Between Inflation-Adjusted ENB Consensus And S&P Consensus |
| 5 | $1,465.25 | $1,534.39 | $69.14 |
| 10 | $2,146.96 | $2,354.36 | $207.40 |
| 15 | $3,145.84 | $3,612.52 | $466.69 |
| 20 | $4,609.44 | $5,543.03 | $933.59 |
| 25 | $6,753.99 | $8,505.19 | $1,751.21 |
| 30 (retirement time frame) | $9,896.29 | $13,050.32 | $3,154.03 |
| 35 | $14,500.55 | $20,024.33 | $5,523.78 |
| 40 | $21,246.95 | $30,725.21 | $9,478.26 |
| 45 | $31,132.11 | $47,144.57 | $16,012.46 |
| 50 | $45,616.37 | $72,338.34 | $26,721.98 |
| 55 | $66,839.43 | $110,995.51 | $44,156.07 |
| 60 (investing lifetime) | $97,936.56 | $170,310.83 | $72,374.27 |
| 100 Philanthropy time | $2,080,852.87 | $5,232,835.64 | $3,151,982.77 |
(Source: DK Research Terminal, FactSet)
Over the next 30 years, ENB could deliver 13X inflation-adjusted returns and, over an investing lifetime, 170X. Over my charitable donation time frame of 100 years, it’s a potential 5,233X real return.
| Time Frame (Years) | Ratio Inflation-Adjusted ENB Consensus vs. S&P consensus |
| 5 | 1.05 |
| 10 | 1.10 |
| 15 | 1.15 |
| 20 | 1.20 |
| 25 | 1.26 |
| 30 | 1.32 |
| 35 | 1.38 |
| 40 | 1.45 |
| 45 | 1.51 |
| 50 | 1.59 |
| 55 | 1.66 |
| 60 | 1.74 |
| 100 | 2.51 |
(Source: DK Research Terminal, FactSet)
ENB’s thesis isn’t that it will crush the S&P, but rather it will pay you 4X the dividends of the S&P and generate slightly better long-term returns.
Reason Three: A Buffett-Style Wonderful Company At A Fair Price
FAST Graphs, FactSet FAST Graphs, FactSet
Millions of income investors have paid between 10X and 12X cash flow for ENB outside of bear markets and bubbles for twenty years while it was growing at today’s rates.
- 91% statistical probability that this approximates intrinsic value
| Metric | Historical Fair Value Multiples (14-Years) | 2022 | 2023 | 2024 | 2025 |
12-Month Forward Fair Value |
| 5-Year Average Yield (Pure Industry Bear Market) | 6.51% | $39.48 | $40.40 | $40.40 | $43.01 | |
| 13-Year Median Yield | 4.48% | $57.37 | $58.71 | $58.71 | $62.50 | |
| Operating Cash Flow | 10.04 | $38.75 | $44.78 | $44.78 | $50.70 | |
| Average | $43.75 | $46.79 | $46.79 | $50.87 | $46.79 | |
| Current Price | $41.88 | |||||
|
Discount To Fair Value |
4.28% | 10.49% | 10.49% | 17.67% | 10.49% | |
|
Upside To Fair Value (Including Dividends) |
4.47% | 11.72% | 11.72% | 21.47% | 18.00% | |
| 2023 OCF | 2024 OCF | 2023 Weighted OCF | 2024 Weighted OCF | 12-Month Forward OCF | 12-Month Average Fair Value Forward P/OCF |
Current Forward P/OCF |
| $4.46 | $4.46 | $4.12 | $0.34 | $4.46 | 10.5 | 9.4 |
ENB is historically worth about 10.5X cash flow and today trades at a modest discount of 9.4X cash flow.
It offers an 18% upside to fair value.
| Rating | Margin Of Safety For Very Low-Risk 13/13 Ultra SWAN (Sleep-Well-At Night) Quality Companies | 2023 Fair Value Price | 2024 Fair Value Price | 12-Month Forward Fair Value |
| Potentially Reasonable Buy | 0% | $46.79 | $46.79 | $46.79 |
| Potentially Good Buy | 5% | $44.45 | $44.45 | $44.45 |
| Potentially Strong Buy | 15% | $39.77 | $39.77 | $39.77 |
| Potentially Very Strong Buy | 25% | $33.34 | $35.09 | $35.09 |
| Potentially Ultra-Value Buy | 35% | $30.41 | $30.41 | $30.41 |
| Currently | $41.88 | 10.49% | 10.49% | 10.49% |
| Upside To Fair Value (Including Dividends) | 18.00% | 18.00% | 18.00% |
ENB is a potentially good buy for anyone comfortable with its risk profile.
Risk Profile: Why Enbridge Isn’t Right For Everyone
There are no risk-free companies, and no company is right for everyone. You have to be comfortable with the fundamental risk profile.
ENB’s Risk Profile Includes
- economic cyclicality risk: modest cash flow variability in recessions (up to 19% but larger in oil crashes)
- M&A execution risk: from future industry consolidation
- regulatory risk: specifically for new project approvals (Keystone XL is a good example of what can go wrong)
- failure of the green energy transition plan
- talent retention risk in the tightest job market in 50 years
- cyber-security risk: hackers and ransomware (Colonial pipeline hack is an example of what can happen)
- currency risk: including the dividend
How do we quantify, monitor, and track such a complex risk profile? By doing what big institutions do.
Long-Term Risk Management Analysis: How Large Institutions Measure Total Risk Management
DK uses S&P Global’s global long-term risk-management ratings for our risk rating.
- S&P has spent over 20 years perfecting their risk model
- which is based on over 30 major risk categories, over 130 subcategories, and 1,000 individual metrics
- 50% of metrics are industry specific
- this risk rating has been included in every credit rating for decades
The DK risk rating is based on the global percentile of how a company’s risk management compares to 8,000 S&P-rated companies covering 90% of the world’s market cap.
ENB scores 96th Percentile On Global Long-Term Risk Management
S&P’s risk management scores factor in things like:
- supply chain management
- crisis management
- cyber-security
- privacy protection
- efficiency
- R&D efficiency
- innovation management
- labor relations
- talent retention
- worker training/skills improvement
- occupational health & safety
- customer relationship management
- business ethics
- climate strategy adaptation
- sustainable agricultural practices
- corporate governance
- brand management
ENB’s Long-Term Risk Management Is The 33rd Best In The Master List 93rd Percentile In The Master List
| Classification | S&P LT Risk-Management Global Percentile |
Risk-Management Interpretation |
Risk-Management Rating |
| BTI, ILMN, SIEGY, SPGI, WM, CI, CSCO, WMB, SAP, CL | 100 | Exceptional (Top 80 companies in the world) | Very Low Risk |
| Enbridge | 96 |
Exceptional |
Very Low Risk |
| Strong ESG Stocks | 86 |
Very Good |
Very Low Risk |
| Foreign Dividend Stocks | 77 |
Good, Bordering On Very Good |
Low Risk |
| Ultra-SWANs | 74 | Good | Low Risk |
| Dividend Aristocrats | 67 | Above-Average (Bordering On Good) | Low Risk |
| Low Volatility Stocks | 65 | Above-Average | Low Risk |
| Master List average | 61 | Above-Average | Low Risk |
| Dividend Kings | 60 | Above-Average | Low Risk |
| Hyper-Growth stocks | 59 | Average, Bordering On Above-Average | Medium Risk |
| Dividend Champions | 55 | Average | Medium Risk |
| Monthly Dividend Stocks | 41 | Average | Medium Risk |
(Source: DK Research Terminal)
ENB’s risk-management consensus is in the top 7% of the world’s best blue chips and is similar to:
- Ecolab (ECL): Super SWAN aristocrat
- UnitedHealth Group (UNH): Ultra SWAN
- Microsoft (MSFT): Ultra SWAN
- Canadian National Railway (CNI): Ultra SWAN aristocrat
- Lockheed Martin (LMT): Ultra SWAN
The bottom line is that all companies have risks, and ENB is exceptional, at managing theirs, according to S&P.
How We Monitor ENB’s Risk Profile
- 23 analysts
- four credit rating agencies
- 27 experts who collectively know this business better than anyone other than management
- and the bond market for real-time fundamental risk assessment
When the facts change, I change my mind. What do you do, sir?” – John Maynard Keynes
There are no sacred cows at iREIT or Dividend Kings. Wherever the fundamentals lead, we always follow. That’s the essence of disciplined financial science, the math behind retiring rich and staying rich in retirement.
Bottom Line: This 6.3% Yielding Dividend Aristocrat Could Possibly Change Your Life
Let me be clear: I’m NOT calling the bottom in ENB (I’m not a market-timer).
Ultra-SWAN quality does NOT mean “can’t fall hard and fast in a bear market.”
Fundamentals are all that determine safety and quality, and my recommendations.
- over 30+ years, 97% of stock returns are a function of pure fundamentals, not luck
- in the short term; luck is 25X as powerful as fundamentals
- in the long term, fundamentals are 33X as powerful as luck
While I can’t predict the market in the short term, here’s what I can tell you about ENB.
- the highest quality midstream on Wall Street
- the only dividend aristocrat in the industry
- potentially very safe 6.3% yield (4X the S&P, growing around 5% long-term)
- 11.2% long-term return potential Vs. 10.2% S&P
- 10% historically undervalued
- 9.4X cash flow compared to 10X to 12X historically
- 70% consensus return potential over the next five years, 11% annually, and 50% more than the S&P 500
- 3.5X more income potential than the S&P over the next five years
Is ENB the highest-yielding blue-chip midstream? No, that would be MPLX.
Is it the fastest growing? No, that would be OKE.
Is it the most undervalued? No, that would be NFG.
But it is the highest quality midstream and my personal favorite.
That’s why my family hedge fund has ENB as one of our largest positions, and we always plan to own a significant amount.
Why? Because ENB is not just the highest quality midstream, it has the best risk management and a green energy transition plan so good the bond market is willing to lend ENB money for nearly 100 years.
So if you want a very safe 6.3% yield today and a true “buy and hold forever” midstream blue-chip that can potentially change your life, there is no better choice than ENB.
Be the first to comment