

remco86
Total returns. One would think this would be the primary concept investors focus on. But in this yield chasing environment, there appears to be a dearth of this angle. We first talked about Global X Russell 2000 Covered Call ETF (NYSEARCA:RYLD) a few weeks back and went over some basic concepts on the ETF. We want to expand that thinking a little further today and get investors to focus on what is really important.
The Yield
RYLD’s yield is adjusted on a monthly basis, so depending on how things are calculated (forward or trailing 12 months) different sites will give you different numbers. Nonetheless, those numbers are extremely high. Here is one from YCharts.
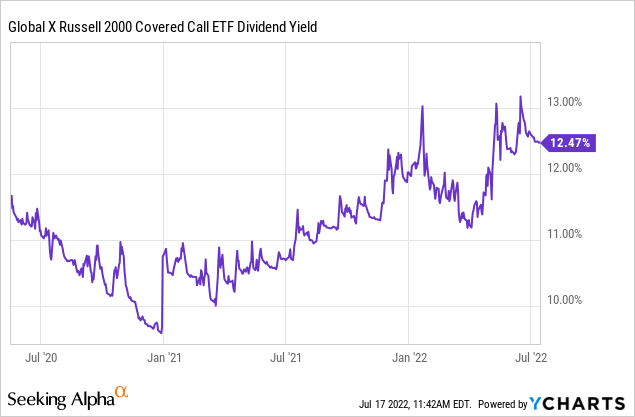
Seeking Alpha has this at 13.95%.
Seeking Alpha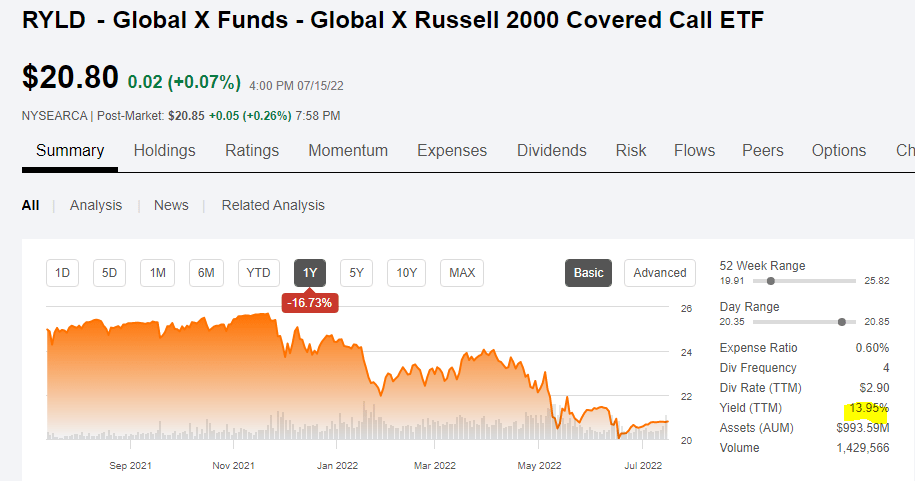
This of course creates the allure of “why not get paid 13% to invest?”.
Generating That Yield
Covered Calls rely on selling calls on long positions. You give up upside in return for premiums. Those facts are well known. What is not well known is that the “blind” index strategy does not ever deliver scintillating returns (See The Returns Of The Jedi). We can look at this a couple of different ways. The first is to just run what RYLD has done since it has been in existence. Rather than using the standard chart which YCharts or most total return websites show, we will be using the data from Buy Upside.
The data below is a bit busy but we want to focus on the “without” part as that is what most people looking for a monster yield are getting. They spend the dividends rather than reinvest.
Buy Upside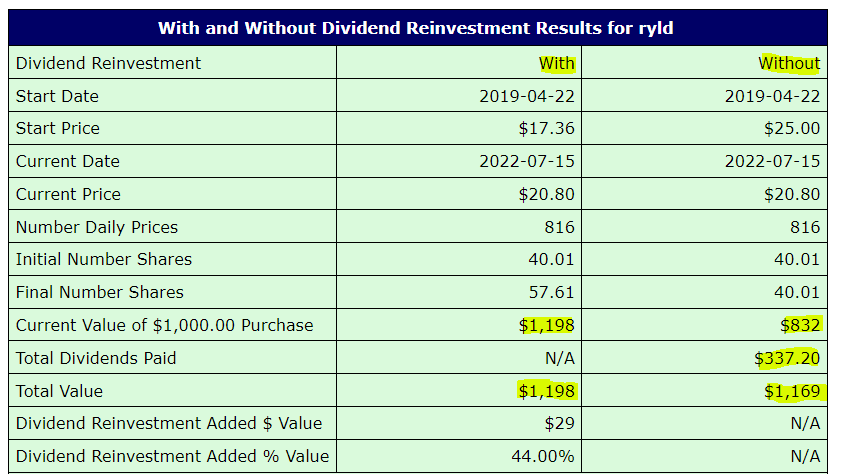
At $169 total return over 3 years 3 months for $1,000 invested, RYLD has managed about 5% compounded since inception. That is a pretty huge contrast to the 13% dividends coming your way. The Russell 2000 Index (IWM) would have given you $1,158 without dividend reinvestment, although the difference between with and without is a rounding error.
Buy Upside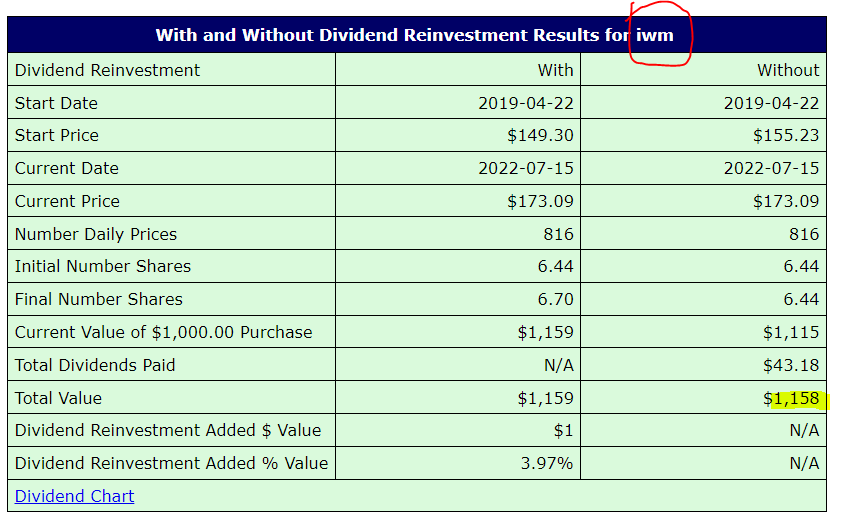
So there has been some outperformance, but one needs to understand that these are minor amounts and investors are eating up their principal if they consume the entire payout.
What Does The Long Term Look Like?
CBOE has a covered call Russell 2000 index and the data there is very useful to forecast forward returns. The Russell Buy-Write Index is at 321.85 today and we would like investors to note the value on May 2011 at 158.90.
CBOE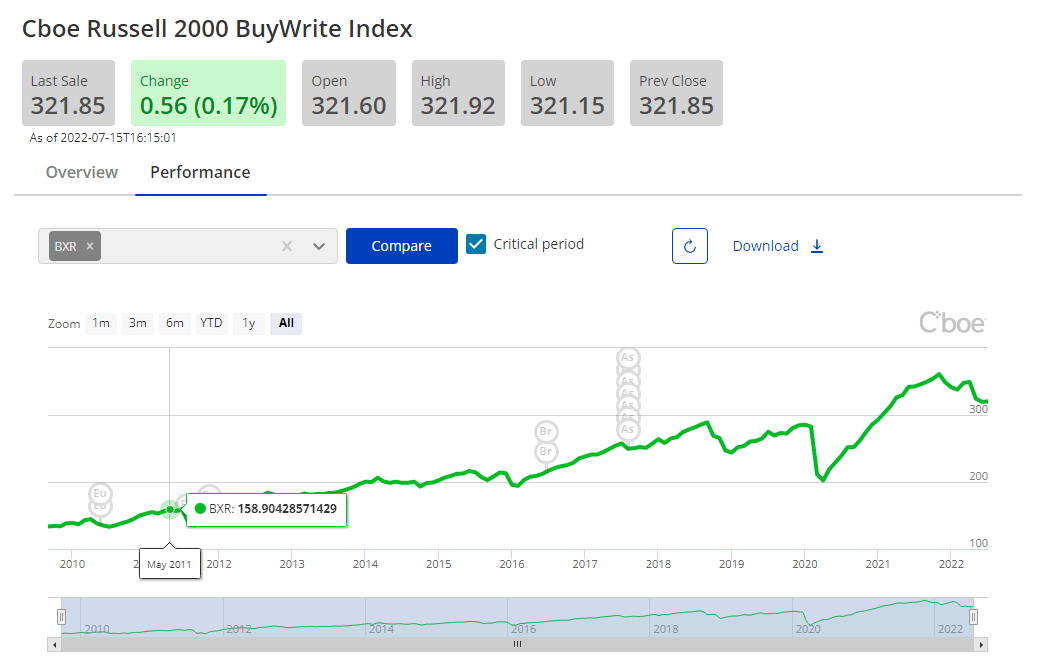
We are highlighting that to make some easy calculations as most people are aware of the rule of 72. That is the time required to double an investment (in years) at a certain return is equal to 72/return. So at 10% you would require 7.2 years to double your investment. Considering May 2011 is about 11.2 years back and the index was about half the value of today your return was about 6.4% (72/11.2) compounded. Of course different time frames will create different returns. Our point here was that in what was a really good bull market, the buy write index delivered about half the current distribution in total returns.
Now the good news here is that small cap stocks are getting relatively cheap when you benchmark vs historical valuations.
Bank Of America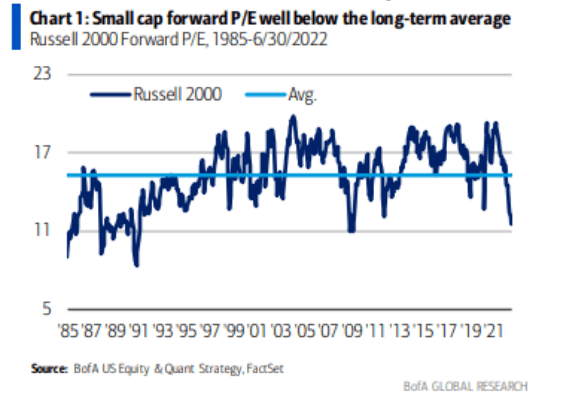
So RYLD at this point has an edge versus what it has done in the past. This edge also extends to a relative valuation vs the large cap peers.
Bank Of America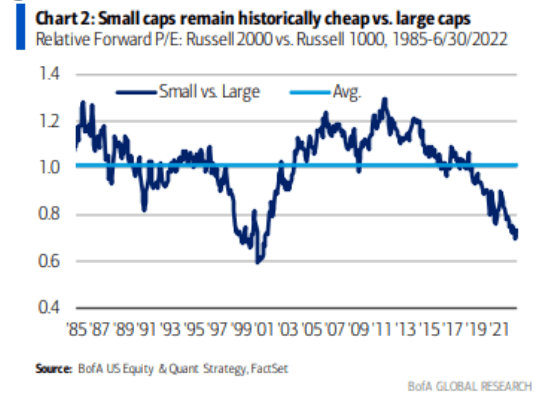
This is counterbalanced to some extent by the fact that those P/E ratios are only calculated on profitable firms, and the percentage of unprofitable firms is near an all time high.
Michael Krantrowritz, CFA-Twitter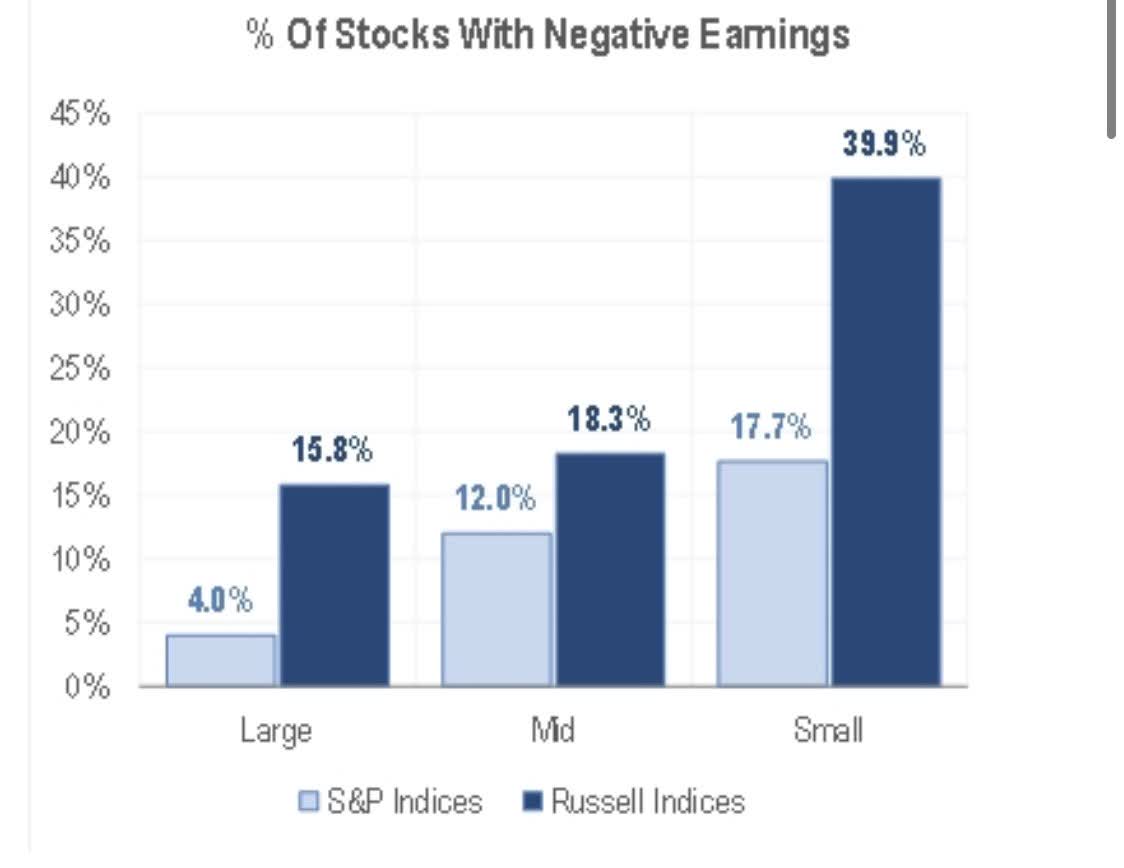
Overall, we think this (small cap) area of the market is ripe for finding quality at a reasonable price, but the index has too much junk in the trunk.
Verdict
RYLD has generated returns that are very similar to that of IWM. Those holding this fund in a taxable account likely did worse than IWM. The fund makes more sense today than it did previously, as the indices have been beaten down. Valuations are still challenging for the market and this is not really reflected in the index P/E ratios. The P/E ratios exclude unprofitable firms and the earnings are also bloated from extraordinary stimulus money and low interest rates. All said and done, we think 5% annual total returns are more probable than 13%.
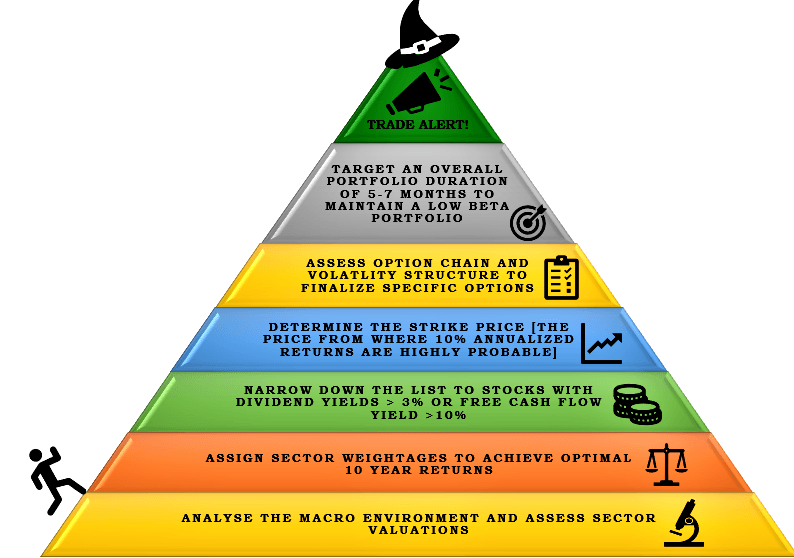
Bearish investors are likely to find this defensive fund more to their liking as the call premiums insulate them from big drawdowns. As mentioned previously, we like to follow our own method which relies on a top-down approach to find favorable sectors and stocks, before we start writing covered calls. But for those wanting small cap index exposure, we think RYLD makes sense over IWM.
Please note that this is not financial advice. It may seem like it, sound like it, but surprisingly, it is not. Investors are expected to do their own due diligence and consult with a professional who knows their objectives and constraints.
Be the first to comment