

designer491
This article was coproduced with Williams Equity Research (“WER”)
As many of my readers and followers know, I’m known for being a REIT guru in which my team and I covers a wide spectrum of property sectors including apartments, retail (mall & shopping centers), net lease, industrial, data centers, cell towers, healthcare, office, and even cannabis.
In addition, our team of analysts also cover (and research) commercial mREITs such as Blackstone Mortgage (BXMT), Starwood Property Trust (STWD), KKR Real Estate (KREF), Ladder Capital (LADR), and Sachem Capital (SACH).
Note: I interviewed SACH’s Chief Credit Officer last week at iREIT on Alpha.
In addition, we recently added Asset Managers and Homebuilders to our suite of products, recognizing that these asset classes are complementary categories for investors to participate in the recovery that we believe will take place during the upcoming recession…
That’s right, we’re super bullish right now in the midst of this bear market, simply because we know that the upcoming recession will serve as a catalyst that will ignite super-sized total returns.
Recognizing that income is an essential element to our intelligent investing philosophy, we decided to also cover (and recommend) BDCs – business development companies – that are very logically correlated to our REIT coverage spectrum.
Recognizing that most all retirees are focused on income, it just stands to reason that BDCs can serve as yield enhancers, while also generating significant alpha.
Now, let me show you why retirees should own BDCs…
BDCs In A Nutshell
Business development companies (“BDCs”) generally invest in small- and medium-sized private companies domiciled in the U.S. These investments take different forms with some BDCs exclusively focused in first lien senior secured loans with others also investing in the equity of their portfolio companies.
Like Real Estate Investment Trusts (“REITs”), BDCs were created by the U.S. Congress to help certain parts of the economy. In the case of BDCs, the 1980 legislation was designed to assist small and medium-sized businesses.
In practice, these are almost always private companies as those listed on exchanges tend to have access to cheaper forms of capital than BDCs provide.
Also like REITs, BDCs are part of a tax structure that enables the company to avoid corporate level taxation (they must meet certain requirements to achieve this favorable tax status).
This means significantly higher pre-tax dividend yields compared to other income investments, which are particularly powerful when held in a retirement account. Dividends in taxable accounts are taxed at ordinary income rates but there are various laws in place that reduce that burden for most investors.
BDCs must follow rules to maintain their beneficial tax status.
First, BDCs must meet strict diversification rules that limit the concentration of any one company’s securities to a small part of the portfolio.
Second, at least 70% of investments must be in U.S. companies.
Lastly, the same percentage must be in companies with market values of less than $250 million.
BDCs must offer guidance to their portfolio companies as well. Most don’t mind that one and prefer to closely monitor their portfolio companies’ activities and key decisions.
The Horizon To Prepare For
What about the current and projected economic environment do we need to be concerned about? There is risk in every market, but sometimes those risks are easier to identify.
I think we can agree on three issues: inflation, interest rates, and recession risk.
Inflation
worlddatainfo.com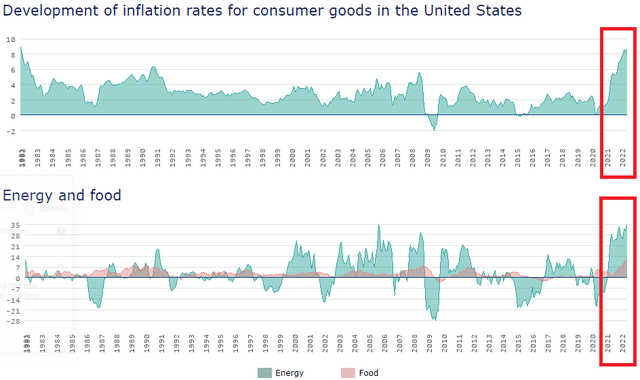
The above charts show the U.S. inflation rate of consumer goods and energy and food over the past 42 years. I put the last year and a half in red boxes. We are either tied with 42-year highs in these categories or making new highs. These elements of the economy hit the consumer right in the gut and bank account on a daily basis.
Economic Policy Institute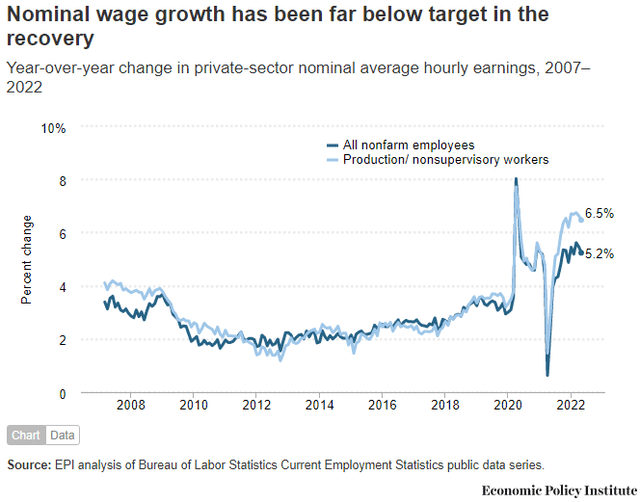
Wages saw a decent increase in the past year or so, but wage growth has been 30-50% slower than recent inflation rates. As you’d expect, that means consumer buying power is declining in real terms.
Interest Rates
In the developed world, institutions attempt to set benchmark interest rates rather than letting the market determine them. This does exactly what anyone familiar with bureaucrats would anticipate: delayed, disorganized responses and decisions involving their own self-interests.
A practical and timely example of this is interest rate policy of the last decade in the U.S. and much of Europe.
tradingeconomics.com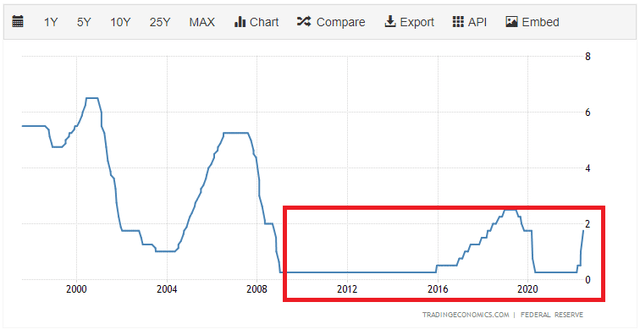
Outside of a small reprieve a few years ago, the federal funds rate was effectively zero for most of the past 15 years.
datalab.usaspending.gov/americas-finance-guide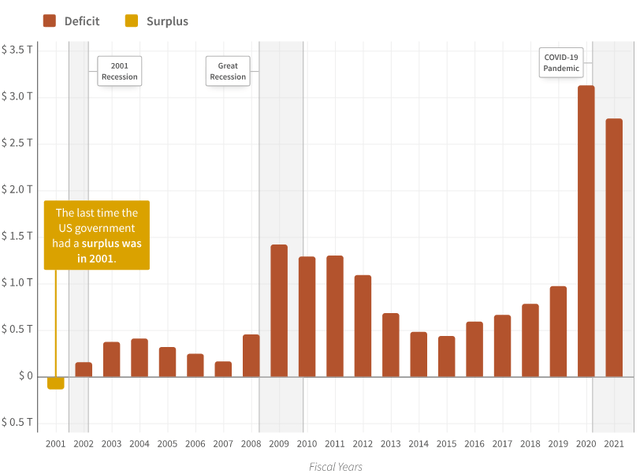
After the government deficits of the past two years doubled any previous imbalance, the Federal Reserve decided to try to outdo the spending of our loyal representatives in D.C.
Federal Reserve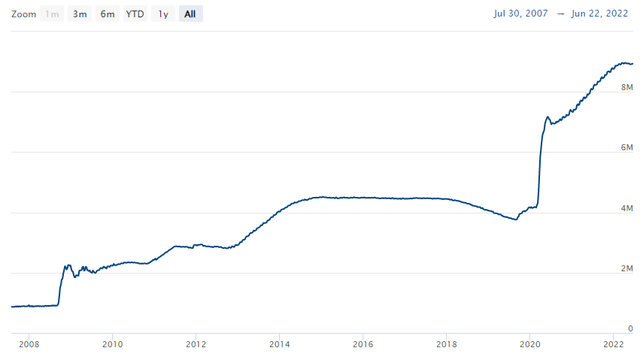
With annual U.S. deficits exceeding $2.5 trillion and the Federal Reserve’s official balance sheet holdings doubling in the past two years to approximately $9 trillion, holding benchmark interest rates at zero was no longer feasible. The recent spike in inflation has multiple causes, but these are certainly among them.
The ~2% anticipated move in base interest rates might not seem impactful, and understandably so, but the pace is problematic. In many real estate markets for example, commercial loans went from 4-5% for medium-term debt to 6-7% almost overnight.
Prior to the increase, an asset yielding 7-8% could generate a reliable 9-10% yield with conservative 50% leverage. With the recent change in rates, it no longer makes sense to apply leverage. That same asset, despite nothing else changing, is worth a heck of a lot less.
As someone active in that arena, I know firsthand that many large lenders saw their pipeline decline by 50-90% as a result of pricing in the two rate hikes. This will normalize over time but was a shock to the system.
Our opinion on the soundness of those business models or any other factor aside, this is an undisputed major hit to economic activity.
Asset prices will need to decline 10-15% at minimum to offset the increase in rates, with businesses and real assets able to pass on inflationary pressures the only exception. That leads us to our final chief risk.
Recession
I’ve noticed a lot of people, including savvy, smart ones, suddenly relying on assessments from firms like Goldman Sachs (GS) and JPMorgan (JPM) to gauge recession risk and timeline. This isn’t rationale.
None of these firms, and I am not exaggerating, predicted previous recessions with any reliability. At best, they said there was a 50% probability of a recession when the recession was already occurring.
These guesses, which is what they are, are as reliable and useful as when the same Wall Street firms say where the S&P 500 will be in 1, 3, or 5 years. If they are right, it’s luck. Simple as that.
What we can ascertain, however, is that common sense tells us that declining consumer buying power in real terms, coupled with a completely mismanaged federal government (from at least a financial perspective) and a Federal Reserve that is way behind the curve (no pun intended) in its fight against inflation, means a decrease in GDP in the near to medium-term is higher than it was before. Whether a technical recession occurs in 2023 or is already in progress, nobody knows with certainty.
As part of our risk management system, however, we can use an array of assumptions about what a recession will look like and see how our investments will perform operationally and financially.
Strengths Of BDCs In This Environment
With all these headwinds, what are our current expectations on how BDCs will perform over the next few years? We’ll start with the facts then draw conclusions.
The Right Investments
First, BDC portfolios consist of almost entirely floating rate loans or equity investments in portfolio companies. Some companies, like Owl Rock Capital (ORCC) and Golub Capital BDC (GSBD), focus exclusively on floating rate loans.
Others, like Main Street Capital (MAIN) and Ares Capital Corp (ARCC), maintain up to 25% of their assets in equity positions. These are often awarded at no direct cost to the BDC, but it’s reasonable to assume the BDC received a lower interest rate or permitted more flexible covenants to obtain the equity position, even if it was technically free.
The floating rate loans are tied to LIBOR or SOFR, the international interest rate benchmarks. While they will not increase in lockstep to the “real” inflation rate here in the U.S. (which is not well defined anyways), the correlation will be strong. Assuming the portfolio companies can absorb the extra interest expense, BDCs will enjoy greater income as rates rise. What about on the expense side?
ORCC May Presentation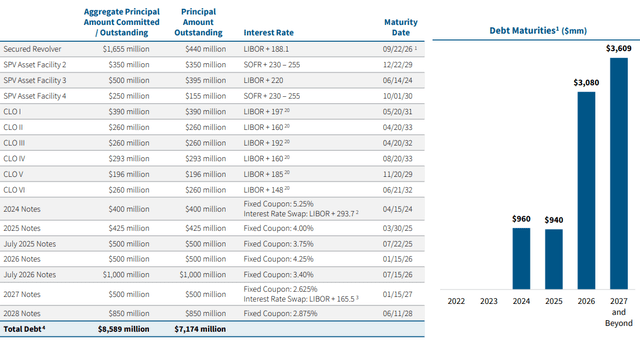
Most BDCs use leverage of approximately one-to-one debt to equity, so the floating rate loans will be accretive to the extent the BDC’s debt doesn’t also increase too much in cost. Take a look at the above chart detailing Owl Rock’s balance sheet.
As of the end of the last reporting period, Owl Rock had exactly $2.999 billion in floating rate debt outstanding on its balance sheet. It had $4.175 billion in fixed-rate obligations, meaning well over half of its debt is not subject to increases in interest rates.
Even better is the fact much of that debt doesn’t need to be refinanced until 2026. This BDC, like many in our Tier 1 category, truly is well insulated from higher rates for several years.
We can confirm this by analyzing net interest margins over time. Think of these as the spread between Owl Rock’s loan income and the expenses associated with those investments.
ORCC Q1 Presentation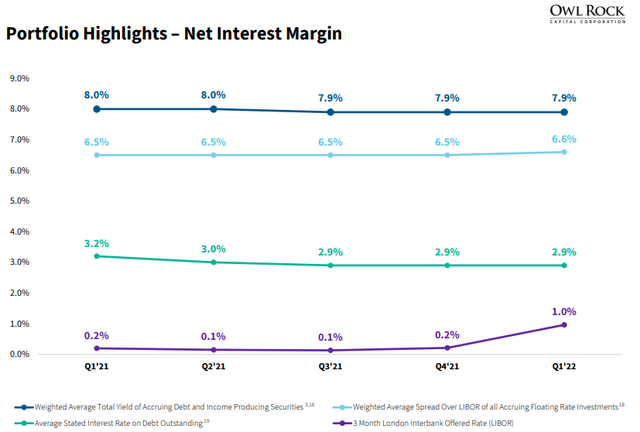
The weighted average spread of 6.6% in Q1 of this year was higher than any other recent period. That’s despite LIBOR jumping from 0.1% in Q3 of 2021 to 1.0% in Q1 of 2022.
The floating-rate investments against mostly fixed-rate liabilities creates a great machine to increase earnings as rates rise.
How common is this in the BDC space?
The bulk of investment grade rated BDCs, which include Owl Rock, Golub Capital, Main Street, Ares Capital Corp, Sixth Street Specialty Lending (TSLX), Oaktree Specialty Lending (OCSL), Blackstone Secured Lending (BXSL), and several others, generally follow the same model as described above.
Some companies, like TSLX, prefer to more closely match the structure of their assets and liabilities, and as a result, do not necessarily enjoy as much upside when rates rise. That said, we expect every single one of these BDCs to generate more cash flow per share as rates move higher, all other things equal.
A Solid Track Record
Track records always matter but understanding the drivers is even more important. Without this knowledge you’ll eventually be blindsided and probably panic sell at the exact wrong time. It has little to do with intelligence; it’s human nature to avoid uncertainty and economic loss, even at immense cost.
It doesn’t matter which Tier 1 BDC you choose; they all made it through the pandemic without suffering any major hit to their net asset value (“NAV”) or dividend. There were temporary unrealized losses that dragged down NAVs for a quarter or two, but those with a deep understanding of the accounting knew for a fact that NAVs would rapidly regain previous levels as long as losses were not reclassified.
Those who followed my work on BDCs in 2020 know exactly what I’m referring to and likely made a lot of money alongside me buying BDCs at distressed and irrational valuations. Realized losses, which are what counts in the end, were de minimis across the sector.
Not a single quality BDC cut its distribution although one or two (e.g. Golub Capital BDC) necessitated investors to participate in a rights offering to maintain their previous dividend yield. If you compare that to REITs or other categories of dividend stocks, it’s either among or the best performing sector since the initial crash in early 2020 from that perspective.
That’s not because the Board of Directors were stubborn or in denial, it’s due to the fact that cash flows were consistent throughout the pandemic. That’s not to say non-accruals didn’t spike, it’s that none of the negative developments were serious enough to permanently harm NAV or cash flow per share.
ARCC Q1 Tearsheet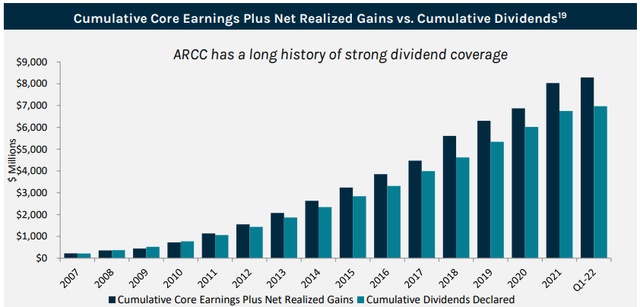
In fact, several BDCs, included ARCC shown above, recorded record cash flow per share just a couple quarters after the crash in 2020.
Not Just Diversification – Smart Diversification
Remember those diversification rules that BDCs must abide by? The good managers go well beyond the requirements. This time I’ll use Ares Capital Corp, the largest BDC by market capitalization.
ARCC Q1 Tearsheet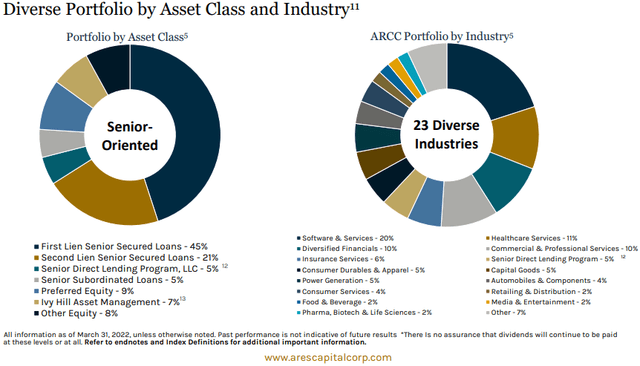
The only industry exposure over 10% was Software & Services at 20%. These include companies connected to all parts of the economy that just happen to be software centric.
Individual portfolio company exposures are in the low single-digits, and even if a company does run into trouble, most of ARCC’s loans are first or second lien and will eventually recoup ~100 cents on the dollar. If that sounds too good to be true, check out the below chart.
ARCC Q1 Tearsheet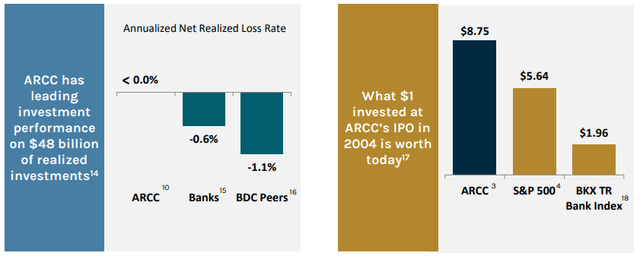
ARCC has better loan recovery rates than most banks and has generated a shareholder return since inception that dwarfs the S&P 500 over the same time period.
This excellent industry and portfolio company diversification isn’t unique to ARCC; all the top tier BDCs are constructed similarly and have comparable net realized loss performance.
Challenges
Those that have been around the investing block have learned, and often the hard way, that risks determine long-term investment outcomes as much as any other factor. The story is no different with BDCs, and that’s what we’ll cover in this section.
Weak Portfolio Companies
Let’s assume the BDC is utilizing at least some fixed-rate debt and is therefore positioned to profit from their primarily floating-rate investments. This formula only works if the portfolio companies can absorb increasing interest expense.
The primary risk here is an interest rate shock rather than a simple increase. Businesses that underwrote a 2-3% increase in borrowing rates over 2-3 years may not be able to withstand the same increase in 6-12 months. Based on real market data, the first and second 75 bps increase in rates is already fully priced in in many parts of the economy.
Most quality businesses, even those with a lot of leverage, can withstand an accelerated interest rate schedule if their business is reasonably healthy. In the event that inflation or supply chain issues hit their bottom line simultaneously, these companies may not have the ability to service increasingly costly debt. The faster rates rise, the worse this situation becomes.
This directly impacts the BDC in two ways.
First, its cash flow connected to the struggling portfolio company may decline or not rise as anticipated. That goes from “not ideal” to “seriously problematic” if the BDC itself is subject to higher interest rates on its debt.
Even a mid or low-quality BDC is going to be responsible and pay its interest expense – the loser in the equation will be investors. This is why stringent and scenario-based portfolio company underwriting is absolutely critical in periods like we are in now. Many BDCs provide average leverage ratios for their portfolio companies and that’s a good way to evaluate portfolio company level risk.
We want to be invested with managers like Ares (ARES), Golub, and Blackstone (BX) that have withstood several crises and implement those lessons into their underwriting.
The Net Interest Margin Squeeze
For BDCs that do not utilize half or more fixed-rate debt, it doesn’t take much for higher rates to equal lower cash flow. This is particularly relevant if non-accruals spike as those portfolio companies are no longer paying their interest obligations to the BDC.
One element I pay close attention to is the terms of a BDC’s debt obligations versus their loans to portfolio companies. It’s common for a revolver, for example, to have different terms than CLO debt or note offerings. The derivatives attached to each side of the balance sheet are also important; LIBOR floors on portfolio company loans can minimize declines in cash flow in the event rates retrace.
The worst outcome is when a highly leveraged BDC has mostly floating rate debt obligations (e.g. the traditional credit facility) and experiences portfolio issues, like increased non-accruals, as rates rise.
Think of this as the BDC’s interest expense rising faster than its interest income – not an ideal situation. The BDC might also experience a credit downgrade, which further stresses net interest spreads as their cost to borrow rises.
We can minimize that risk by investing in BDCs with highly diversified portfolios, mostly fixed-rate debt, reasonable leverage, and underwriting that consistently results in good loan performance. BDCs report Current Expected Credit Losses (“CECL”) in their financials and most of their SEC reports and can be a good indication of portfolio health over time.
Conclusion
In the event of a severe and extended recession, like the Great Recession, it is likely that even the best BDC will experience a notable rise in non-accruals. If that is combined with a sharp rise in interest rates, and the BDC’s debt obligations are substantial and mostly floating rate, that’s a recipe for NAV degradation and reductions in cash flow per share.
BDCs will not be the only sector in trouble in those circumstances, but that’s still a risk to consider.
If we assume a “normal” recession and rising rates, while I’d personally expect a lot of volatility in BDC share prices, actual cash flow per share is likely to be resilient and may even grow as it has for many BDCs in the past 1-2 years.
This best describes what occurred in 2020 and thereafter.
If we assume rising rates occur alongside a modest recession, BDC cash flow per share is highly likely to increase throughout the period. Note that all these scenarios assume a basket of higher quality BDCs are chosen (which is exactly what our Tier 1 classification achieves).
Lastly, if rates rise and the economy continues to perform at least reasonably well, the math isn’t complicated: BDC cash flow goes up.
We hope this has been a worthwhile review of BDC mechanics and our thoughts on how they will perform in a variety of conditions. As always, thank you for the opportunity to be of service.
Author’s Note: Brad Thomas is a Wall Street writer, which means he’s not always right with his predictions or recommendations. Since that also applies to his grammar, please excuse any typos you may find. Also, this article is free: written and distributed only to assist in research while providing a forum for second-level thinking.
Be the first to comment