

happyphoton/iStock via Getty Images
Thesis
This is an update of an earlier article I published on the Global X Russell 2000 Covered Call ETF (NYSEARCA:RYLD) back in May 2022. The main thesis at that time was summarized below:
Its covered call writing has historically produced higher yields in periods of volatility like the one that we are going through now, due to the Russian/Ukraine war and also uncertainties with inflation and treasury rates. When the market is in panic mode, the implied volatility for options will increase and in turn lead to higher income for funds like RYLD.
Indeed, at the time of that article, the volatility index (“VIX”) has hovered around a peak level of around ~36 as you can see from the following chart. To provide a reference frame, a VIX of 36 translates into the 97% percentile of historical VIX. In other words, the market volatility at that time was among the top 3% highest levels historically. Fast forward to now, the VIX has decreased to 23.2 as of this writing, corresponding to the 78% percentile historically. It is not the quietest level for sure (a VIX of 20 would be about 60% percentile), but far lower than the extreme volatility we experienced in the first half of 2022.
And the update in this article is to examine the potential impact of such milder VIX on the income generation of RYLD. And you will see that my argument is that A) I see volatility to remain at a more moderate level in the near future, and B) consequently I see muted dividend payouts growth from RYLD in the meantime.
Source: author and Yahoo data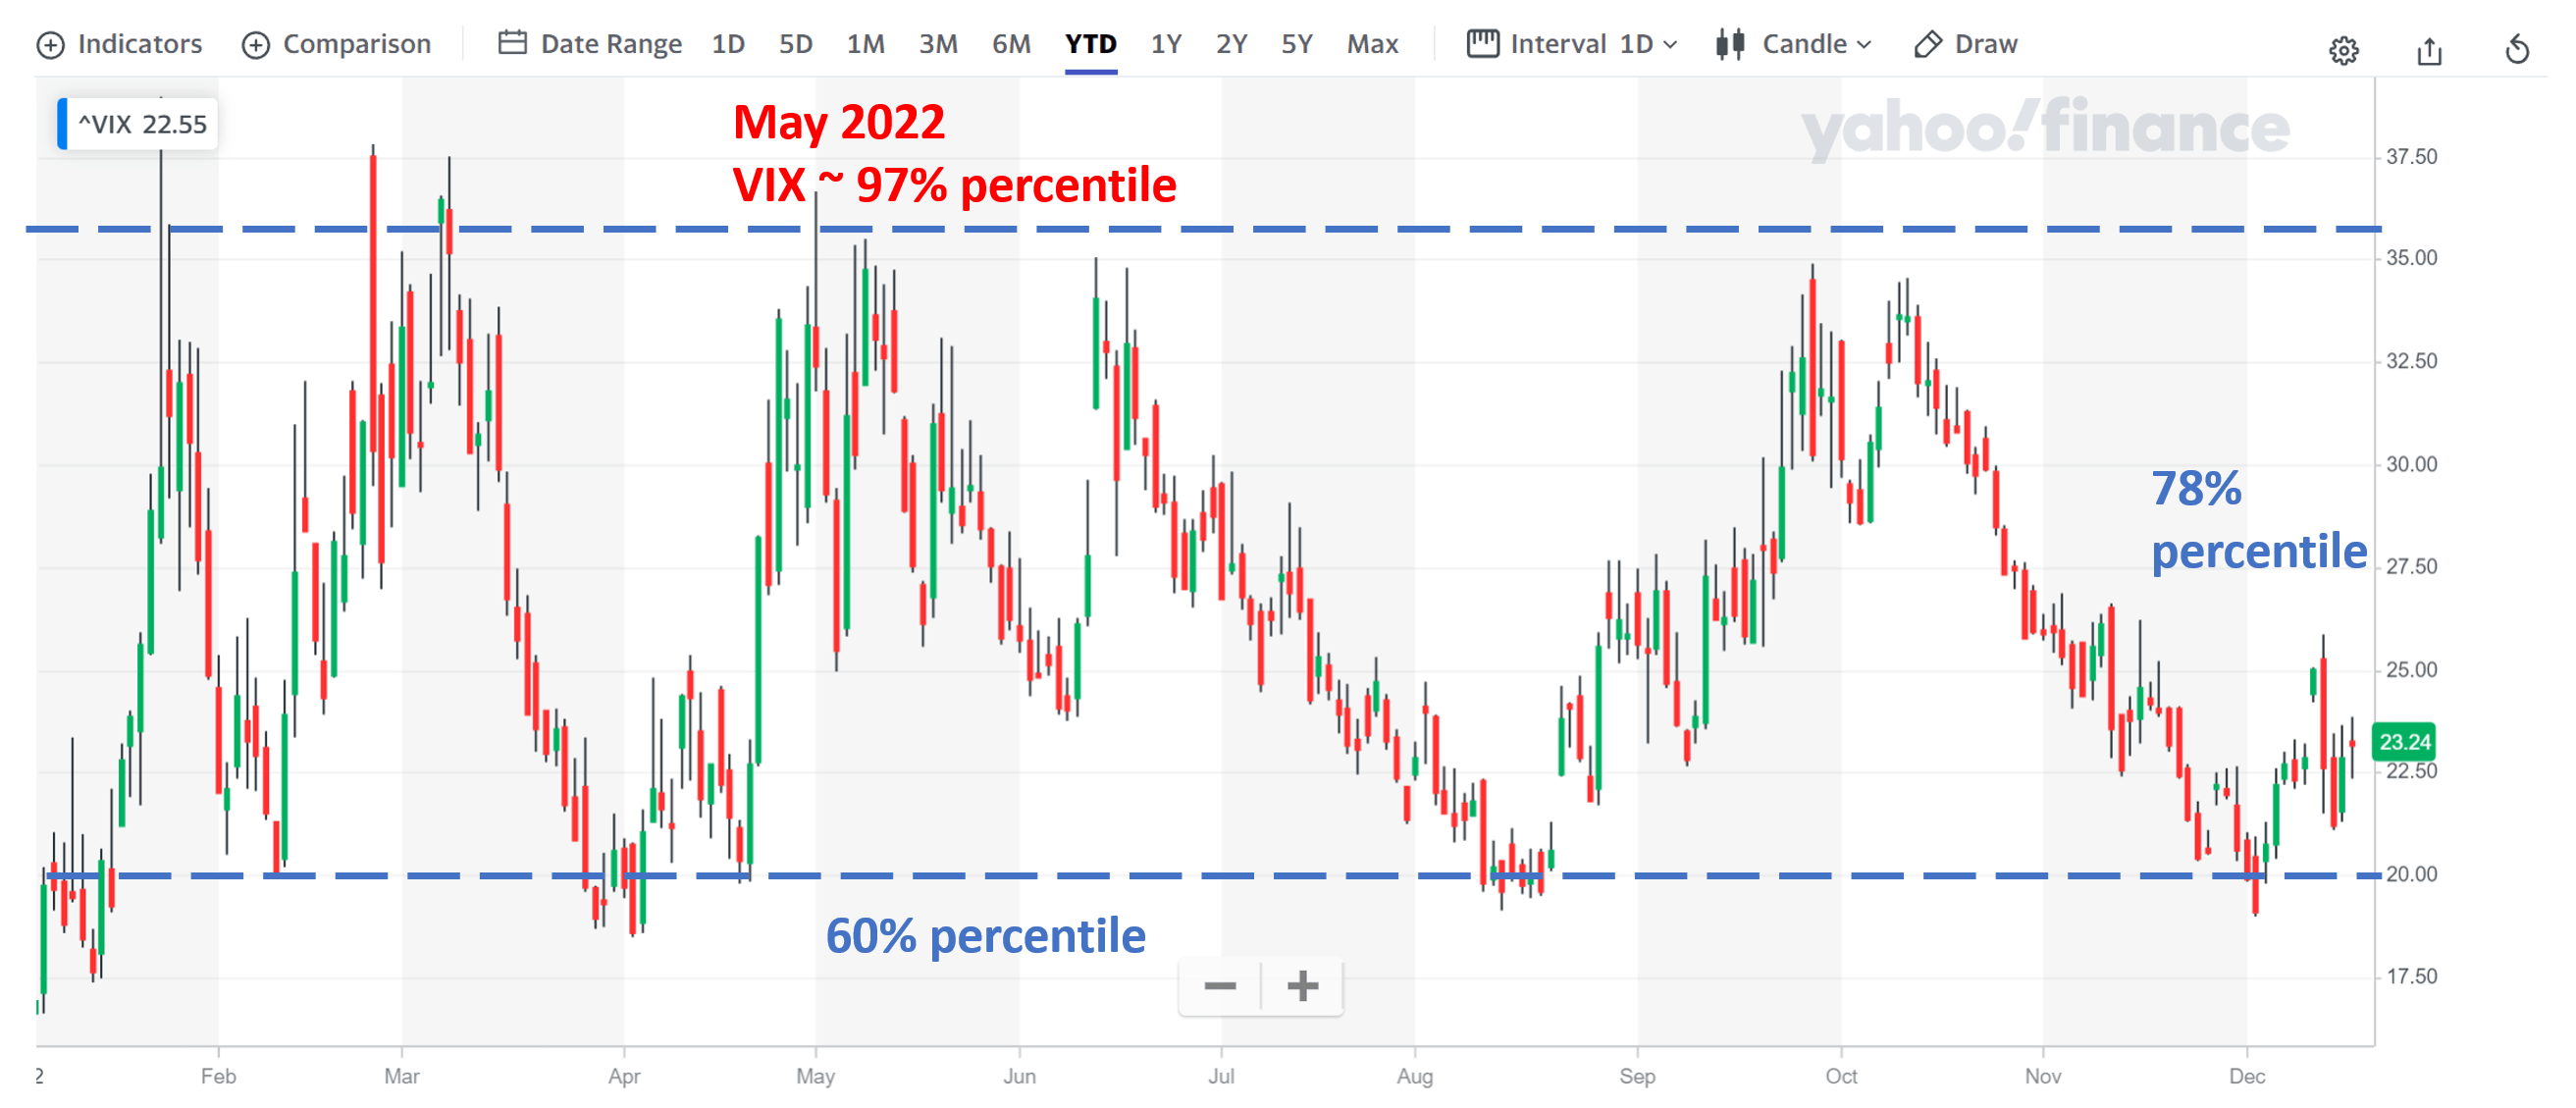
RYLD: Basic information
For readers not familiar with RYLD, my earlier article provided a more detailed introduction. And a few key points are summarized briefly here:
- RYLD charges a gross Expense Ratio of 0.70% and a net expense ratio of 0.60%. It has total net assets of $1.36 billion under management.
- One of RYLD’s key goals is to generate high income, and its yield is more than 14.6% (and made monthly) on a TTM basis as you can see from the chart below.
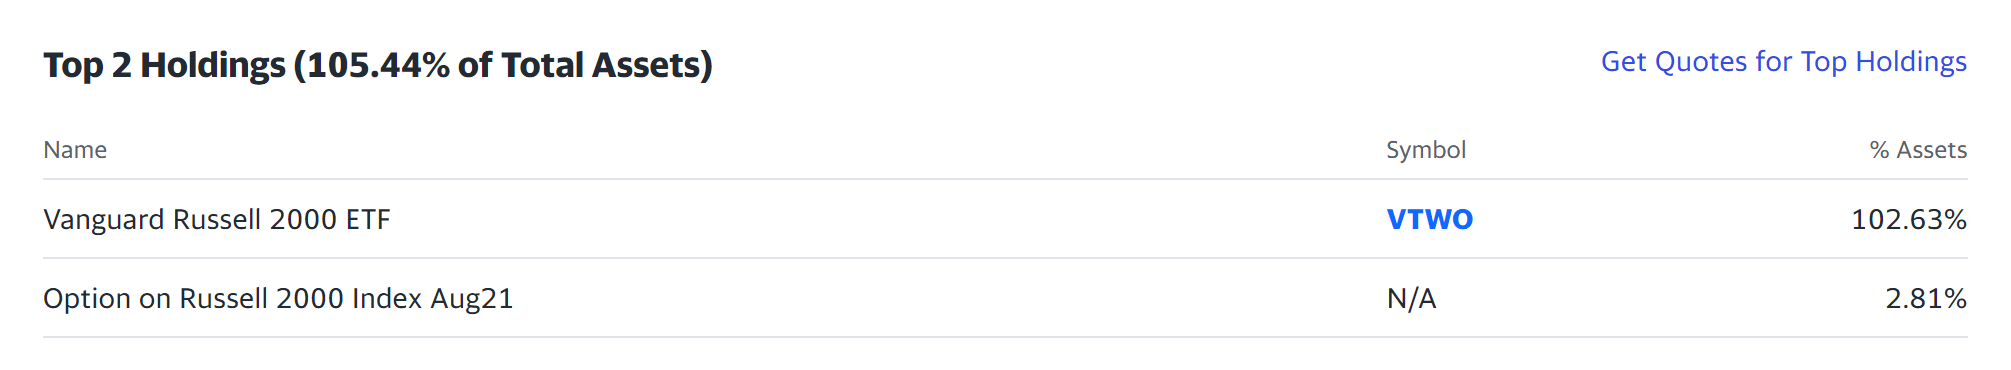
- As seen from the second chart, RYLD’s largest holding is the Vanguard Russell 2000 EFT, and the next largest holding is a call option on the Russell 2000 Index. The call option is covered by the Vanguard 2000 ETF, and this is how the fund generates its high income.
Just like anything else, the premium on the option hinges on the demand-supply relationship of the options market. When the market is in panic mode – like back in May 2022 – the demand is high and the premium would increase in tandem, as we will examine in more detail next.
Source: Global-X Fund description. Source: Yahoo Finance data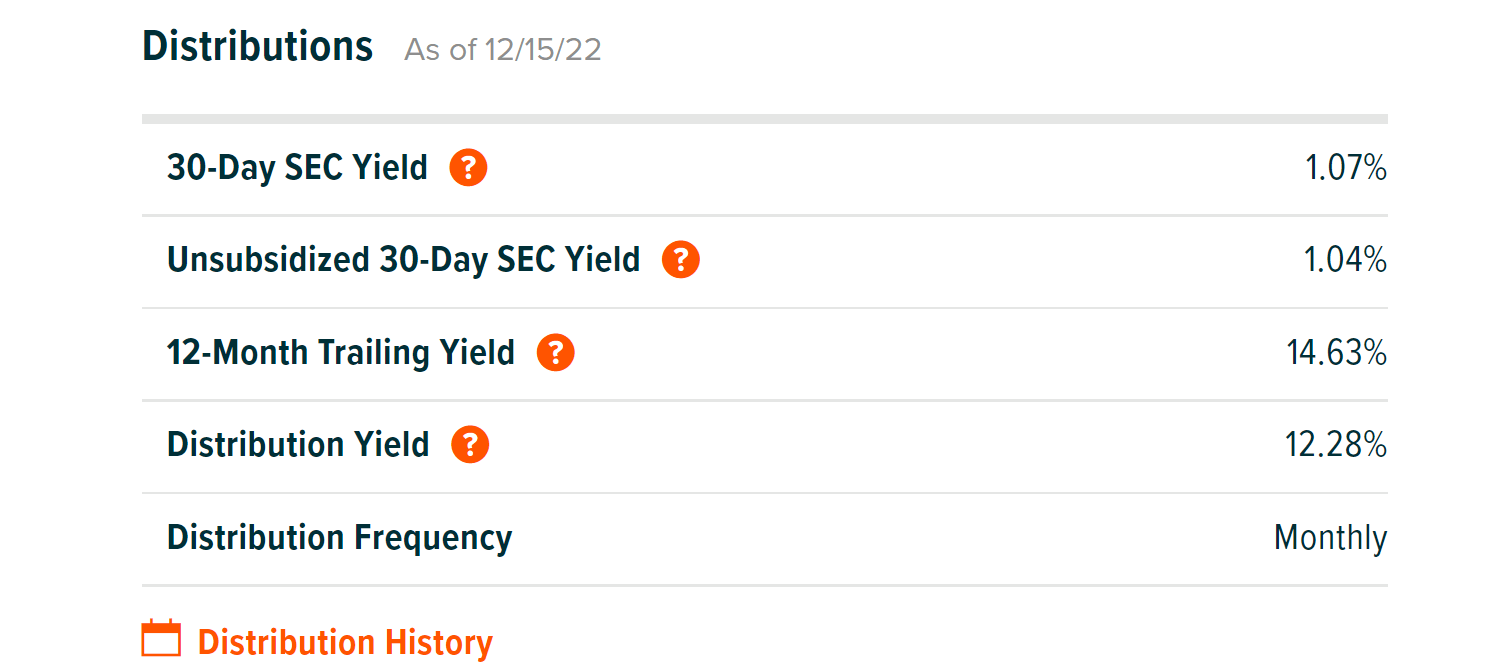
RYLD’s income vs VIX: a historical perspective
The next chart shows RYLD income and the VIX index in the past, as detailed in my early article:
The light blue line shows the 90% percentile line of the VIX index. Whenever the market is in panic mode – like in Dec 2021 – the panic led to an increasing surge in the VIX index. When the VIX index surges, it typically led to a higher demand for calls. And in turn, much higher demand led to higher increasing premiums for RYLD, and more dividend payments subsequently as indicated by the dark blue arrows. Vice versa, whenever the market is quiet and VIX low, the opposite dynamics unfold as indicated by the green arrows.
Author based on Seeking Alpha and Yahoo Finance data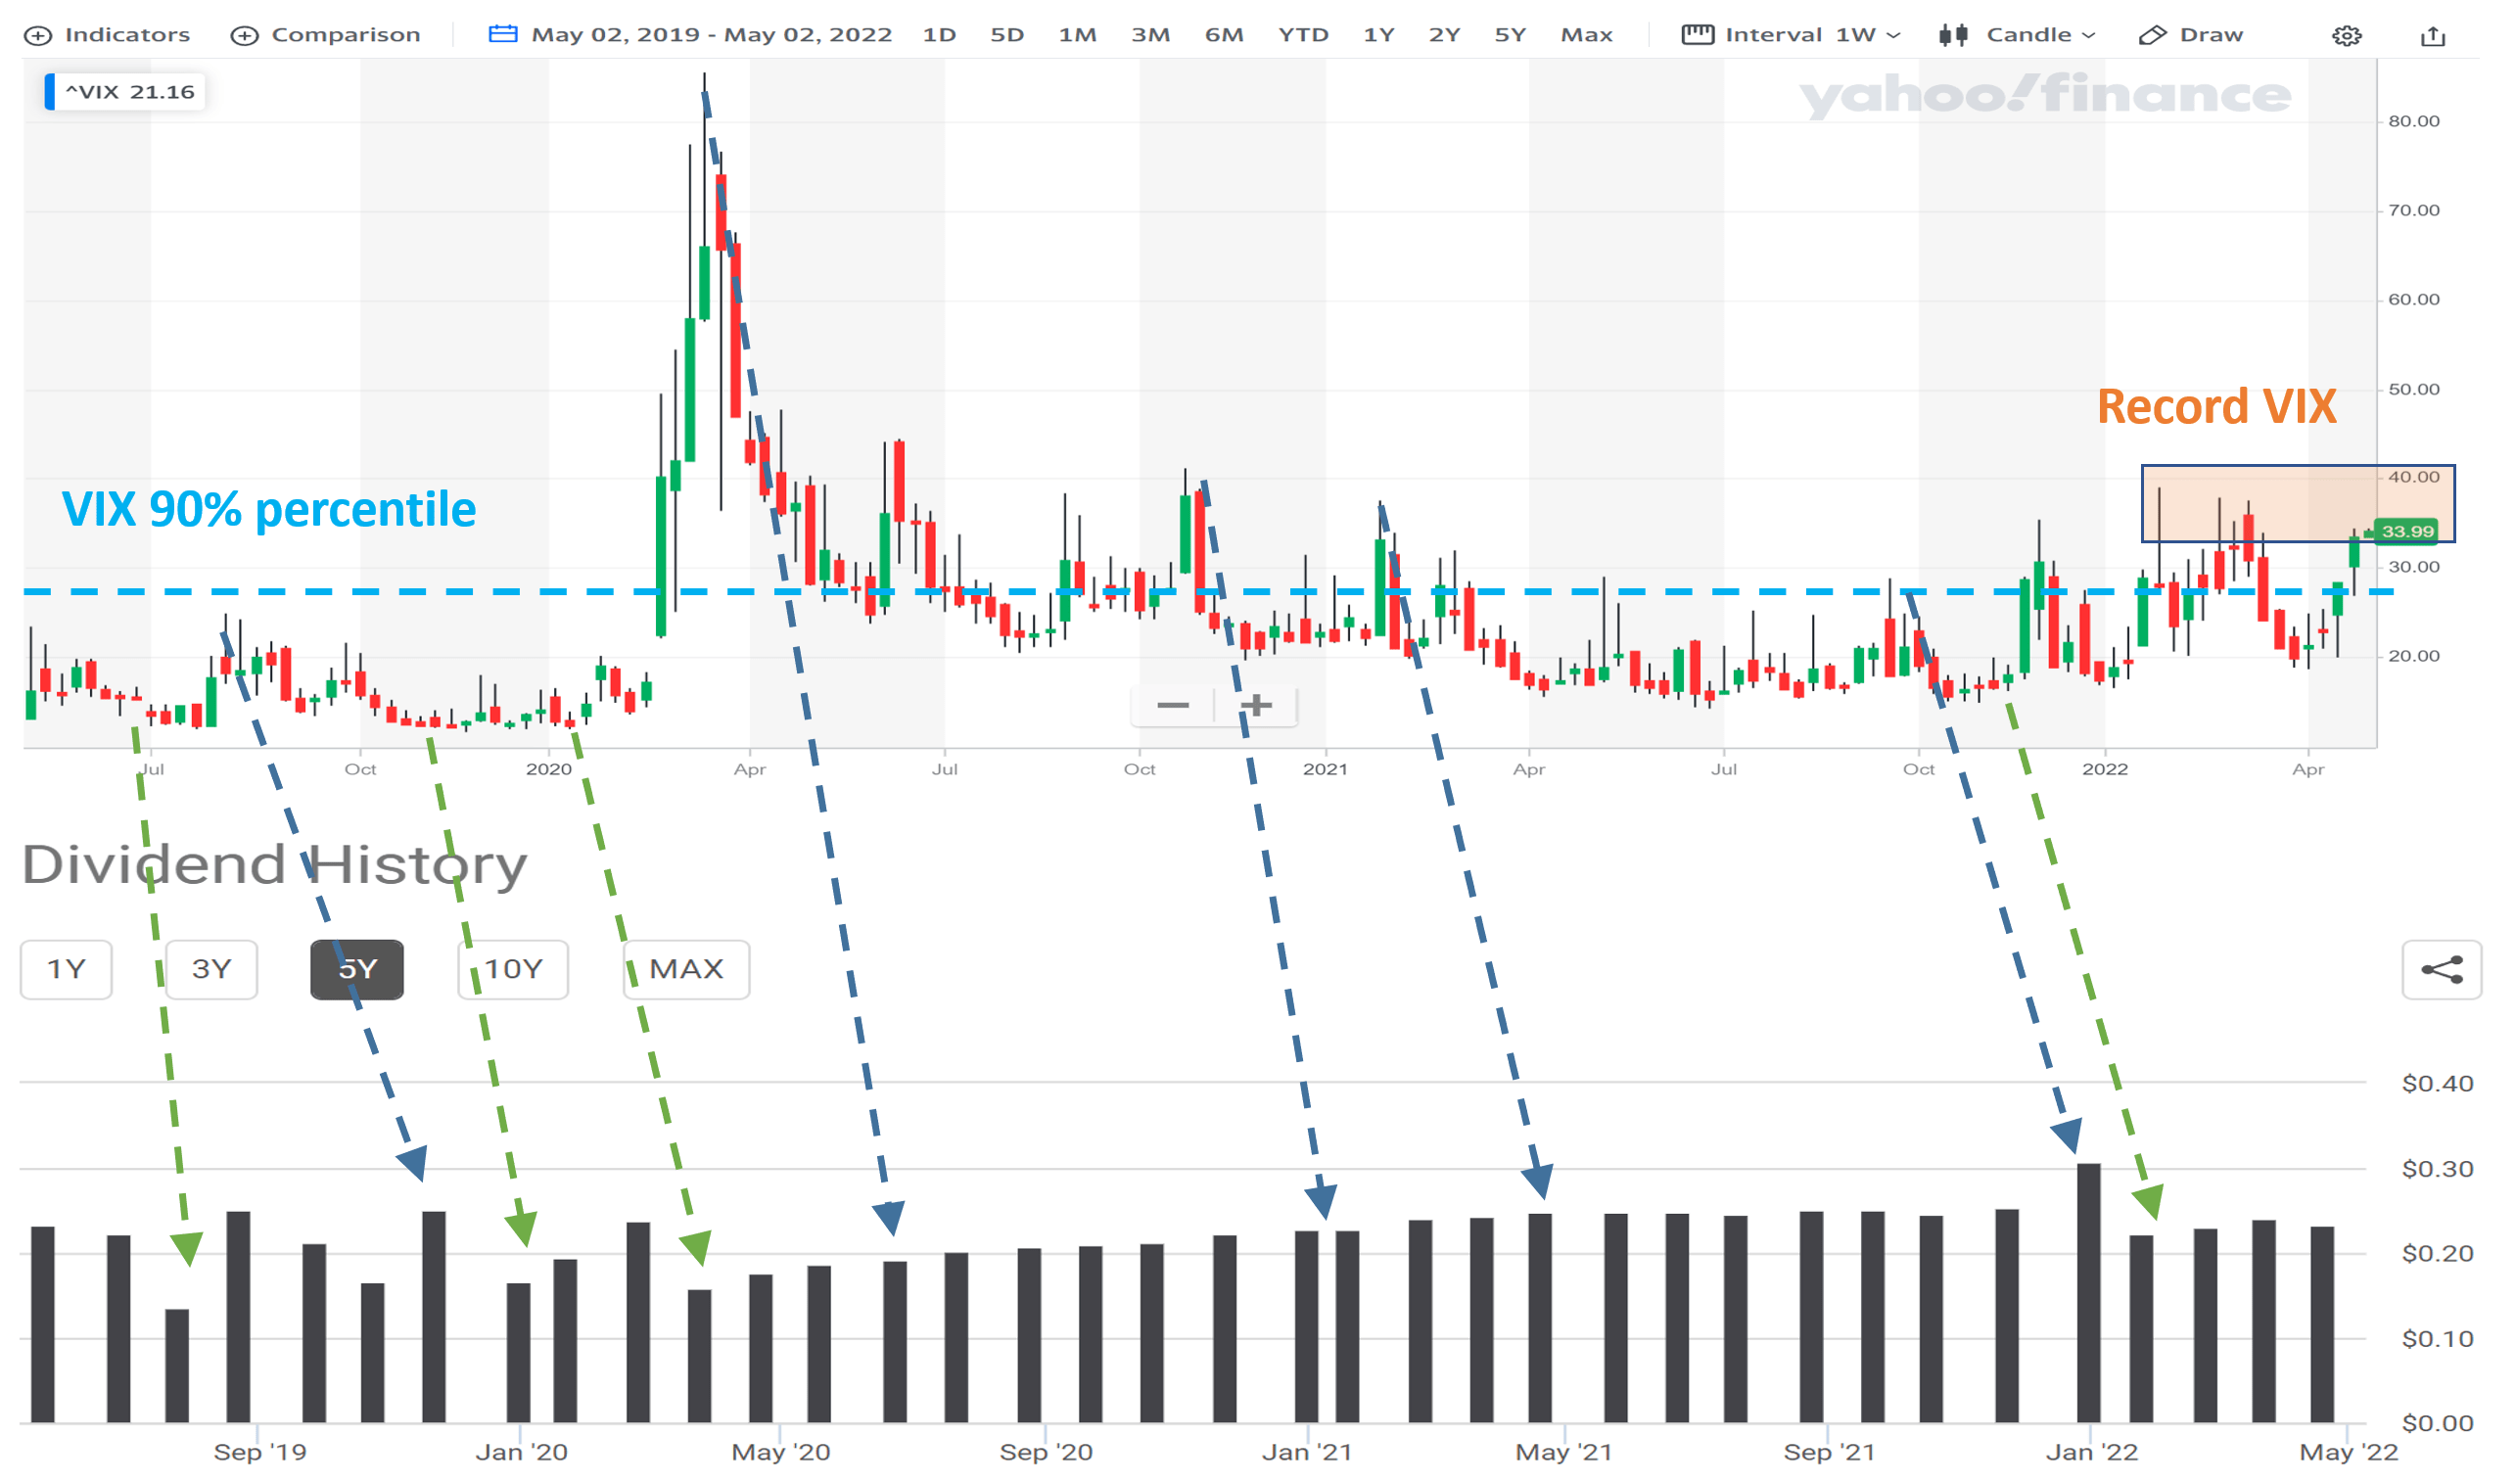
RYLD outlook: quieter VIX ahead
For the 1H of 2022, the market has experienced some of the highest VIX levels as aforementioned due to a range of large uncertainties (such as the broke out of the Russian/Ukraine war and also the ramparting inflation). As a result, at that time, my thesis was that I expect an increase in RYLD’s income distribution in the coming months (the payout increases would lag the VIX hikes as seen in the chart above).
Now looking forward, I see a few factors to keep VIX at a more moderate level and consequently, I see muted dividend payouts growth from RYLD. The top factors that I see to keep VIX at a milder level in the near future are twofold:
First and foremost, I see most of the interest rate uncertainties back in May have already dissipated by now. As repeated in my earlier writings, I firmly believe that long-term treasury rates cannot exceed inflation or real GDP growth – that is the only way our government can handle its debt. And for this reason, I do not think long-term rates can stay above 4%+/- for too long.
Second, the CPI reports have been showing two months of milder-than-expected inflation data already. For example, the November Consumer Price Index (data below provided by Trading Economics) dialed in at +0.1%, compared to the +0.3% expected. That’s the lowest inflation rate in more than a year, indicating that the Fed’s aggressive rate hikes are working through the economy to tame inflation.
Source: Trading Economics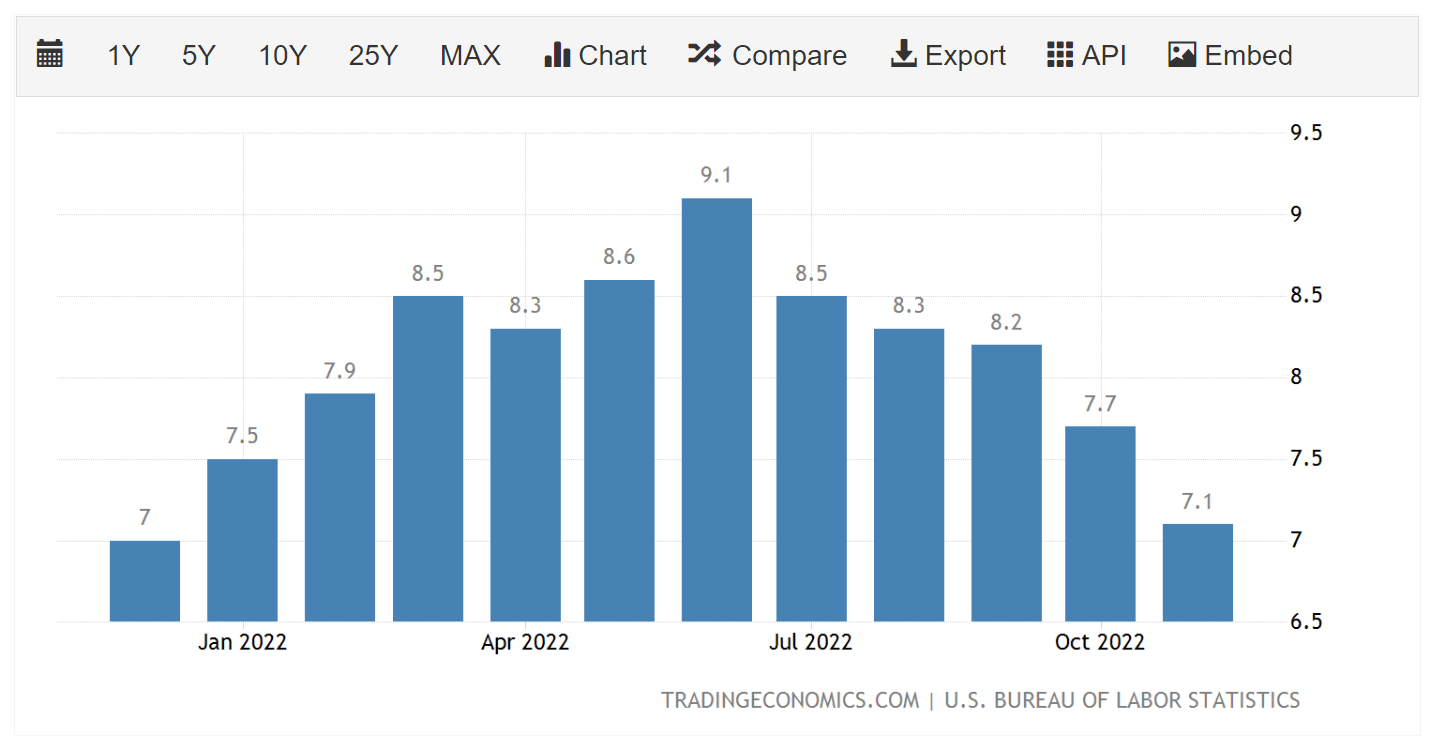
Risks and final thoughts
Besides the lower dividend payouts, I also expect total returns from RYLD to underperform relative to its underlying, the Russell 2000 index. The covered-call strategy generates high current dividend payouts at the cost of capping the upside potential (for the part of its holdings used to cover the call).
As illustrated in the next plot, the total return of RYLD closely tracked that of the underlying, approximated by the iShares Russell 2000 ETF (IWM) so far, largely due to the peak VIX as aforementioned and also the correction IWM suffered in recent years. However, some lag in performance still developed and will keep developing, in my view going forward. To wit, RYLD has delivered a total return of 2.96% CAGR since its inception as shown below, compared to 5.51% from IWM.
All told, the volatility is at a much milder level than when I first wrote about RYLD in May 2022. And I see the VIX staying at this milder level in the near future, which would in turn lead to mute dividend payout growth from RYLD and also underperformance in total return compared to the underlying. As such, I only suggest RYLD to investors who need the current dividends (after all, 14%+ dividend yield is very alluring). And finally, note RYLD has indeed suffered a lower worst-year loss than IWM (-10.4% vs. -14.9%), but its max drawdown is comparable to that of IWM (-31.1% vs -30.6%).
Source: Portfolio Visualizer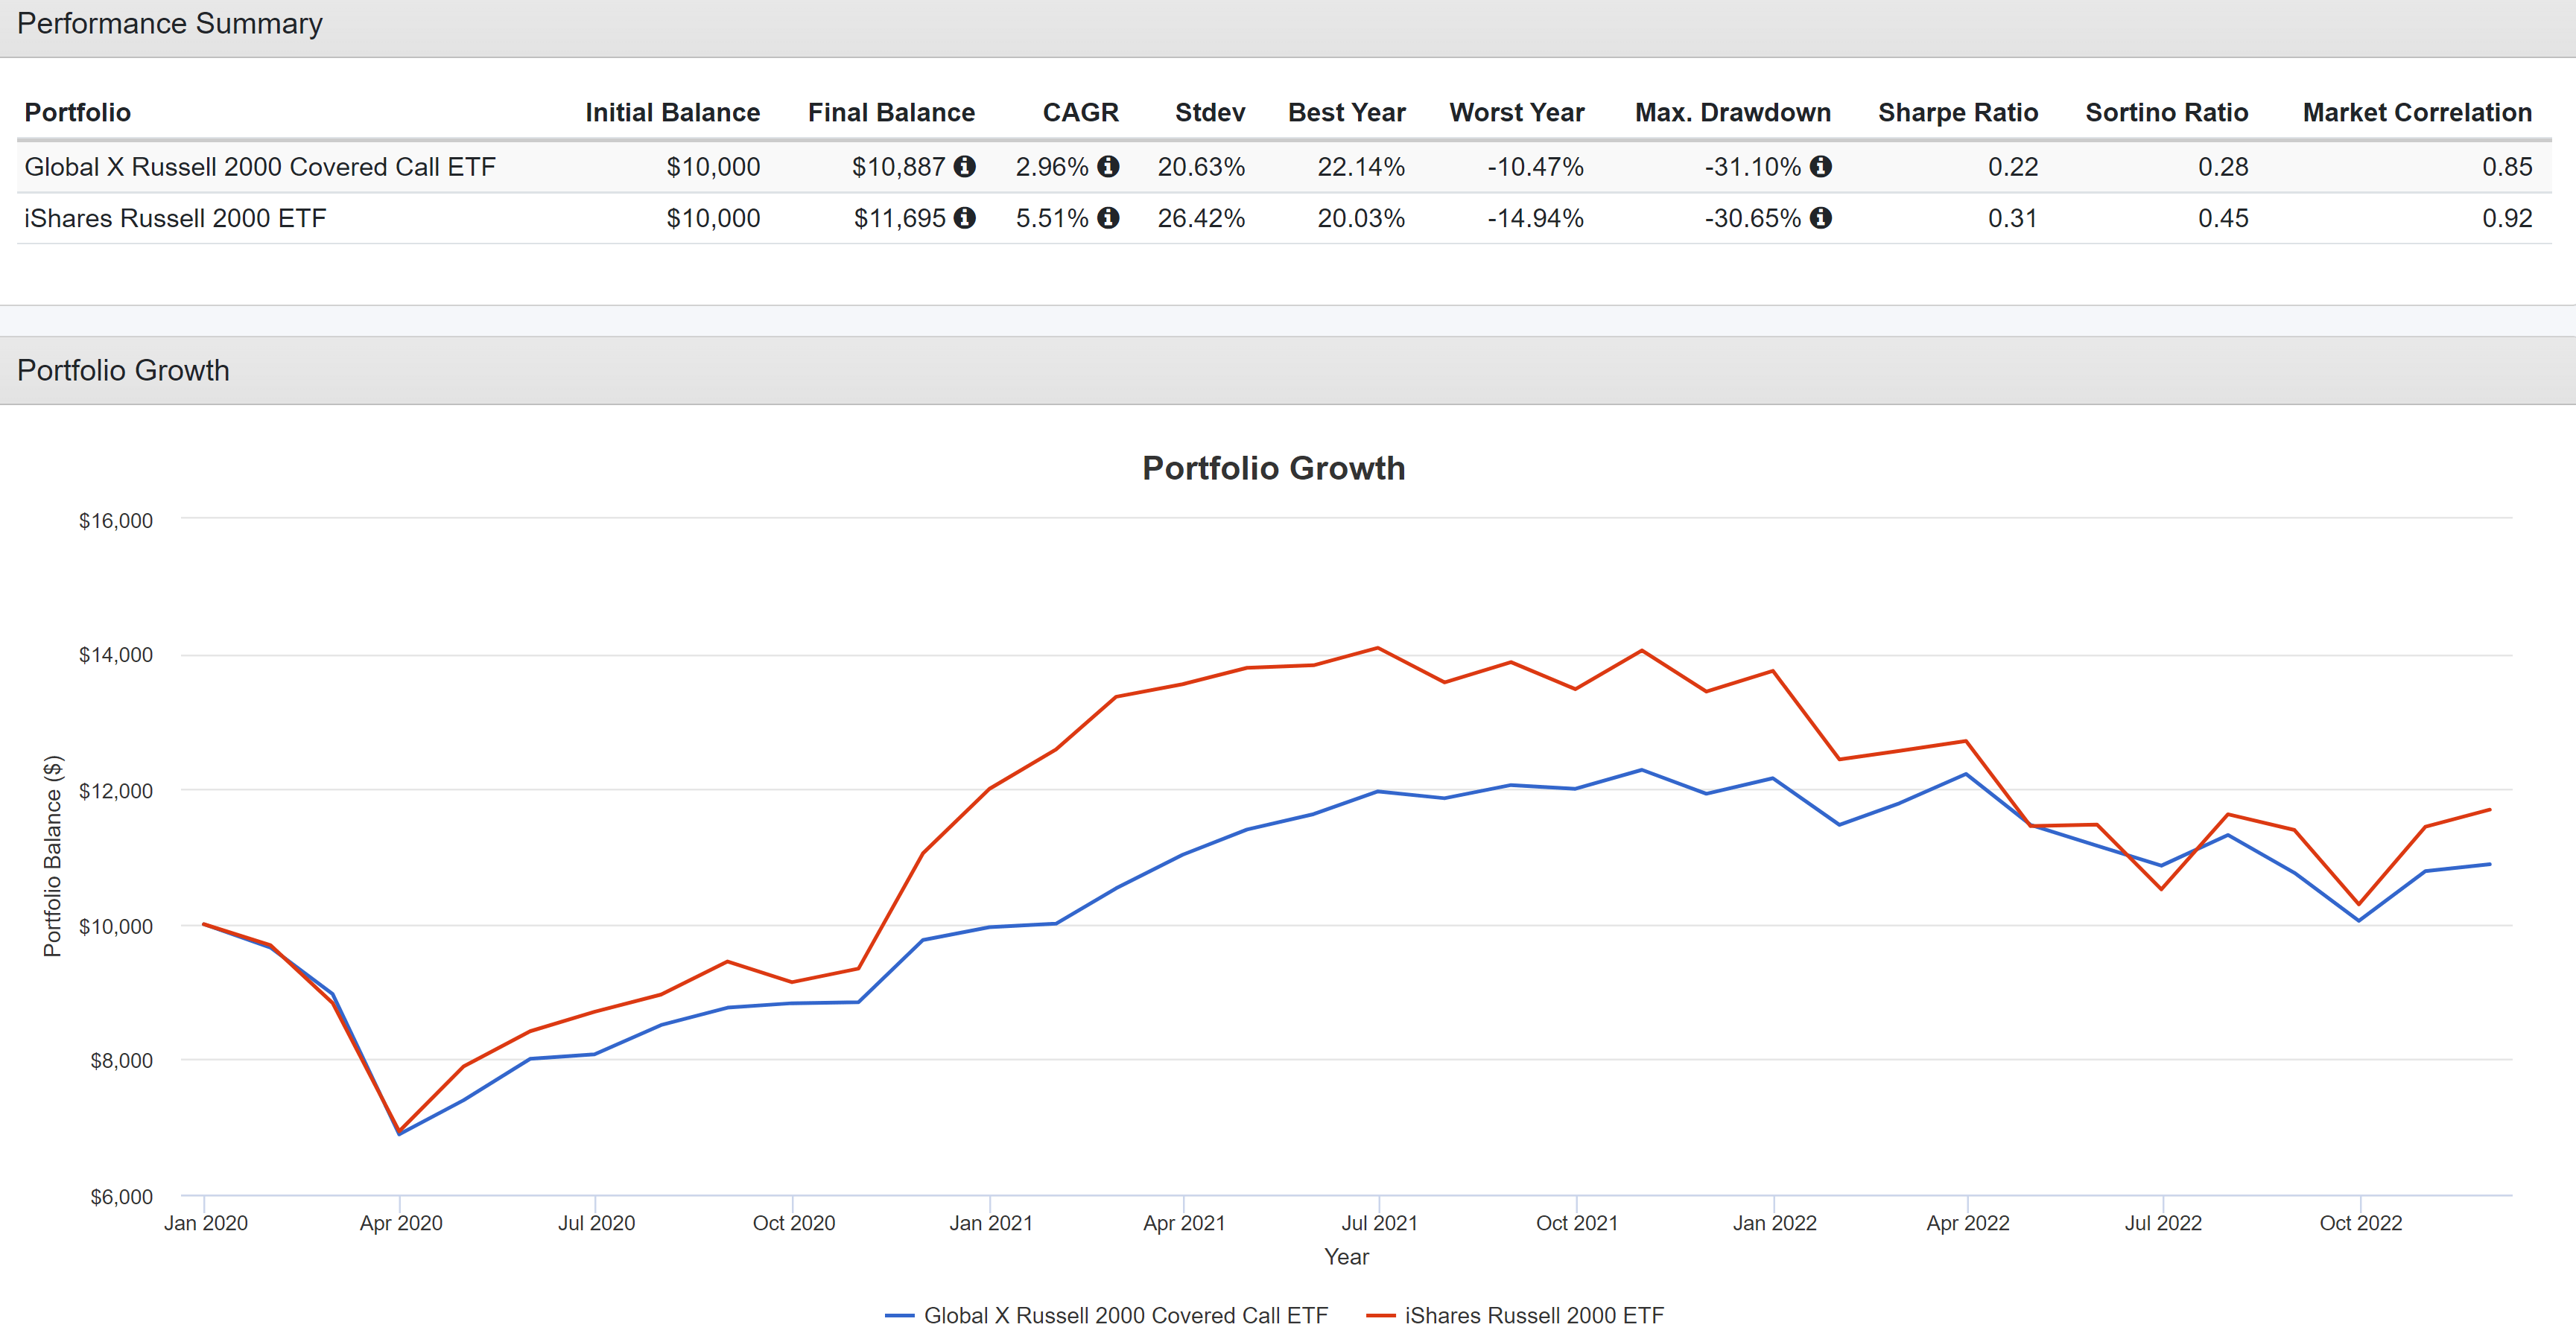
Be the first to comment