

Valerie Loiseleux
Introduction
My thesis is that Disney’s (NYSE:DIS) valuation is tricky. Note that Disney’s fiscal year ends in the fall while the fiscal years for Netflix (NFLX) and Warner Bros. Discovery (WBD) end in December.
The Numbers
Direct-to-consumer (“DTC”) streaming is a big part of Disney’s future but they’re still losing money in this area on an operating income level. Trailing-twelve-month (“TTM”) operating income from DTC is $(3,171) million or $(2,541) million + $(1,679) million – $(1,049) million. This was on TTM revenue of $19,211 million or $14,651 million + $16,319 million – $11,759 million. The 3Q22 earnings report explains that the DTC operating loss widened:
Direct-to-Consumer revenues for the quarter increased 19% to $5.1 billion and operating loss increased $0.8 billion to $1.1 billion. The increase in operating loss was due to a higher loss at Disney+, lower operating income at Hulu and, to a lesser extent, a higher loss at ESPN+. Lower results at ESPN+ were due to higher sports programming costs, partially offset by an increase in subscription revenue due to subscriber growth.
Here are the DTC subscriber and monthly average revenue per user/subscriber (“ARPU”) numbers:
DTC Members & ARPU (3Q22 earnings report)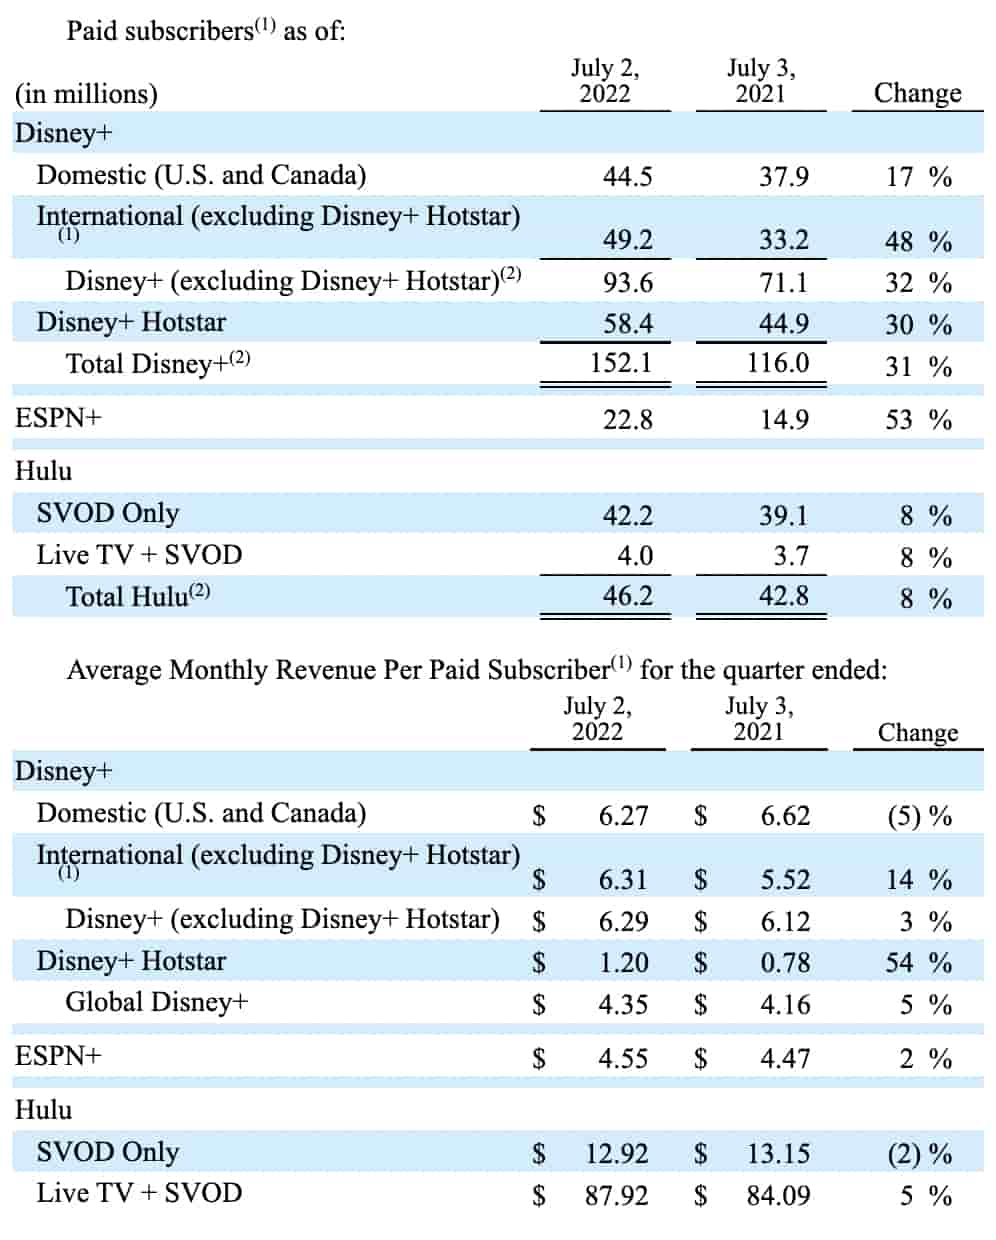
Looking at the $19.2 billion TTM DTC revenue, it doesn’t seem to be broken down by streaming source but we can think about the hypothetical annualized revenue numbers if sub growth and ARPU were to stop changing:
- $7.1 billion Disney+ or $6.29*12*93.6 million
- $0.8 billion Hotstar or $1.20*12*58.4 million
- $1.2 billion ESPN+ or $4.55*12*22.8 million
- $6.5 billion Hulu SVOD Only or $12.92*12*42.2 million
- $4.2 billion Hulu Live TV + SVOD or $87.92*12*4 million
Without Hulu, the combined Disney+ and ESPN+ annualized streaming revenue is $9.1 billion. By comparison, Netflix had 2Q22 revenue of $8 billion which is $32 billion annualized. Headlines focus on the fact that Disney+ has 152.1 million subs which isn’t far behind the 221 million we see at Netflix. However, revenue is the number that matters and Netflix has annualized revenue of $32 billion whereas Disney+ and ESPN+ have a combined annualized revenue of just $9.1 billion. Again, those 58.4 million Hotstar subs don’t do much to move the needle on revenue so it is apples and oranges when we talk about Disney+ and ESPN+ subs in comparison to Netflix subs. Netflix also had operating losses back when their annualized revenue was under $10 billion and I believe Disney+ has way to go before the streaming economics improve.
WBD had 2Q22 streaming revenue of $2.4 billion which is $9.6 billion annualized. Like Disney+, they’re losing money in this area on an operating income level. Both Disney+ and WBD should be fine in terms of operating income from streaming once they get to the revenue level we see at Netflix but it might take a long time for them to get to that point.
We need to know what Disney’s overall free cash flow (“FCF”) will look like over the next decade in order to determine what the company is worth today. I don’t see FCF broken down by segment but we do have segment breakdowns for operating income. From there, we have to make some assumptions about the FCF conversion for each segment. Historically it was estimated that ESPN was half of the operating income in the old “Cable Networks” segment. Starting with the 2021 10-K, I don’t see the “Cable Networks” segment broken out but we have some insight from what it looked like in the past. The apotheosis for operating income from Cable Networks was reached in 2015 and 2016:
Cable Networks Operating Income (Author’s spreadsheet)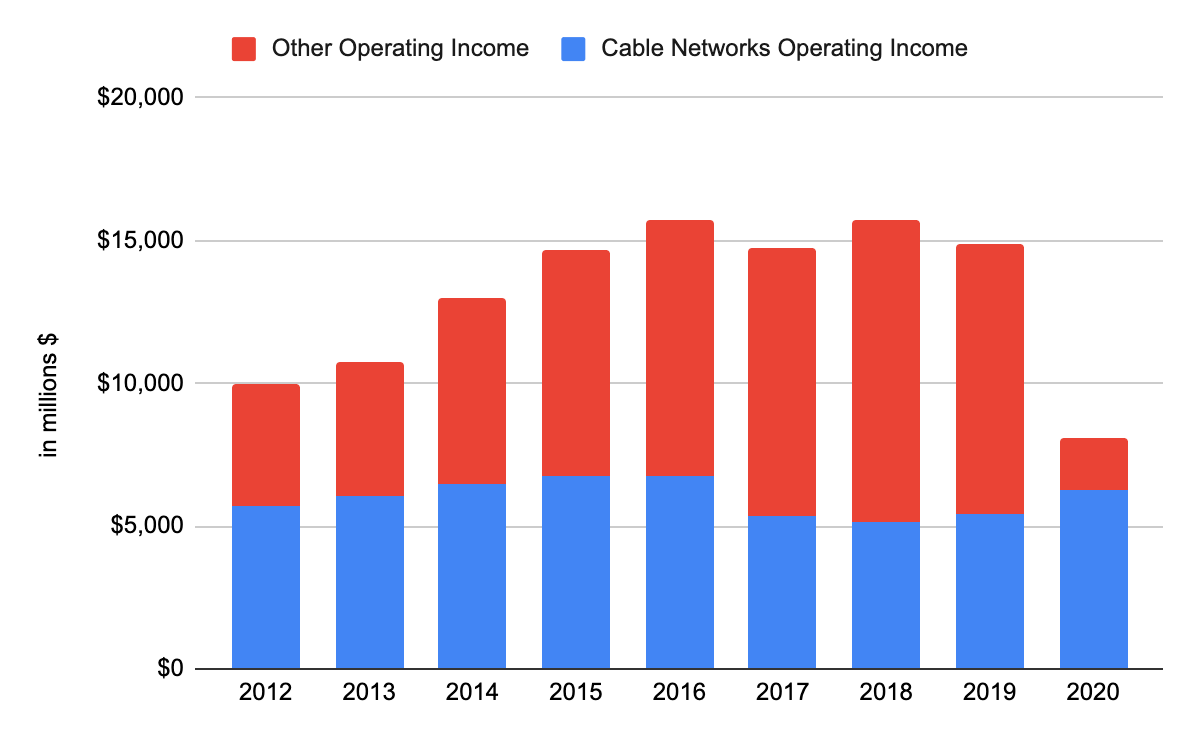
One of the concerns I have is that operating income from Cable Networks declined as a percentage of overall operating income from 2012 to 2018. The parks segment is kind of like railroads where their capex is consistently heavier than their depreciation. The studio segment can be inconsistent such that FCF levels are volatile. Knowing that the Cable Networks operating income has a higher free cash flow conversion than other segments, the lack of operating income growth from the Cable Networks segment is a concern.
The overall TTM FCF is just $1,205 million or $(317) million + $1,988 – $466 million. FCF was much higher up until 2018. 2019 FCF was lower because of a $(6,599) million tax line in the cash flow statement tied to tax implications from the Fox spin-off. FCF remained low in 2020 and 2021 as the COVID pandemic created complications:
FCF (Author’s spreadsheet)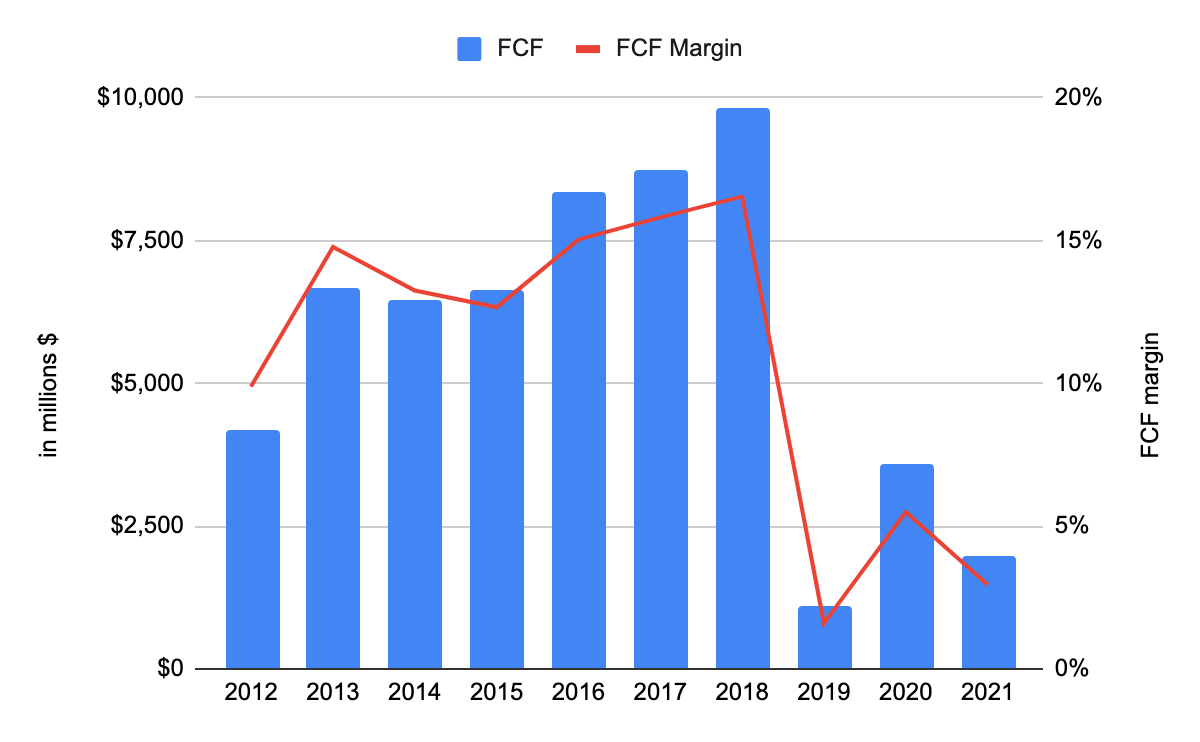
In the past, linear ESPN was a prodigious contributor to FCF but now the amounts of the contributions from this segment are obfuscated and it is hard to make predictions about the future in this area. With the help of linear ESPN, FCF was north of $6 billion from 2013 to 2018 but it is hard to say how things will look in the future as linear cable tv subscriptions continue to decline. In the short run, I don’t see how ESPN+ can make up for FCF declines from linear ESPN. We know that the 3Q22 earnings report said ESPN+ is currently operating at a loss and the monthly ARPU is just $4.55. The linear ESPN ARPU was well above this level back in the day.
The 3Q22 10-Q shows 1,823,057,777 shares outstanding as of August 3rd. Multiplying this by the August 15th share price of $124.26 gives us a market cap of $226.5 billion. The enterprise value is about $51.9 billion more than the market cap due to the fact that $13 billion in cash only partially offsets long-term debt of $46 billion, short-term debt of $5.6 billion, redeemable noncontrolling interests of $9.4 billion and other noncontrolling interests of $3.9 billion. WBD’s enterprise value is about $51.5 billion higher than its market cap whereas Netflix has an enterprise value that is only about $8.4 billion more than its market cap. Seeing as WBD’s market cap is much less than Disney’s, WBD has much more debt than Disney on a relative basis but both WBD and Disney have more debt than Netflix.
If Disney can get back to the 2018 FCF level of $9.8 billion and keep it there then the stock is cheap but there are many questions as to when that level of FCF will happen again on a regular basis.
Long-term investors need to listen and make determinations as to how legacy cash cows like ESPN will subsidize future segments like DTC. Estimates also need to be made as to when DTC will be cash flow positive and how much vestigial FCF we’ll be seeing from linear ESPN at that time.
Be the first to comment