

RiverNorthPhotography
Earnings of Glacier Bancorp (NYSE:GBCI) will get pressurized by the recent fall in non-interest income and the anticipated surge in non-interest expenses. On the other hand, the growth of loans and the margin will lift earnings. Overall, I’m expecting Glacier Bancorp to report earnings of $2.76 per share for 2022, down 4%, and $3.08 per share for 2023, up 12% year-over-year. Compared to my last report on the company, I’ve reduced my earnings estimates mostly because I’ve raised my non-interest expense estimates. Next year’s target price is quite close to the current market price. Therefore, I’m maintaining a hold rating on Glacier Bancorp.
Expecting Mortgage Banking Income to Remain Stable from the Third Quarter’s Level
Income for the mortgage banking business continued to drop in the third quarter as rising interest rates not only disincentivized refinancing activity but also hurt new home purchases. Income from the mortgage banking business (which is different from interest income as it’s a gain-on-sale model) dropped to just 1.6% in total revenues in the third quarter of 2022. In comparison, mortgage banking income reached a peak of 12.9% in 2020 and was at 5.4% in 2019 before the rate cuts cycle started.
Since my last report on the company, which was issued in October, the Mortgage Bankers Association has significantly reduced its forecasts for 2023.
Mortgage Bankers Association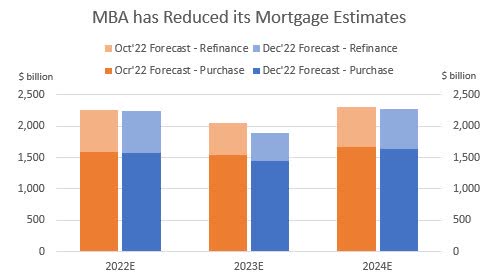
Nevertheless, for Glacier’s case I’ve decided to not change my forecast because its mortgage banking income has already fallen below the level seen in the last up-rate cycle (2017 – 2019). Overall, I’m expecting mortgage banking income to remain at the third quarter’s level till the end of 2023. Further, I’m expecting other fee income to gradually creep upwards. In total, I’m expecting non-interest income to increase by 0.8% year-over-year in 2023.
Double-Digit Loan Growth to Lift Earnings
Glacier Bancorp’s loan growth remained strong at around 3.1% during the third quarter, which took the first nine-month growth to 10.7%, or 14% annualized. This is in line with the historical trend of double-digit loan growth. I’m expecting growth to slow down a bit from normal in 2023 because of high-interest rates, which will dampen credit demand.
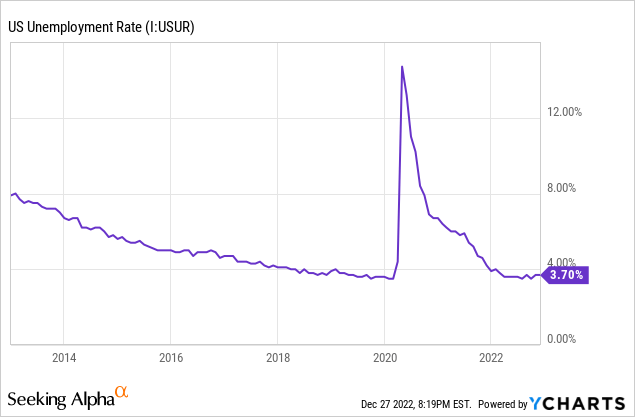
On the other hand, strong job markets bode well for loan growth. Glacier Bancorp operates across several states in the Rocky Mountain area; therefore, the national unemployment rate is a good proxy for unemployment in Glacier’s markets. As can be seen below, the country’s unemployment rate has been near record lows throughout this year.
The management mentioned in the conference call that its pipelines have continued to slow down in the third quarter of 2022. Considering these conflicting factors, I’m expecting the loan portfolio to grow by 2.5% in the last quarter of 2022, leading to full-year loan growth of 13%. For 2023, I’m expecting the loan portfolio to grow by 10%. Meanwhile, I’m expecting deposits to grow somewhat in line with loans. The following table shows my balance sheet estimates.
| Financial Position | FY18 | FY19 | FY20 | FY21 | FY22E | FY23E |
| Net Loans | 8,156 | 9,388 | 10,964 | 13,259 | 15,040 | 16,601 |
| Growth of Net Loans | 26.5% | 15.1% | 16.8% | 20.9% | 13.4% | 10.4% |
| Other Earning Assets | 2,980 | 3,001 | 5,934 | 10,670 | 9,747 | 9,943 |
| Deposits | 9,494 | 10,776 | 14,798 | 21,337 | 22,427 | 24,755 |
| Borrowings and Sub-Debt | 989 | 777 | 1,178 | 1,198 | 1,812 | 1,848 |
| Common equity | 1,516 | 1,961 | 2,307 | 3,178 | 2,818 | 2,998 |
| Book Value per Share ($) | 18.1 | 22.2 | 24.3 | 28.7 | 25.4 | 27.0 |
| Tangible BVPS ($) | 14.0 | 16.3 | 18.3 | 19.3 | 16.1 | 17.8 |
| Source: SEC Filings, Author’s Estimates(In USD million unless otherwise specified) | ||||||
Margin Likely to Fare Better in Future Quarters
Glacier Bancorp’s net interest margin increased by 11 basis points in the third quarter, which isn’t too bad given the margin expanded by just three basis points in the second quarter of the year. Glacier Bancorp has continuously improved its deposit mix in the first nine months of 2022. Non-interest-bearing deposits have increased from 36.5% at the end of December 2021 to 37.9% at the end of September 2022. This will keep the deposit beta (rate sensitivity) low. However, the management mentioned in the conference call that the pressure on deposit costs is building; therefore, it expects to see a rise in deposit costs. Further, the management mentioned that it expects the deposit beta to be near the mid-teen level, which is still low.
In the past, the margin has been only loosely correlated with interest rate changes, as shown below.
SEC Filings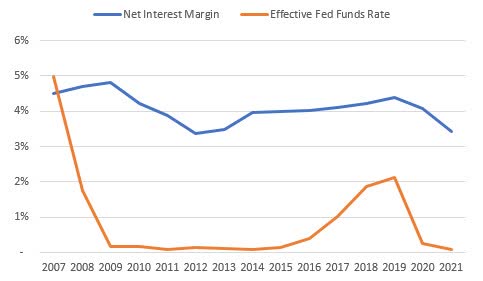
I’m expecting the future to be slightly better due to the recent improvement in the deposit mix. Overall, I’m expecting the margin to increase by 10 basis points in the last quarter of 2022 and 15 basis points in 2023.
Increasing my Expense Estimates and Reducing my Earnings Estimates
The management mentioned in the conference call that it expects core operating expenses to rise in the fourth quarter due to inflation. The management is expecting the non-interest expenses to be in the range of mid-130s in the fourth quarter of 2022, which is higher than the expenses of $130 million recorded for the third quarter of the year. Once the operating expenses have risen, they are unlikely to fall back as cuts in salary and occupancy expenses are quite rare. As a result, I’ve decided to raise my non-interest expense estimates for both 2022 and 2023.
Overall, I’m expecting Glacier Bancorp to report earnings of $2.76 per share for 2022, down 3.6% year-over-year. For 2023, I’m expecting earnings to increase by 12% to $3.08 per share. The following table shows my income statement estimates.
| Income Statement | FY18 | FY19 | FY20 | FY21 | FY22E | FY23E |
| Net interest income | 433 | 503 | 600 | 663 | 797 | 918 |
| Provision for loan losses | 10 | 0 | 40 | 23 | 20 | 26 |
| Non-interest income | 119 | 131 | 173 | 145 | 123 | 124 |
| Non-interest expense | 320 | 375 | 405 | 435 | 524 | 594 |
| Net income – Common Sh. | 182 | 211 | 266 | 285 | 306 | 342 |
| EPS – Diluted ($) | 2.17 | 2.38 | 2.81 | 2.86 | 2.76 | 3.08 |
| Source: SEC Filings, Author’s Estimates(In USD million unless otherwise specified) | ||||||
In my last report on Glacier Bancorp, I estimated earnings of $2.82 per share for 2022 and $3.17 per share for 2023. I’ve reduced my earnings estimates mostly because I’ve raised my non-interest expense estimates.
My estimates are based on certain macroeconomic assumptions that may not come to fruition. Therefore, actual earnings can differ materially from my estimates.
Small Upside Warrants a Hold Rating
Glacier Bancorp has increased its dividend every year over the last decade. Given the earnings outlook, I’m expecting the company to increase its dividend by $0.01 per share to $0.34 per share in the first quarter of 2023. I’m also expecting the company to continue to pay $0.10 per share as a special dividend annually. The earnings and dividend estimates suggest a payout ratio of 47% for 2023, which is below the five-year average of 58%. Based on my dividend estimate, Glacier Bancorp is offering a forward dividend yield of 3.0%.
I’m using the historical price-to-tangible book (“P/TB”) and price-to-earnings (“P/E”) multiples to value Glacier Bancorp. The stock has traded at an average P/TB ratio of 2.63 in the past, as shown below.
| FY17 | FY18 | FY19 | FY20 | FY21 | Average | |
| T. Book Value per Share ($) | 13.0 | 14.0 | 16.3 | 18.3 | 19.3 | |
| Average Market Price ($) | 35.5 | 41.2 | 41.5 | 37.9 | 55.4 | |
| Historical P/TB | 2.74x | 2.94x | 2.55x | 2.07x | 2.87x | 2.63x |
| Source: Company Financials, Yahoo Finance, Author’s Estimates | ||||||
Multiplying the average P/TB multiple with the forecast tangible book value per share of $17.8 gives a target price of $46.8 for the end of 2023. This price target implies a 5.1% downside from the December 27 closing price. The following table shows the sensitivity of the target price to the P/TB ratio.
| P/TB Multiple | 2.43x | 2.53x | 2.63x | 2.73x | 2.83x |
| TBVPS – Dec 2023 ($) | 17.8 | 17.8 | 17.8 | 17.8 | 17.8 |
| Target Price ($) | 43.2 | 45.0 | 46.8 | 48.5 | 50.3 |
| Market Price | 49.3 | 49.3 | 49.3 | 49.3 | 49.3 |
| Upside/(Downside) | (12.4)% | (8.8)% | (5.1)% | (1.5)% | 2.1% |
| Source: Author’s Estimates |
The stock has traded at an average P/E ratio of around 18.6x in the past, as shown below.
| FY17 | FY18 | FY19 | FY20 | FY21 | Average | |
| Earnings per Share ($) | 1.50 | 2.17 | 2.38 | 2.81 | 2.86 | |
| Average Market Price ($) | 35.5 | 41.2 | 41.5 | 37.9 | 55.4 | |
| Historical P/E | 23.7x | 19.0x | 17.4x | 13.5x | 19.4x | 18.6x |
| Source: Company Financials, Yahoo Finance, Author’s Estimates | ||||||
Multiplying the average P/E multiple with the forecast earnings per share of $3.08 gives a target price of $57.3 for the end of 2023. This price target implies a 16.3% upside from the December 27 closing price. The following table shows the sensitivity of the target price to the P/E ratio.
| P/E Multiple | 16.6x | 17.6x | 18.6x | 19.6x | 20.6x |
| EPS 2023 ($) | 3.08 | 3.08 | 3.08 | 3.08 | 3.08 |
| Target Price ($) | 51.2 | 54.2 | 57.3 | 60.4 | 63.5 |
| Market Price ($) | 49.3 | 49.3 | 49.3 | 49.3 | 49.3 |
| Upside/(Downside) | 3.8% | 10.0% | 16.3% | 22.5% | 28.8% |
| Source: Author’s Estimates |
Equally weighting the target prices from the two valuation methods gives a combined target price of $52.0, which implies a 5.6% upside from the current market price. Adding the forward dividend yield gives a total expected return of 8.2%. Hence, I’m maintaining a hold rating on Glacier Bancorp.
Be the first to comment