

tiero/iStock via Getty Images
Recommendation
Frontier (NASDAQ:FYBR) is undergoing a post-bankruptcy transformation with the hope of changing a dying business into a growing fiber internet provider. I ended up passing on Frontier, but I understand the appeal. The main sticking point for me was I couldn’t get comfortable with the risk/reward skew. The transformation requires great long-term execution and, even though I think Frontier’s management are competent and can deliver, there’s a lot outside of their control (credit markets, supply chains, competition etc.). Additionally, the 45%+ terminal penetration cited by Frontier and across the industry requires taking share from cable (and not losing any to fixed wireless). I’m biased here as I’m long Charter (main competitor in Frontier’s footprint), but I don’t think taking share from cable will be as simple as just waiting 4-5 years (after overbuilding).
While there is significant upside if this strategy is successful, the downside is severe as their copper assets are effectively obsolete and the debt load is still large relative to Frontier’s near-term earning potential. I hope this article is still useful despite my conclusion.
The Situation
Frontier is legacy copper provider that is in the process of converting its copper assets into high quality and futureproof fiber. They currently pass ~15mm homes and businesses (~11mm copper and ~4mm fiber). Frontier filed for bankruptcy in April 2020 after debt from poorly performing acquisitions overwhelmed the business. Key acquisitions/divestures have been highlighted below:
-
2010 – Purchased Verizon’s (VZ) legacy telephone business in 14 states for $8.6bln. The transaction added ~5mm passings, 2.2mm long distance voice customers and 1mm data customers.
-
2014 – Purchased AT&T (T) Connecticut operations for ~$2bln which included 415k data customers, 875k voice customers, and 215k video customers (these numbers don’t include business and wholesale customers).
-
2015 – Purchased Verizon’s wireline assets in 3 states (FL, TX, and CA) for $10.5bln. The purchase added 3.7mm voice connections and 2.2mm broadband customers (~$3.6bln of rev).
-
Sold Northwest operations in 2020 for ~$1.3bln.
Frontier 10-K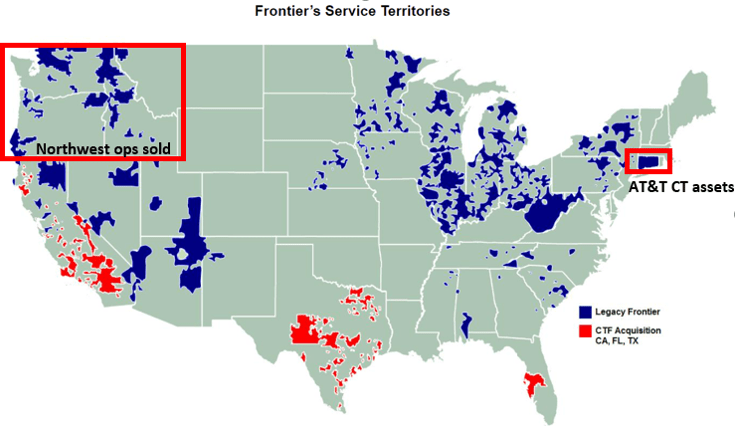
These transactions increased debt from ~$5bln in 2010 to ~$18bln at the time of the bankruptcy filing. They entered an RSA (Restructuring Support Agreement) with bondholders that reduced their debt load by ~$10bln and gave them significant liquidity to upgrade their obsolete copper assets. They brought in a new management team (CEO Nick Jeffery), new board (Chairman John Stratton), and outlined a new strategy that they believe will turn Frontier into a growing fiber business by 2025. The plan has been laid out in three waves:
Frontier Q1 22 Earnings Presentation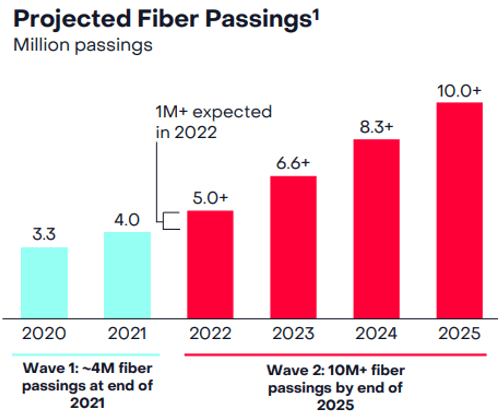
Wave 1 was to fiberize ~600k copper passings by the end of 2021, with an expected cost of ~$600 per passing. This was completed on schedule and management plans to ramp up their fiber buildouts to ~1-1.2mm in 2022, before increasing to ~1.6mm a year through 2025 with an average cost of ~$1k per passing (Wave 2). Management has built credibility with Wave 1 and has laid out clear targets to track their progress during Wave 2:
-
~15-20% penetration 1 year after fiber build.
-
~25-30% penetration after 2 years.
-
Terminal penetration of 45%+.
Wave 3 is the remaining 5mm copper passings where management doesn’t currently believe the economics work for a fiber overbuild. The options management has floated for Wave 3 include asset swaps, sales, or potential overbuilds with government subsidies (e.g., Rural Digital Opportunity Fund).
Frontier currently trades for ~5x EV/EBITDA and has enough liquidity to fund their fiber build through 2024 (~$2.5-$3bln in capex annually). They have also reached a few key post-bankruptcy milestones such as positive net broadband adds (Q4 21), fiber customer base > than copper (Q3 21), and fiber EBITDA > copper (3Q 21).
Unfortunately, they do have some headwinds that will impact near-term financial performance:
-
Loss of subsidy revenue (~$300mm revenue impact in 2022).
-
Repricing their wholesale business lower to be competitive long-term (~$1.2bln total rev in 2021 with ~$100mm impact in 2022).
-
Secular decline of voice and video (~$2.3bln of revenue with 5-10% topline declines expected long-term).
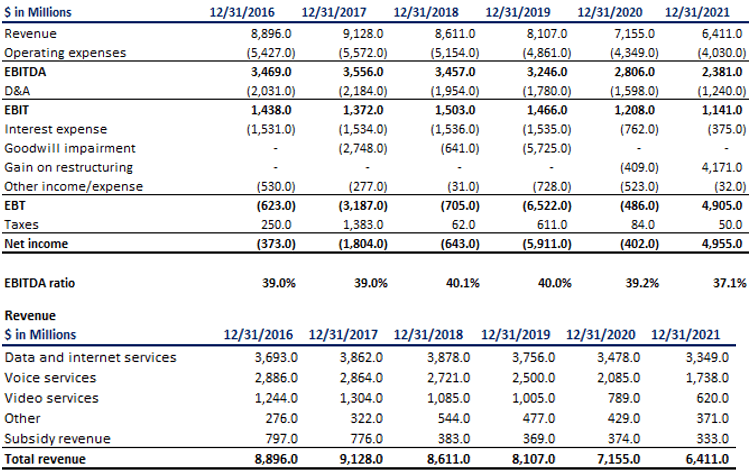
Summary of key financial metrics below:
TIKR Frontier 10-K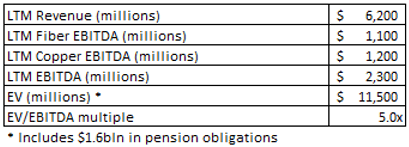
Fiber strategy
The bull case for Frontier is the current financials are not representative of the business once they’ve upgraded their copper footprint and reach terminal penetration with fiber. A quick look at the math behind a fiber overbuild shows the potential. Frontier plans on building 6mm fiber passings over the next 4 years to completely transform the business. Their copper network currently has ~11% penetration on ~11.5mm passings (1.2mm customers) and this is expected to decline as copper can’t provide the required performance.
Frontier has ~42% penetration in their base fiber market (mostly purchased from Verizon in 2015). They disclosed penetration in this market dropped by ~6-8% due to “significant operational challenges” but claim to have fixed the issues and have seen an increase in penetration over the last year. Management believes the terminal penetration for a fiber market is ~45%+. This will mean ~2.7mm new fiber customers when the overbuild is complete and the footprint has matured, compared to ~700k copper currently.
A fiber sub also has significantly higher monthly ARPU than a copper customer, $62 vs $45 per Frontier’s Q1 22 filing (~35% higher). Churn is also lower given fiber is a better-quality product, futureproof, and more reliable. Maintenance capex is also estimated to be lower for fiber, at ~7% of revenues, whereas copper is closer to 13%. So, transform a copper passing to fiber and you can 4x your customer count and increase revenue per customer by ~35%, add in a lower cost to service and the phrase no brainer comes to mind…
Note: for simplicity I’m going to assume the Wave 2 overbuilt is complete as of now and it will take 5 years for Frontier to get terminal penetration. Not realistic but easier to show the strategies potential.
Author Estimates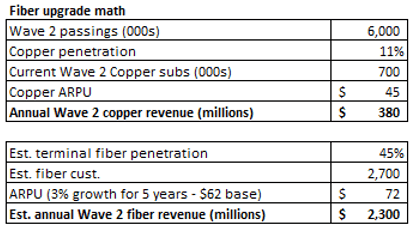
This gives us a ~6x in revenue in 5 years (~43% CAGR) and changes an obsolete asset into the highest quality internet product available.
How much will all this cost? Management believes Wave 2 will cost ~1k per passing with a ~$550 cost to connect (drop cost). They estimate overbuilding their copper footprint is ~20% cheaper than building with no footprint and allows them to build out quicker.
Author Estimates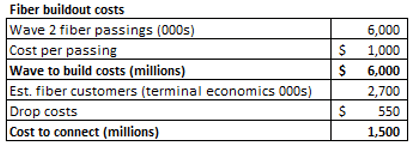
With these assumptions, it’s going to cost Frontier ~$7.5bln to change their legacy copper from a $400mm revenue business with high single digit declines to a $2.3bln growing fiber business. A very rough estimate of EBITDA margins could be ~55-60%, given Frontier has relatively little low margin video revenue and fiber costs to service are lower than cable. This will get us ~$1.3bln in Wave 2 EBITDA, assuming a 3% CAGR in ARPU. Using a 12x EV/EBITDA multiple gives Wave 2 assets an EV of ~$15.5bln, with a cost of ~$7.5bln. This is ~16% implied IRR, right around management disclosed estimates for Wave 2.
However, with any large-scale buildout there’s some potential headwinds management will have to navigate.
Headwinds/potential issues
So, what could trip up Frontier in their quest to transform themselves into a fiber first business? There are a few key ones I’ll look at in more detail:
-
Financing/supply chain issues
-
Fiber penetration isn’t as quick as estimated
-
Cable competition
-
Headwinds from other revenue streams
Financing/supply chain
Frontier’s bankruptcy reduced debt by ~$10bln and gave them the flexibility to accelerate its fiber overbuild. Since the bankruptcy they’ve issued debt twice, $1bln in October 2021 with a rate of 6% and $1.2bln in May 2022 with a rate of ~8.75%. This gives them ~$3.5bln of liquidity (including revolver).
Capex in 2022 will be ~$2.5bln, with my rough estimate being ~$3bln in the years 2023-2025. Internally, they generate ~$1.5-2bln in cash from operations, so ~$1bln cash burn a year through 2025.
Author Estimates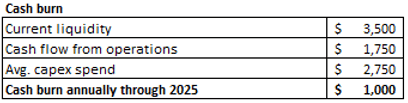
This means they’ll likely have to raise financing at some point in late 2024 but with no debt maturing until 2027, they’ll have flexibility on how they go about this. One potential issue, pretty much all their current debt matures from 2027-2030, so they’ll likely need to start refinancing debt at some point before the Wave 2 build is over (~$8.5bln of maturing debt maturing from 2027 to 2030). Bottom line, financing should be manageable through the Wave 2 buildout, but management of the capital structure will be an important task for executives.
Supply chain has been discussed in pretty much all earnings calls and Frontier presentations over the last year. The U.S. market is ramping up fiber buildouts nationwide, with estimates at ~9mm over the next few years (up from 5mm in 2021), the question around overbuilders having the appropriate labor and materials has been a key concern for the market.
Frontier is very well placed on this front. They’ve shown they can build fiber at scale with their 600k passings in 2021. They’ve hired Veronica Bloodworth as Chief Network Officer in April 2021; at AT&T, Bloodworth was responsible for ~14mm fiber locations (3mm builds a year). The hiring and rollout of their overbuild plans was well timed as Frontier was able to lock-in materials and labor before the recent rush of other fiber build announcements. They also have the 2nd largest overbuild planned (behind AT&T), so have reasonable scale to negotiate with suppliers. They’ll be supply chains issues that come up throughout the fiber buildout, but Frontier appears well placed relative to the competition.
Fiber penetration
The key to the value of a fiber passing is fiber’s terminal penetration is ~45%+. If you believe it’s certain Frontier will get to 45% across 10mm passings, you can probably stop reading here, do some math on the back of an envelope and start buying. I’m a little more skeptical of whether Frontier can get up to 45% quickly for a few reasons.
First, management has stated they compete with 1 or no competition in ~88% of their footprint (both copper and fiber). I tried to map out their footprint to get a sense of the competition at the zip code level. I’ve detailed how I did it as the outcome is admittedly very rough, but I think it adds some useful context to Frontier’s footprint:
-
Frontier lists the cities they offer their service (by state) on their website
-
For each city I got zip codes from unitedstateszipcodes.org
-
I then searched zip codes on HighSpeedInternet.com to identify internet providers in each zip code.
-
I considered a competitor a provider (not Frontier) that offered speeds of >200mbps (I didn’t include fixed wireless or satellite).
I then also detailed the following:
-
The service Frontier offers (I considered >500mbps fiber).
-
Frontier’s main competitor and average number of competitors in that footprint (note: Highspeedinternet.com gives a % of a zip code covered, so I tracked that for both Frontier and competitors).
-
I got the population for each zip code, multiplied it by Frontier’s coverage %, and then got the average household size from Statista (by state) to get an estimate for residential passings.
All this got me to ~9.2mm total passings (going through all the cities Frontier discloses), not that close to Frontier’s 15mm estimate (my number doesn’t include businesses) but I think a good enough to work with. Before we get into the actual numbers, some caveats about the data:
-
Fiber availability is overstated as the website shows the highest speed offered in a zip code, so if half the neighborhood is fiberized, the data shows it as if the whole neighborhood is. This has a large impact as the data I collected shows ~60% of the 9.2mm passings are fiberized (when in reality it’s closer to 30% – implying Frontier has an avg. of ~50% of a zip code is fiberized).
-
The maximum number of available cities that Frontier discloses on their website appears to be 50. So, likelihood is I’m understating in some states where they have a large footprint (where they offer internet in over 50 cities).
-
In instances where there was more than 1 competitor in a footprint, I detailed the one with the largest coverage of that zip code.
I’ve put some summary tables below (apologies in advance for the number of tables):
Overall footprint
Author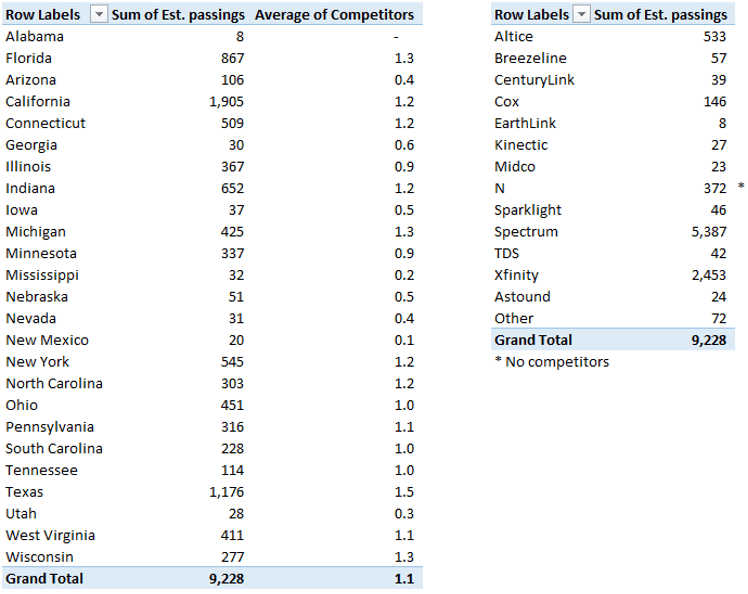
First thing that jumped out to me as I was compiling this data was the fact that there were very few footprints where Frontier had 0 competitors (~4% of the footprint I looked at). The second was the competition across a lot of their footprint is mostly established cable companies like Spectrum, Xfinity, Cox, and Altice. These cable companies have over 50% penetration across their footprints, so assuming this is consistent with the portion of their footprint that overlaps with Frontier, getting to 45% is eventually going to require taking share from cable (mainly Spectrum and Xfinity).
Fiber vs copper
Author Author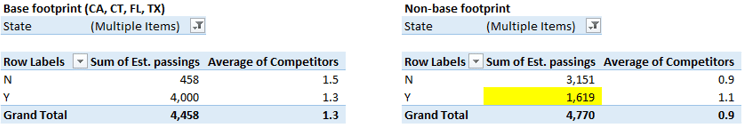
These tables show the breakdown between fiber and copper, split up between Frontier’s base fiber network (CA, CT, FL, TX) and Wave 2 (non-base). For the base footprint, management has disclosed this footprint is ~3.1mm fiber passings (I’m overstating as mentioned above) and the non-fiber footprint relates to Frontier’s prior presence before the Verizon acquisition (mainly Northeast and Southeast California) and the non-fiber CT footprint.
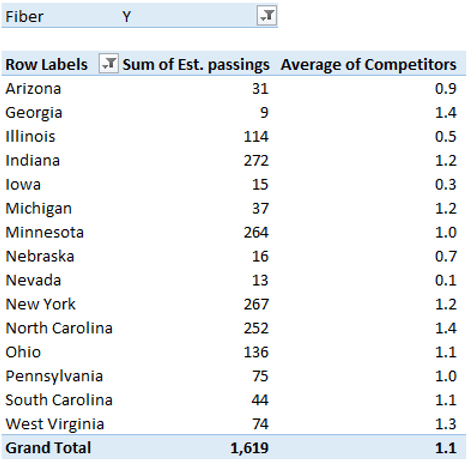
It looks like the main issue with the data on fiber comes from the non-base footprint, where Frontier has fiberized a portion of a zip code and I’m counting it as 100% fiberized (highlighted yellow). While not much can be taken from this, it shows Frontier is fiberizing their footprint across the country, based on the best opportunity set (on average it looks like ~50% of zip code is fiberized). This is in line with management commentary around the very high current penetration levels in their fiber buildouts, and why they’re predicting normalization as buildouts continues. I’ve detailed the states for the non-base fiber footprint to show where the buildouts are currently occurring.
Summary
From looking through the data I’ve got a couple of thoughts. First, while I don’t think management is being disingenuous when they say they compete with 1 or less competitor in ~90% of their footprint, I think it would be more accurate to say, “we compete with 1 established competitor in ~85% of our footprint“. Spectrum, Xfinity, Cox, and Altice cover ~90% of the footprint I looked at, offering 1 gig downstream (I didn’t count a provider as competition if they offered below 200mbps). With an assumed 50% penetration for cable cos, Frontier will need to take every other passing available or, more likely, steal share from cable cos to get to 45%. Not impossible, but not as easy as I thought when taking management competition comments at face value.
The second, management’s Wave 2 buildouts are targeted in areas where they can get fast penetration and high IRRs. This makes sense and assuming they’ve done the math on moving labor and resources around, is smart capital allocation (this is also consistent with their comments). I do have a little bit of hesitation on what this means when they get deeper into their Wave 2 buildout. If you’re in a street in North Carolina and decide it’s better to go wire up a different street 25 miles away (in a different zip code), what does that say about the rest of that zip code? It seems there must be a significant difference in estimated IRRs to take on the costs of moving labor/resources etc., and not cover as much of an area as possible, even if the expected returns are slightly lower. There’s also the headache of not having spotty availability, which can make it harder to let people know your service is available (covering a whole zip code is a lot easier to advertise).
Cable competition
Given 45%+ fiber penetration is going to require eventually taking at least some share from cable, a view on the competitive dynamics in the industry is required. Fiber is a superior way to deliver data (especially upstream), provides a better overall experience, costs less to maintain, and is futureproof. Essentially, fiber is the better option, but coax is already in 90% of U.S. homes, compared with ~40% for fiber.
I think the key to fiber taking significant share is they offer something cable can’t. If a kid can’t play in the metaverse after school because their parents have Xfinity, I think consumers move over to fiber quickly (like 3G to 4G phones with video streaming). If cable can keep up with consumer requirements, I don’t see a quick mass migration to fiber. I see certain subsets of consumers moving over almost immediately (e.g., competitive gamers, tech lovers, and people who despise their cable provider), but I don’t see the average family moving over because there’s a better theoretical product available. There’s a large advantage to being the incumbent. Frontier is an example; they still have ~11% penetration on their copper footprint, years after the product was considered obsolete (I don’t think cable is near being obsolete yet).
Cable is usually slightly cheaper than fiber and DOCSIS 4.0 upgrades will allow it to provide significantly faster upstream speeds. Cable One estimates a DOCSIS 4.0 upgrade is 15-30% of the cost of a fiber upgrade. While DOCSIS 4.0 is at least a year or so away, mid/high splits are allowing cable providers to increase upstream speeds (cable’s biggest deficit when compared to fiber) using current technology. Cable moving away from video, the main reason people hate their cable provider, and into wireless where they offer a cheaper product also adds upside to cables’ value proposition and can help lock in customers (cable cos currently offer wireless for ~$35 a month). This will also help lower churn in situations where customers move within a cable companies footprint; ~50% of moves are crosstown and 75% are intrastate (i.e., most moves are within a cable providers footprint).
A quick word on fixed wireless. I see this as a risk around the edges and could potentially accelerate declines in areas like Frontier’s copper footprint. This does have a small impact on fiber sign ups (it’s easier to switch a current customer to fiber than sign up a new customer with no relationship).
But what does all this mean for Frontier? I think getting to ~30% penetration is very likely for Frontier (around breakeven penetration levels), but I’m a little more skeptical on the next 15-20%. If the average household has satisfactory performance, I don’t see them going out their way to switch.
One final comment on this, cable performance slows down the more people are on the network (you get slower speeds at 7pm). If fiber is successful and starts taking customers, the people that stay with cable will see increased performance, potentially making it harder for fiber to take an incremental cable customer.
Other revenue headwinds
Revenue headwinds
Using the TTM numbers when valuing Frontier leads to a few problems. As mentioned above, there are 3 main headwinds impacting topline growth: subsidy revenue, wholesale repricing, and secular declines in voice and video.
Subsidy revenue is a one-time hit to revenue as the CAF (Connect America Fund) drops off (~$350mm) and is replaced by RDOF (Rural Digital Opportunities Fund). RDOF revenue is ~$80mm annual run rate (less in 2022), so a ~$300mm impact. The CAF subsidy was good margins, so they’ll be a reasonable impact to EBITDA as well. There’s potential for more government funding to replace some of this hole, but 2022 look like a ~5% topline drop from the expiration of CAF.
The wholesale segment is made up of a small number of relationships that really matter (AT&T, Verizon etc.) and pre-bankruptcy, Frontier’s priced itself out of the wholesale market due to short-term solvency issues. At the analyst day in August 2021, they laid out a plan to reset their pricing strategy and rebuild relationships to take advantage of a growing 5G market. This will lead to a short-term hit to wholesale in 2022 but management expects to return to growth by the end of 2022. This should be a ~$50-100mm impact in 2022 before return to growth in 2023.
Secular declines for video and voice will persist and while their impact will shrink as fiber revenue grows, they make up a reasonable portion of Frontier’s topline. Voice was ~$1.7bln of revenue in 2021 (~25% of total revenue) and has declined ~40% since 2016 (-9.6% CAGR). This will continue and while the impact will get smaller, the gross impact will still be ~$125mm in 2022. Video is a smaller part of revenue (~$600mm), but the declines have been more substantial as they stopped advertising video to new customers in early 2021. Video revenue declined 20% in 2021 and is down 50% since 2016.
Author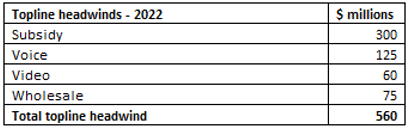
Add this all up and you get ~$550mm topline impact in 2022, with ~$150-200mm recurring in nature (video and voice).
Valuation
For a rough valuation I’ll attempt to estimate 2026 EBITDA and then use an EV/EBITDA multiple to get an enterprise value. They’ll be lots of change in the makeup of Frontier’s revenue over the next few years, but at a high-level fiber will more than make up for copper losses, but secular declines in video and voice will make it hard for Frontier to generate much topline growth.
Author Esimates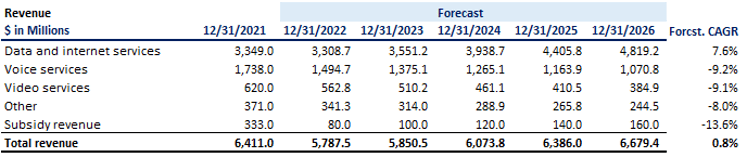
I’m predicting data and internet service to grow at ~8% CAGR over the forecast period, driven by ~3mm consumer fiber customers in 2026 (up from 1.3mm in 2021) with $70 ARPU. This follows management’s guidance on buildouts and penetration (~20% CAGR thru 2026). This is offset by copper subscribers declining to ~650k (-50%). I have wholesale revenue declining in 2022 and then return to growth throughout the rest of the forecast period (3% CAGR).
Voice and video services will continue their consistent declines which has ~$1bln impact on revenue over the forecast period (-9% CAGR for both).
Other revenue has a one-time impact in 2022 due to Frontier disposing of their CPE business; this is expected to be a $50mm headwind for topline but minimal impact to EBITDA. The rest of their other revenue is generated from directory listing services and switched access fees, both of which are likely to continue declining.
I’ve assumed subsidy revenue gets back to $160mm by the end of the forecast period, but given the government’s recent push for internet access, there’s probably some upside here.
EBITDA margin will increase ~350bps over the period due to video rolling off and inherently higher margins from fiber.
Author Esimates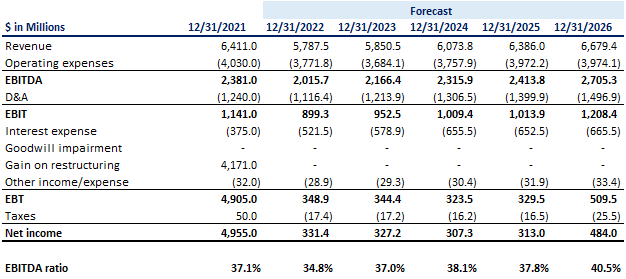
I’ve assumed an increase in debt of ~$3bln to keep funding fiber overbuilds. There’s a good possibility of some sales relating to Wave 3 passings but I’ve assumed there are no sales and included a continued decline in copper subs. I’m using a 9x EBITDA multiple that recognizes the fiber business but still acknowledges some execution risk (mainly continuing to increase penetration) and the fact 1/3rd of the network will still be copper. I’ve assumed no dilution for stock comp but left the expense in the calculation of EBITDA.
Author Esimates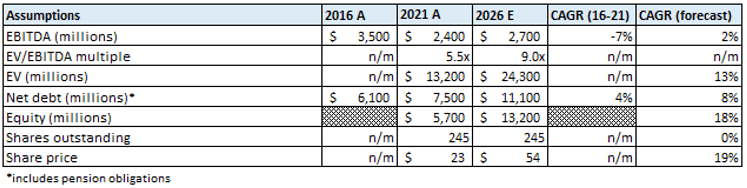
This leads to a ~$55 stock and a ~20% CAGR over the next 5 years. The problem I have is this scenario is line with management targets and requires great execution, taking share from cable, and a significant increase in the multiple. I agree this is in the range of possible outcomes, I’m just not sure I like the odds I’m being offered, given there’s a high chance of financial distress if it doesn’t work out.
Conclusion
If you believe fiber is going to encroach significantly on cable over the next 5 years, Frontier is a great way to play that thesis. I’m passing for the reasons mentioned above but I see the appeal if you disagree with my thoughts on cable (mainly cable competition). It will be very interesting to see how the industry changes over the next few years. Thanks for reading.
Be the first to comment