

4kodiak/iStock Unreleased via Getty Images
Introduction
My thesis is that Amazon (NASDAQ:AMZN) investors face uncertainty as details are sparse with respect to the economics of disparate businesses. Looking at the Alibaba (BABA) 4Q22 release, we see the trailing-twelve-month (“TTM”) operating income by segment but Amazon doesn’t break things out the same way. We do see top line sales by segment at Amazon, but little is shared in the way of operating income apart from the AWS segment and a breakdown between North America and International.
Opaque Numbers
Amazon’s Subscription services segment has similarities to Alibaba’s Digital media and entertainment segment. This Alibaba segment had TTM negative operating income of RMB 7,019 million through March 2022 on revenue of RMB 32,272 million. Costco (COST) is at the other end of the extreme in this area as much of their overall profit comes from membership fees. I believe Amazon is much more like Alibaba than Costco in this area such that it subsidizes commerce sales as opposed to being a direct driver of operating income.
Relative to Amazon and JD (JD), Alibaba has an asset-light model with respect to logistics. We see that Alibaba’s Cainiao logistics segment had TTM negative operating income of RMB 3,920 million through March 2022 on revenue of RMB 46,107 million. Amazon shows the overall fulfillment expense line in the income statement, but this is combined for first-party (“1P”) and third-party (“3P”) and they don’t break out fulfillment revenue. This fulfillment expense line jumped from $16.5 billion in 1Q21 to $20.3 billion in 1Q22. The cost of logistics at Amazon is very high and this makes it difficult to determine operating margins for the 1P and 3P segments.
Valuation Overview
Where the Money Is by Adam Seessel makes long-term non-GAAP operating margin estimates for Amazon’s segments. Seessel came up with 10% for 1P, 5% for physical stores, 0% for subscriptions, 25% for 3P and 50% for other/advertising. The book is packed with good information and these estimates are very helpful. My estimates are somewhat close to the estimates in the book, and both sets of estimates are vastly different from the current GAAP numbers.
Viewed through a GAAP accrual lens, Amazon’s commerce numbers are uninspiring as we move down the income statement. Per the 1Q22 release, overall operating income decreased to $3.7 billion for 1Q22, compared with $8.9 billion for 1Q21. These numbers are much worse without the highly profitable AWS segment. In 1Q22, the $3.7 billion overall operating income consisted of $6.5 billion from AWS and negative $2.8 billion from everything else. In 1Q21, the overall $8.9 billion total operating income was $4.2 billion from AWS and $4.7 billion from the other segments.
Of course, cash flow is what matters which is why Amazon presents the cash flow statement before the accrual-based income statement. Unfortunately, I don’t see a segment breakdown for cash flow which means it is hard to separate AWS from everything else. Overall operating cash flow was $(2.8) billion for 1Q22, down $7 billion from $4.2 billion in 1Q21. TTM OCF was $39.3 billion and CFO Olsavsky provided a breakdown of the TTM capex and finance leases in the 1Q22 call:
First, as a reminder, we look at the combination of CapEx plus finance leases. Capital investments were $61 billion on the trailing 12-month period ended March 31. About 40% of that went to infrastructure, primarily supporting AWS but also supporting our sizable Consumer business. About 30% is fulfillment capacity, primarily fulfillment center warehouses. A little less than 25% is for transportation. So think of that as the middle and the last-mile capacity related to customer shipments. The remaining 5% or so is comprised of things like corporate space and physical stores.
Commerce Valuation
Taken together, Amazon’s 1P sales plus their physical store sales and 3P GMV are at about the same level as Walmart’s sales. In the quarter through April 2022, Walmart had net sales of $140.3 billion along with membership and other income of $1.3 billion for total revenues of $141.6 billion. Looking at Amazon’s quarter through March 2022, they had $51.1 billion in 1P sales plus $4.6 billion in physical stores sales and $25.3 billion in 3P sales. The 3P figure is just Amazon’s cut and 3P GMV is estimated to be about 3.75 times this amount or $95 billion. As such, Amazon had nearly $151 billion for 1P sales, physical stores sales and 3P GMV compared to Walmart’s $140.3 billion sales.
Walmart’s market cap is about $336 billion based on the July 1st share price of $122.63 and the 2,741,150,050 shares outstanding as of June 1st. Walmart’s 10-Q through April 2022 shows long-term debt and lease obligations of $49,809 million such that their EV exceeds their market cap. As a sanity check, I like to think about Walmart’s market cap and enterprise value. Amazon’s commerce segments move about the same amount of volume as Walmart and they’re growing faster; they’re worth significantly more than Walmart when we include advertising in the mix.
I believe Amazon’s long-term 1P operating margin is lower than Seessel’s 10% estimate, but he makes some valid points as to why the steady-state margin is higher than what we see on today’s income statements. As he says, Amazon has consistently said that their online retail margins should be 10% to 13% at maturity. Walmart’s margins are lower than this, but Seessel notes that Walmart has to spend troves of money maintaining over 10,000 physical stores. He notes that Walmart has to maintain over physical 10,000 stores. Seessel goes on to explain other ways in which Amazon 1P is advantaged over Walmart:
Common sense told me that this segment’s margins should be at least equal to Walmart’s 6%. Several calculations seemed to back that up. Walmart’s depreciation expense, the proxy for how much it must spend to maintain its physical plant, amounts to 2% of its annual sales. Amazon has no physical customer traffic in its virtual store, so it was logical to assume that Amazon’s depreciation expense is de minimis by comparison. Moreover, because it operates online, Amazon does not have to worry about “shrink,” the euphemism retailers use for shoplifting. While Walmart works hard to minimize theft – those “greeters” aren’t at the door just to welcome you – last year Walmart lost roughly $5 billion to sticky fingers. This amounts to one percentage point of margin lost to shrink. If we assume that Amazon’s margins begin at Walmart’s 6%, and then we add two points of depreciation that Amazon doesn’t have to incur and one percentage point for shrink, Amazon’s online retail earnings power becomes 9% of sales.
[Kindle Location: 1,927]
Again, Amazon moves about $50 billion in 1P GMV and about $100 billion in 3P GMV every quarter. They don’t need physical stores for this but Supply Chain Dive shows that they require more distribution square footage than Walmart and Target combined. Here are the square foot totals:
Amazon: 376 million active + 109.8 million future
Walmart: 145.5 million active + 17.8 million future
Target: 57.7 million active + 4.3 million future
Nearly all of Amazon’s square footage is leased and it has climbed rapidly since 2019:
Amazon properties (Author’s spreadsheet)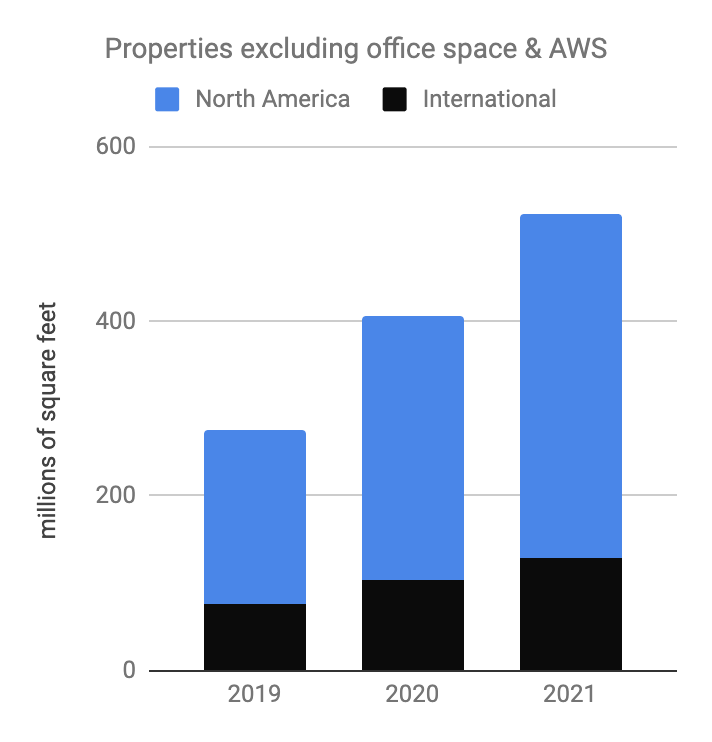
Image Source: Author’s spreadsheet
A May WSJ article by @SebasAHerrera explains that Amazon has expanded their footprint above too quickly:
The online retail giant is seeking to sublease a minimum of 10 million square feet of warehouse space and is also exploring options to end or renegotiate leases with outside warehouse owners, according to a person familiar with the matter.
The article goes on to say that the amount of space vacated may be 2 to 3 times the number of 10 million square feet mentioned earlier.
We can look at Walmart and Target’s operating margins to better understand the steady-state numbers for Amazon. Walmart has a lower operating margin than Target, but they turn inventory over faster. Looking at the 10-K filings for the fiscal year through January 2022, Walmart had inventory turnover of 8.5x or $429,000 million cost of sales/$50,730 million avg. industry while Target had inventory turnover of 6.1x or $74,963 million/$12,278 million. Unlike Walmart and Target who use last-in, first-out (“LIFO”) for U.S. inventory, Amazon uses first-in, first-out (“FIFO”). Also, Amazon seems to show these numbers on a company-wide basis as opposed to a 1P basis.
For the fiscal years through January 2020, 2021 and 2022, Walmart had operating margins of 3.9% [$20.6 billion/$524 billion], 4% [$22.5 billion/$559.2 billion] and 4.5% [$25.9 billion/$572.8 billion], respectively. For the fiscal years through January 2020, 2021 and 2022, Target had operating margins of 6% [$4.7 billion/$78.1 billion], 6.9% [$6.5 billion/$93.6 billion] and 8.4% [$8.9 billion/$106 billion], respectively. Amazon has a model of moving inventory quickly like Walmart which often means low margins. However, Amazon doesn’t have to maintain physical stores and they don’t have shrinkage. On balance, I think Amazon’s 1P operating margin is higher than what we see from Walmart, but it is hard for me to see it being too high given all the investments they have to make in technology and logistics. They don’t just make growth investments in these areas; they have to invest heavily in these areas just to tread water and move the same volume. I think the steady-state operating margin for the 1P business is about 7%.
Amazon 1P TTM sales through March 2022 were $220,303 million and the implied steady-state operating income is $15.4 billion if we use a 7% margin.
Amazon’s 1P growth has slowed but it is remarkable what this segment has done since 2016. In 1Q22, Amazon 1P had sales of $51.1 billion while eBay had GMV of $19.4 billion. Meanwhile, Target had revenue of $25.2 billion through the April 2022 quarter. There was a time not long ago when these numbers were more tightly bound and in a different order. In 1Q16, Amazon 1P had sales of $19.9 billion while eBay’s GMV was $20.5 billion. Back then, Target had revenue of $16.2 billion through the April 2016 quarter. Given Amazon’s 1P growth, I think this business may be worth a higher multiple than what we see for Target or eBay. I think this segment is worth 10x the steady-state operating income which is a little over $150 billion
Moving on to the 3P segment, Alibaba is a nice reference point. Bereft of Amazon’s asset-heavy fulfillment architecture, Alibaba has far fewer employees despite the fact that they move double the GMV. There were 1,608,000 full-time and part-time employees at Amazon as of December 31st while Alibaba only had a total of 254,941 employees through March 31st. The extent of wage inflation in the coming years isn’t clear right now but it could be substantial. Alibaba’s China commerce segment had operating margins of 39% and 29% for the fiscal years ending in March 2021 and March 2022, respectively. I think Adam Seessel’s estimate of 25% operating margins for Amazon 3P is a little ambitious given Amazon’s investments in the low-margin logistics business and the coming wage inflation. I think steady-state operating margins for this segment are about 20%.
3P TTM sales are $104,992 million so a steady-state operating income based on a 20% margin is $21 billion. I think this segment deserves a higher multiple than the 1P segment because it isn’t as asset-heavy. I believe a multiple of 14 or 15 times is in order such that this segment is worth about $295 to $315 billion. Seeing as 3P does about twice the dollar volume of 1P, it is reasonable for this segment to be worth twice as much as the $150 billion 1P figure mentioned earlier.
TTM sales for physical stores was $17.7 billion which means steady-state operating income is about $900 million assuming a margin of 5%. A multiplier of around 10 times is reasonable such that this segment might only be worth $9 billion which is less than what Amazon paid when they acquired Whole Foods.
I include the subscriptions segment with commerce. I think Amazon is somewhere between Alibaba which loses money in this area and Costco which makes much of their profit here. I assign a valuation of $0 to this segment for Amazon.
Putting these segments together, I get the following:
$150 billion 1P
$295 to $315 billion 3P
$9 billion Physical stores
$0 Subscriptions
———————–
$454 to 474 billion Commerce excluding advertising. Taking rounding a bit further, I think of these segments as being in the general range of $450 to $475 billion.
Advertising Valuation
Amazon’s 1Q22 ad revenue was $7,877 million implying a run rate of $31.5 billion. Of course, we expect 2022 ad revenue to be well above this run rate given the seasonal 4th quarter. Meta’s 2017 operating income was just under 50% or $20.2 billion/$40.7 billion. In 2018, Meta’s operating margin was a little under 45% or $24.9 billion/$55.8 billion. I think Amazon’s steady-state operating margin for this segment is about 45% such that TTM operating income is about $14 billion. I think the segment is worth about 14 to 16 times this operating income which is about $200 to $225 billion.
AWS Valuation
Per the 1Q22 release, AWS GAAP operating income was $6,518 million implying a run rate of $26 billion. The non-GAAP steady-state operating income is higher given the growth investments in income statement lines. In times of lower interest rates, I thought AWS was worth 25 to 30x annualized operating income. Interest rates keep going up, so multiples have to come down. I now think a more appropriate multiple range here is 20 to 25x such that the valuation range is $520 to $650 billion.
Valuation of Other Considerations
UPS (UPS) and FedEx (FDX) have large market caps and Amazon might have a substantial part of this business from companies outside their marketplace in the coming years. Amazon might also be active in the healthcare space in the coming years. These considerations are hard to see in today’s financial statements, but they could be worth $25 billion – kind of like the way AWS was hard to see before management broke out the financials.
Valuation Summary
$450 to $475 billion Commerce excluding advertising
$200 to $225 billion Advertising
$520 to $650 billion AWS
$0 to $25 billion Other Considerations
————————————–
$1,170 to $1,375 billion
The 1Q22 10-Q shows 508,720,481 shares outstanding as of April 20, 2022, which is now 10,174,409,620 after the 20-for-1 split. Multiplying this by the June 30th share price of $106.21 gives us a market cap of $1.08 trillion and the enterprise value is relatively close to this. I believe the stock is undervalued as the market cap is beneath my valuation range.
Disclaimer: Any material in this article should not be relied on as a formal investment recommendation. Never buy a stock without doing your own thorough research.
Be the first to comment