

ScottOrr/E+ via Getty Images
The last few times I’ve covered copper giant Freeport-McMoRan (FCX), I’ve been bearish. The most recent instance was back in August when I said that copper was going to take Freeport with it lower. The stock fell from $37 at publication to $30 a few weeks later, so I’ll count that one as a win.
However, I’m now to the point where I think Freeport has made its bottom, and has the potential to go much higher.
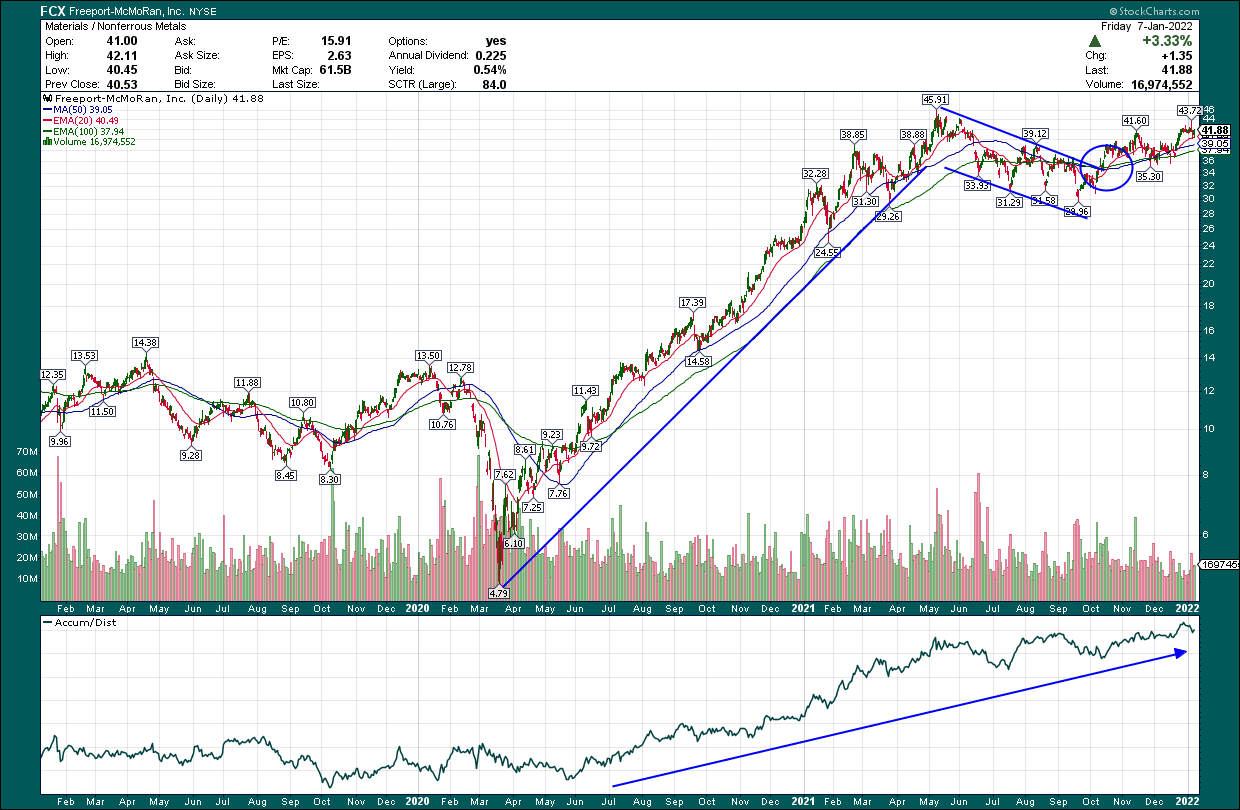
Source: StockCharts
Let’s first look at a three-year daily chart of Freeport, which shows a massive uptrend off the pandemic bottom to the new high at $46, which was set early last year. Then, we get a months-long bull flag forming, followed by a subsequent breakout of that flat to the upside. This pattern was still forming the last time I covered Freeport, which is why I was still bearish at that time. That’s also why I’m changing my tune now; the evidence has changed, and so has my opinion.
Apart from the breakout in price, which is very bullish, we can also see the accumulation/distribution line is continuing to move higher, so we’re getting some confirmation of this rally. The only thing I want to see to put the final nail in the coffin of the bears is a breakout to a new price high.
Let’s now take a closer look at the daily action by zooming in on the same chart.
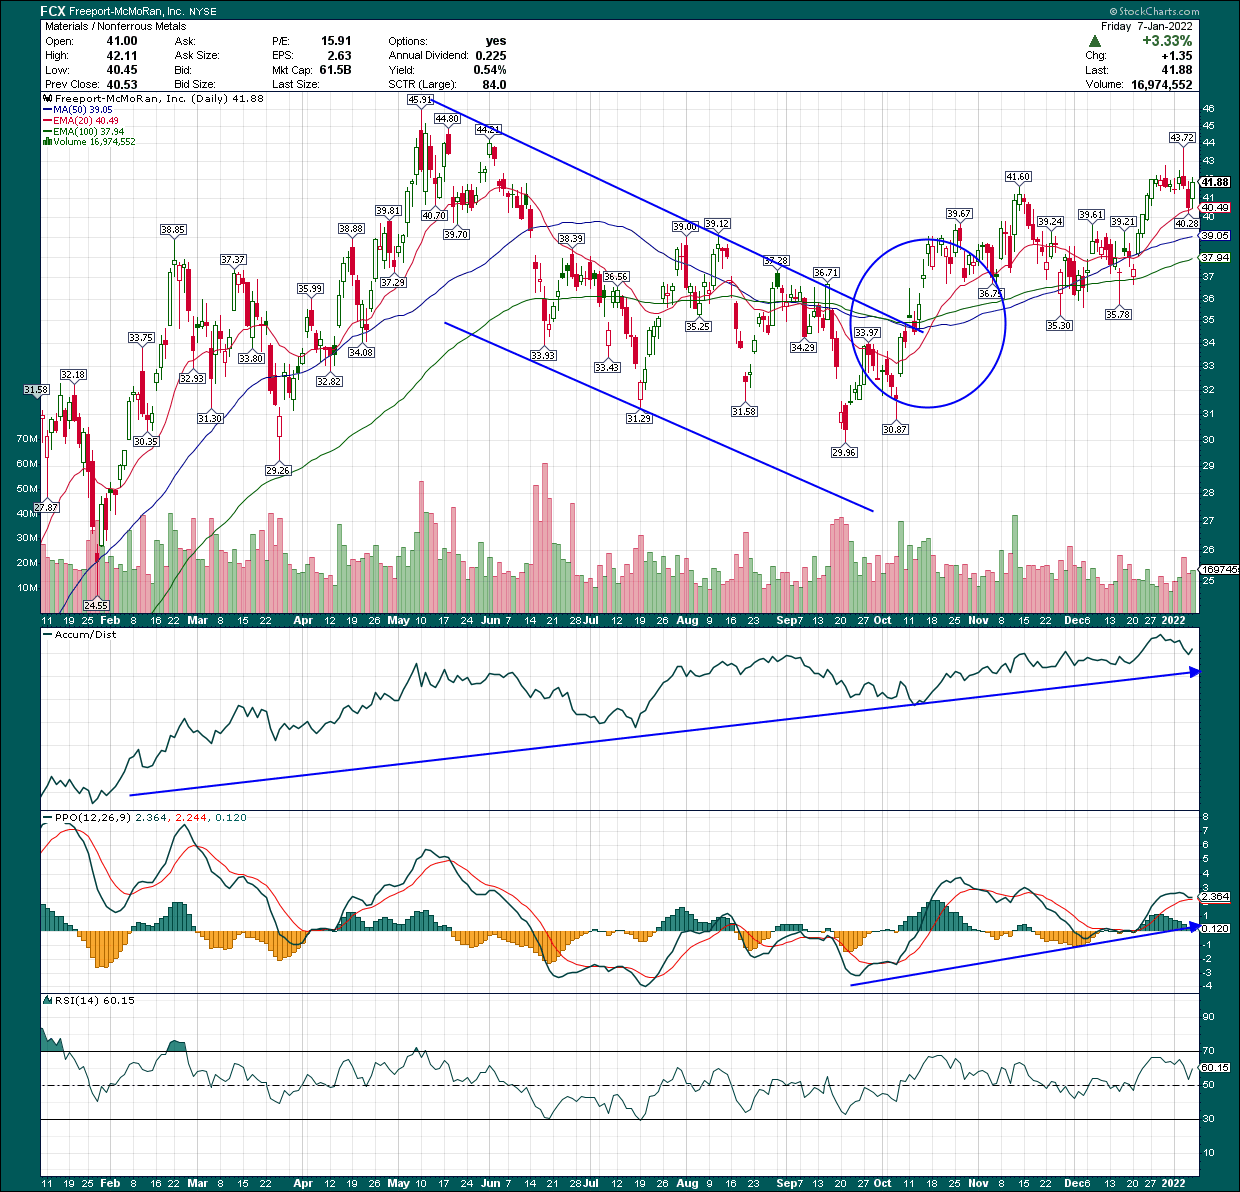
Source: StockCharts
I already mentioned the A/D line, but if we look at the PPO, which measures momentum, we see a bullish picture as well. The PPO bottomed at -3 in September and has since made new relative highs. We saw a pullback in the PPO to the centerline in December, which was met with another rally. That’s exactly what we want to see. We’re in another consolidation right now, but I fully expect this consolidation and/or pullback will be shallow and will not reset the PPO to the centerline.
Finally, the moving averages are all going sharply higher, and I believe we’ll see those function as support as the stock rallies. All things considered, Freeport looks pretty bullish to me, now that the bearish phase I wrote about in 2021 has concluded.
I’ve covered Freeport’s tight correlation to copper before, including the linked article above, so I won’t go through that again. But one thing I haven’t covered is its correlation to the dollar, which we can see below on a 20-day basis.
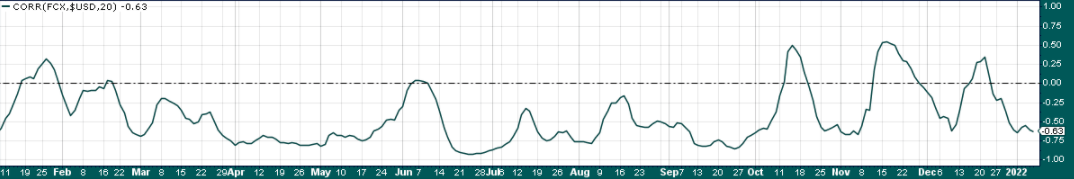
Source: StockCharts
Freeport’s correlation to the dollar is pretty strong, and inverse, obviously, meaning they tend to move in opposite directions. That’s the case with just about any commodity you can think of, given they are priced in dollars. That is because as the dollar devalues, the relative value of the commodity rises in the now less valuable dollar. The opposite is true when the dollar rises.
Freeport’s inverse relationship with the dollar isn’t perfect, but it generally moves opposite to the dollar, so let’s take a look and see what kind of clues we can gain from the greenback’s chart.
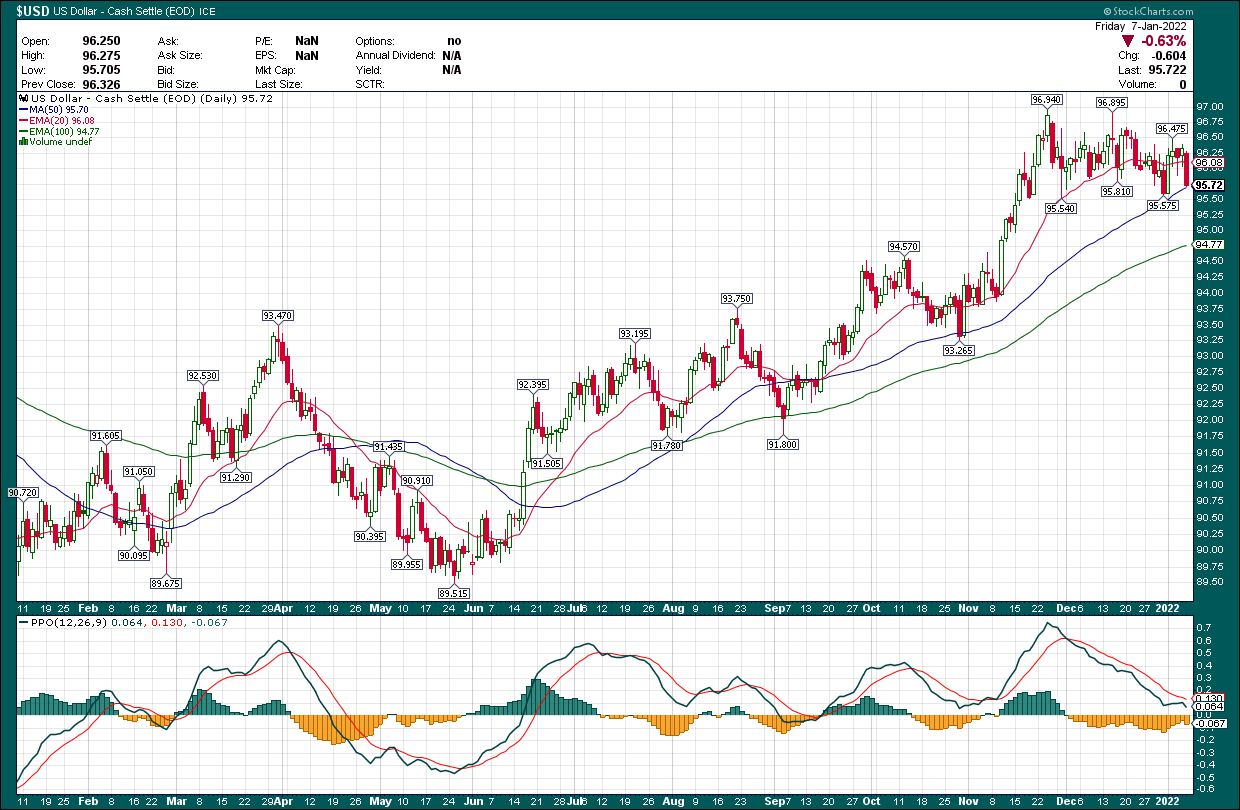
Source: StockCharts
The dollar has been in a long uptrend while commodities have rallied, which is a bit of a strange occurrence. The dollar, however, looks to be at a crossroads; there’s been a consolidation at the high for almost two months, and the PPO has reset from very overbought levels to the centerline. I’m leaning a bit bearish on the dollar at this point, but this is by no means a slam dunk. The way the dollar reacts at the PPO centerline, and in the face of rising moving averages, will have wide-ranging implications for commodities in general, and therefore, Freeport’s share price.
If the dollar ends up breaking support, copper and Freeport could be off to the races. That’s my base case, but if the dollar bounces and rallies again, Freeport’s share price will see more consolidation, so that’s a risk to keep in mind.
Freeport-McMoRan – The fundamental case
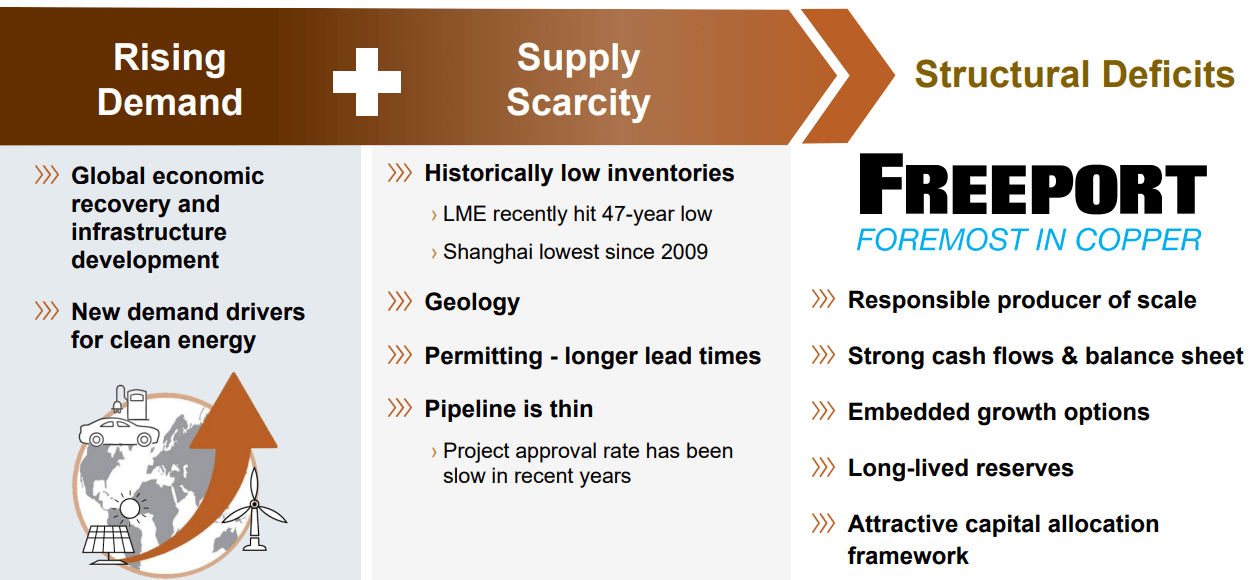
Freeport sells molybdenum and gold, but those are very small in comparison to the company’s copper business, so that’s where we’ll focus. This chart shows a long-term, high-level look at the case for copper, a metal which is historically very correlated to economic growth. But in the case of copper, the rise of electric vehicles is an additional long-term catalyst we’ve never seen before.
Source: Investor presentation
The continued global economic recovery, which I think has some ways to go, in addition to the unstoppable force that is the global move to EVs rather than internal combustion, are both very good for copper. And what’s good for copper is good for Freeport.
Freeport reckons that electric vehicles use four times more copper than internal combustion vehicles, and given that about two-thirds of demand for copper worldwide is to conduct electricity, the continued push from the world’s developed economies for cleaner electric power bodes very well.
That ties into the equation from the slide above where inventories are very low, but demand is rising. This virtuous cycle leads to higher prices and higher demand, a scenario where producers can see explosive revenue and margin growth. While some of that is baked in already, there’s still some upside potential, I think.
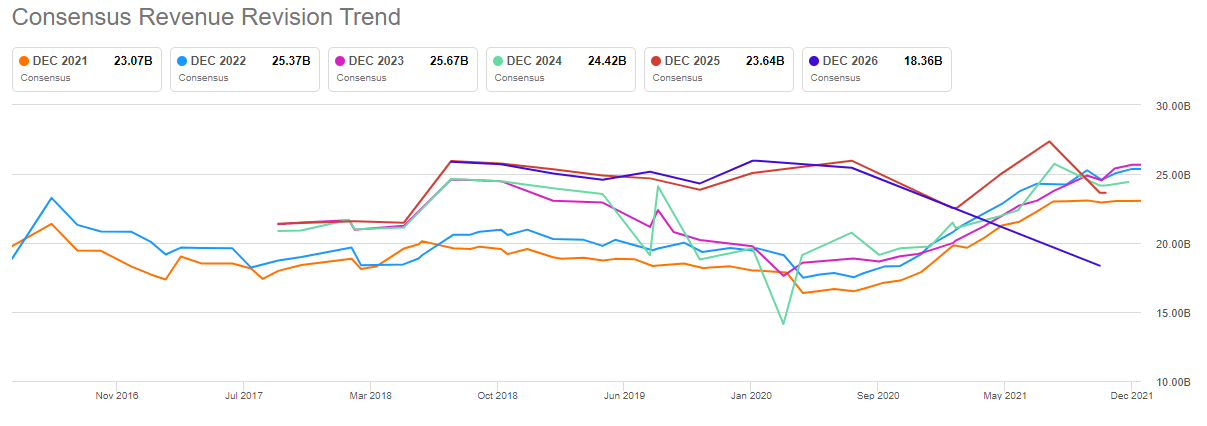
It would follow, then, that revenue estimates should be rising, so let’s take a look at Freeport’s revision schedule.
Source: Seeking Alpha
We can see a sustained rise in revenue estimates from the pandemic bottom through today, apart from the out years. Fiscal 2025, for instance, has seen its revenue estimates decline substantially. I’m not overly concerned about that at the moment just because we know all commodities go through cycles. The idea that copper’s outlook could be weak three years from now is a long way from outlandish, so just keep in mind if you’re buying anything commodity-related, you cannot just hold it forever. I’m making the case for Freeport for the next few months, not as a hold-forever position.
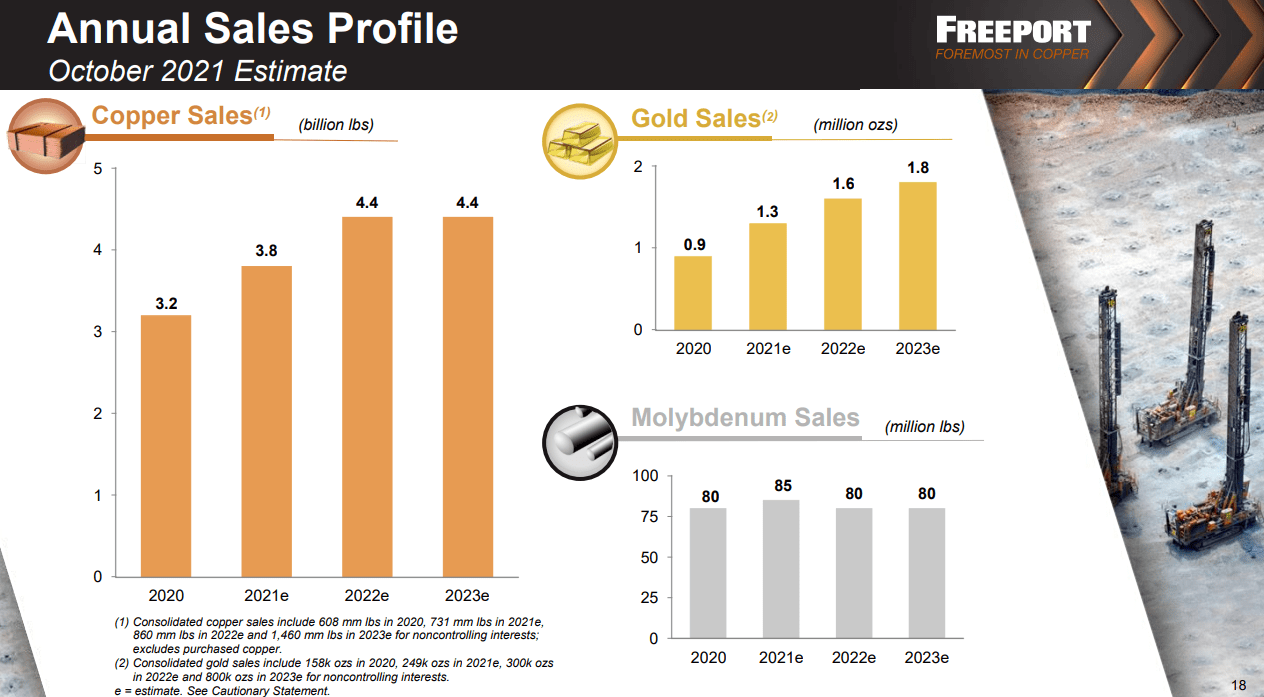
One thing that could derail Freeport’s bull case into 2023 is flattening production totals, which we can see below.
Source: Investor presentation
This year should see another massive jump in copper sales, but the company’s own estimate for production into 2023 is for it to be flat. That’s not necessarily bearish, but it isn’t bullish either, since the increase in gold sales that is projected for next year will be so small as to be nearly meaningless. Thus, I think we may see one last hurrah for Freeport shares in 2022 before they enter another bearish cycle. This lines up with what the chart is saying, but I think the fundamentals are telling us that as well.
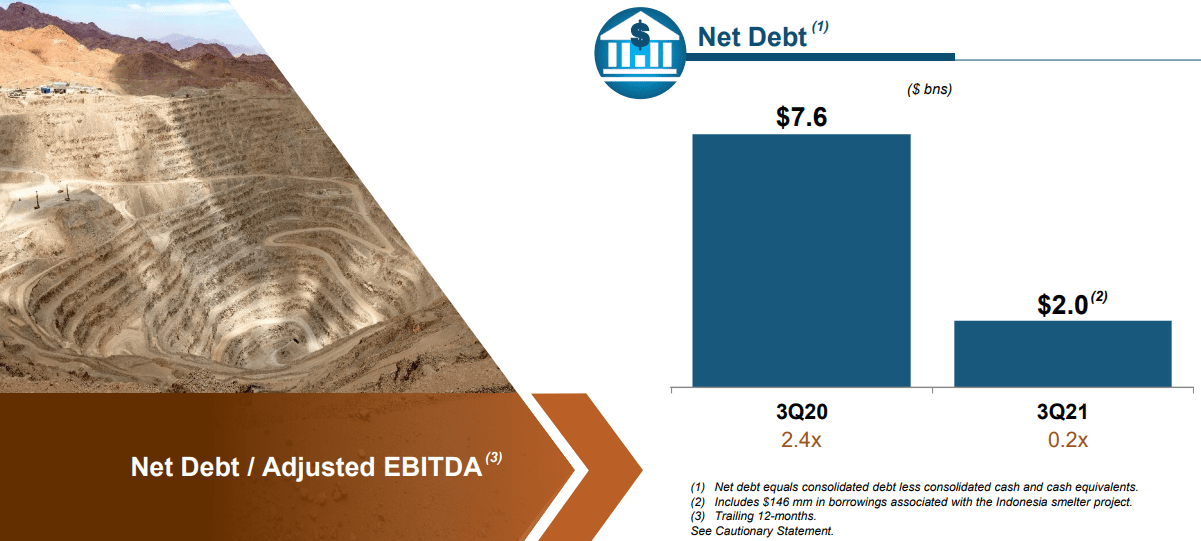
One thing Freeport has done a really tremendous job of in recent years is reducing its debt. This chart shows Freeport’s net debt in the space of just one year, from Q3 2020 to Q3 2021, and its nearly $6 billion reduction. Freeport was massively overleveraged in years past, but it has no such issue today, and that’s going to be great for its ability to weather the next commodity down cycle. Freeport can be a buyer of weaker competitors if/when they run into trouble during copper’s next bear market now that it has deleveraged so much.
Source: Investor presentation
This is a really terrific development for the long-term health of the business, so I just wanted to mention it briefly. It doesn’t necessarily bolster the bull case for now, but assuming Freeport uses its newfound financial stability wisely, it could be a differentiator during the next down turn.
Let’s value FCX stock
Before we get to the valuation, let’s take a look at Freeport’s EPS revisions, which I think show a similarly bullish trend as revenue.
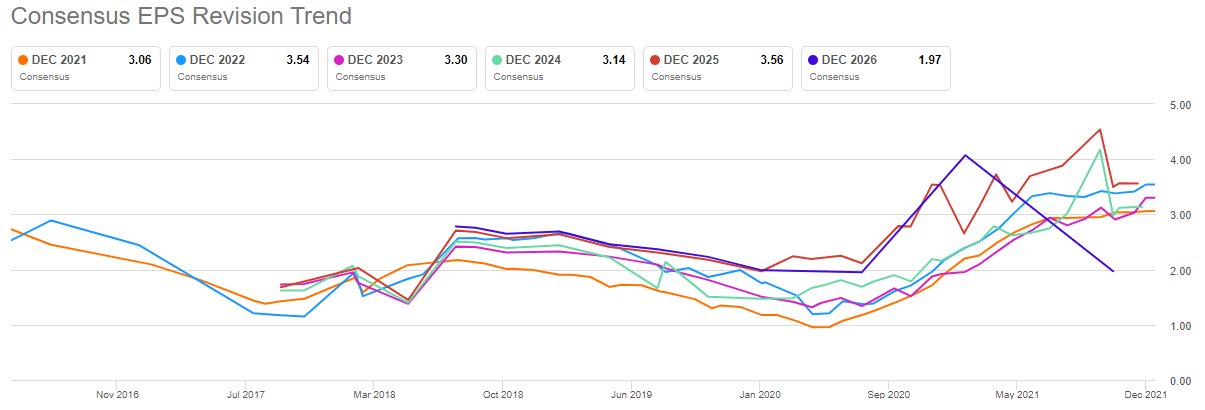
Source: Seeking Alpha
We see almost the exact same behavior as with revenue so I won’t spend a great deal of time here. But the point is that revisions are at or near their highs for the closest years, and that those are continuing to rise. That’s exactly what you want from a stock you own.
The other thing you want is a reasonable valuation, and as we can see below, Freeport checks that box as well.
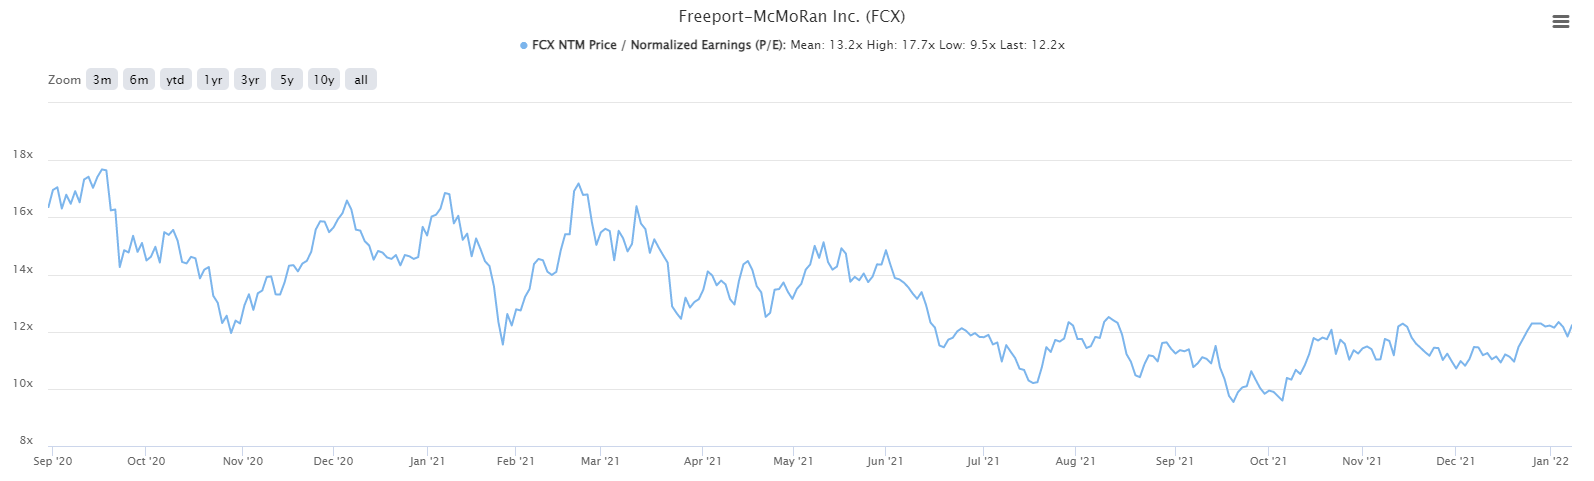
Source: TIKR
The forward P/E is 12.2, which is below the average of 13.2 for the past 18 months, and is very much towards the bottom of the range. Freeport was cheaper a few months ago when it was still in the bull flag formation, but it’s still reasonably valued now, and has broken out.
It’s this combination that I think gives Freeport the edge, and why I’m now bullish after my past few coverages being bearish. We have a stock that has broken out of a long consolidation pattern, a strong fundamental case (at least for a year or so), and an attractive valuation. All things considered, I like Freeport to continue this move to the upside.
Be the first to comment